

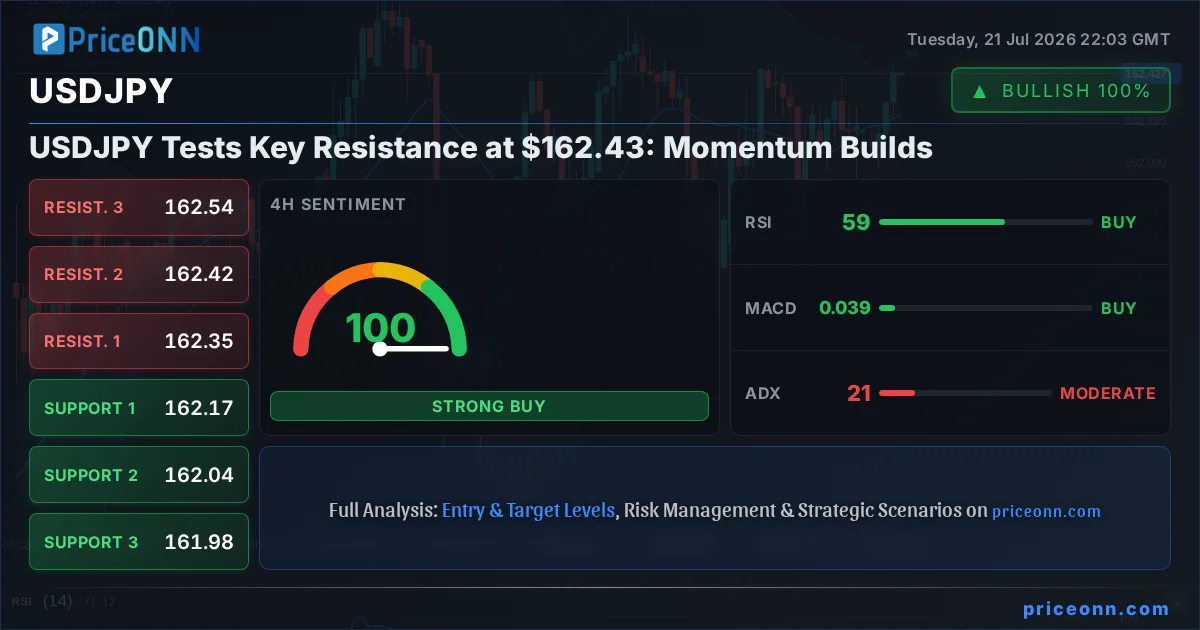
USDJPY is currently trading at $162.43, teetering on the edge of a crucial resistance level. The pair has demonstrated building bullish momentum, but traders are questioning whether this ascent can overcome the technical hurdles ahead. This analysis dives deep into the multi-timeframe technicals, exploring the most probable scenarios and the key triggers that could dictate USDJPY's next significant move.
- USDJPY shows strong bullish momentum with RSI at 66.56 on the 1H chart, nearing overbought territory.
- The key resistance level to watch is $162.43, with further resistance seen at $162.54 and $162.68.
- The ADX at 19.33 on the 1H indicates a weak trend, suggesting the current upward move may lack sustained conviction.
- Correlations with DXY (currently 100.7) are crucial; a stronger dollar typically pressures USDJPY.
The battleground for USDJPY appears to be forming around the $162.43 mark. This level isn't just another price point; it represents a significant technical barrier that has historically capped the pair's upward progress. As we observe the 1-hour chart, the Relative Strength Index (RSI) is climbing steadily, currently sitting at 66.56. While not yet in overbought territory (typically considered above 70), this upward trajectory suggests that buyers are gaining traction. However, the low ADX reading of 19.33 on this timeframe points to a lack of strong trend conviction, meaning this advance could be vulnerable to a sharp reversal if the underlying pressure falters.
Looking at the 4-hour timeframe, the picture becomes more bullish. The trend is clearly identified as bullish with a strength of 95%, and the Moving Average Convergence Divergence (MACD) histogram is showing positive momentum, sitting above the signal line. This suggests underlying buying pressure that could propel the pair higher. The Stochastic Oscillator, with K at 72.43 and D at 58.51, also favors further upside, indicating that the pair is in the upper range and potentially heading towards overbought conditions. However, the ADX here is 20.71, still indicating a moderate trend rather than a strong, sustained move. This reinforces the idea that while the path of least resistance might be upwards, significant resistance lies ahead.
Navigating the Resistance: The Bull's Roadmap
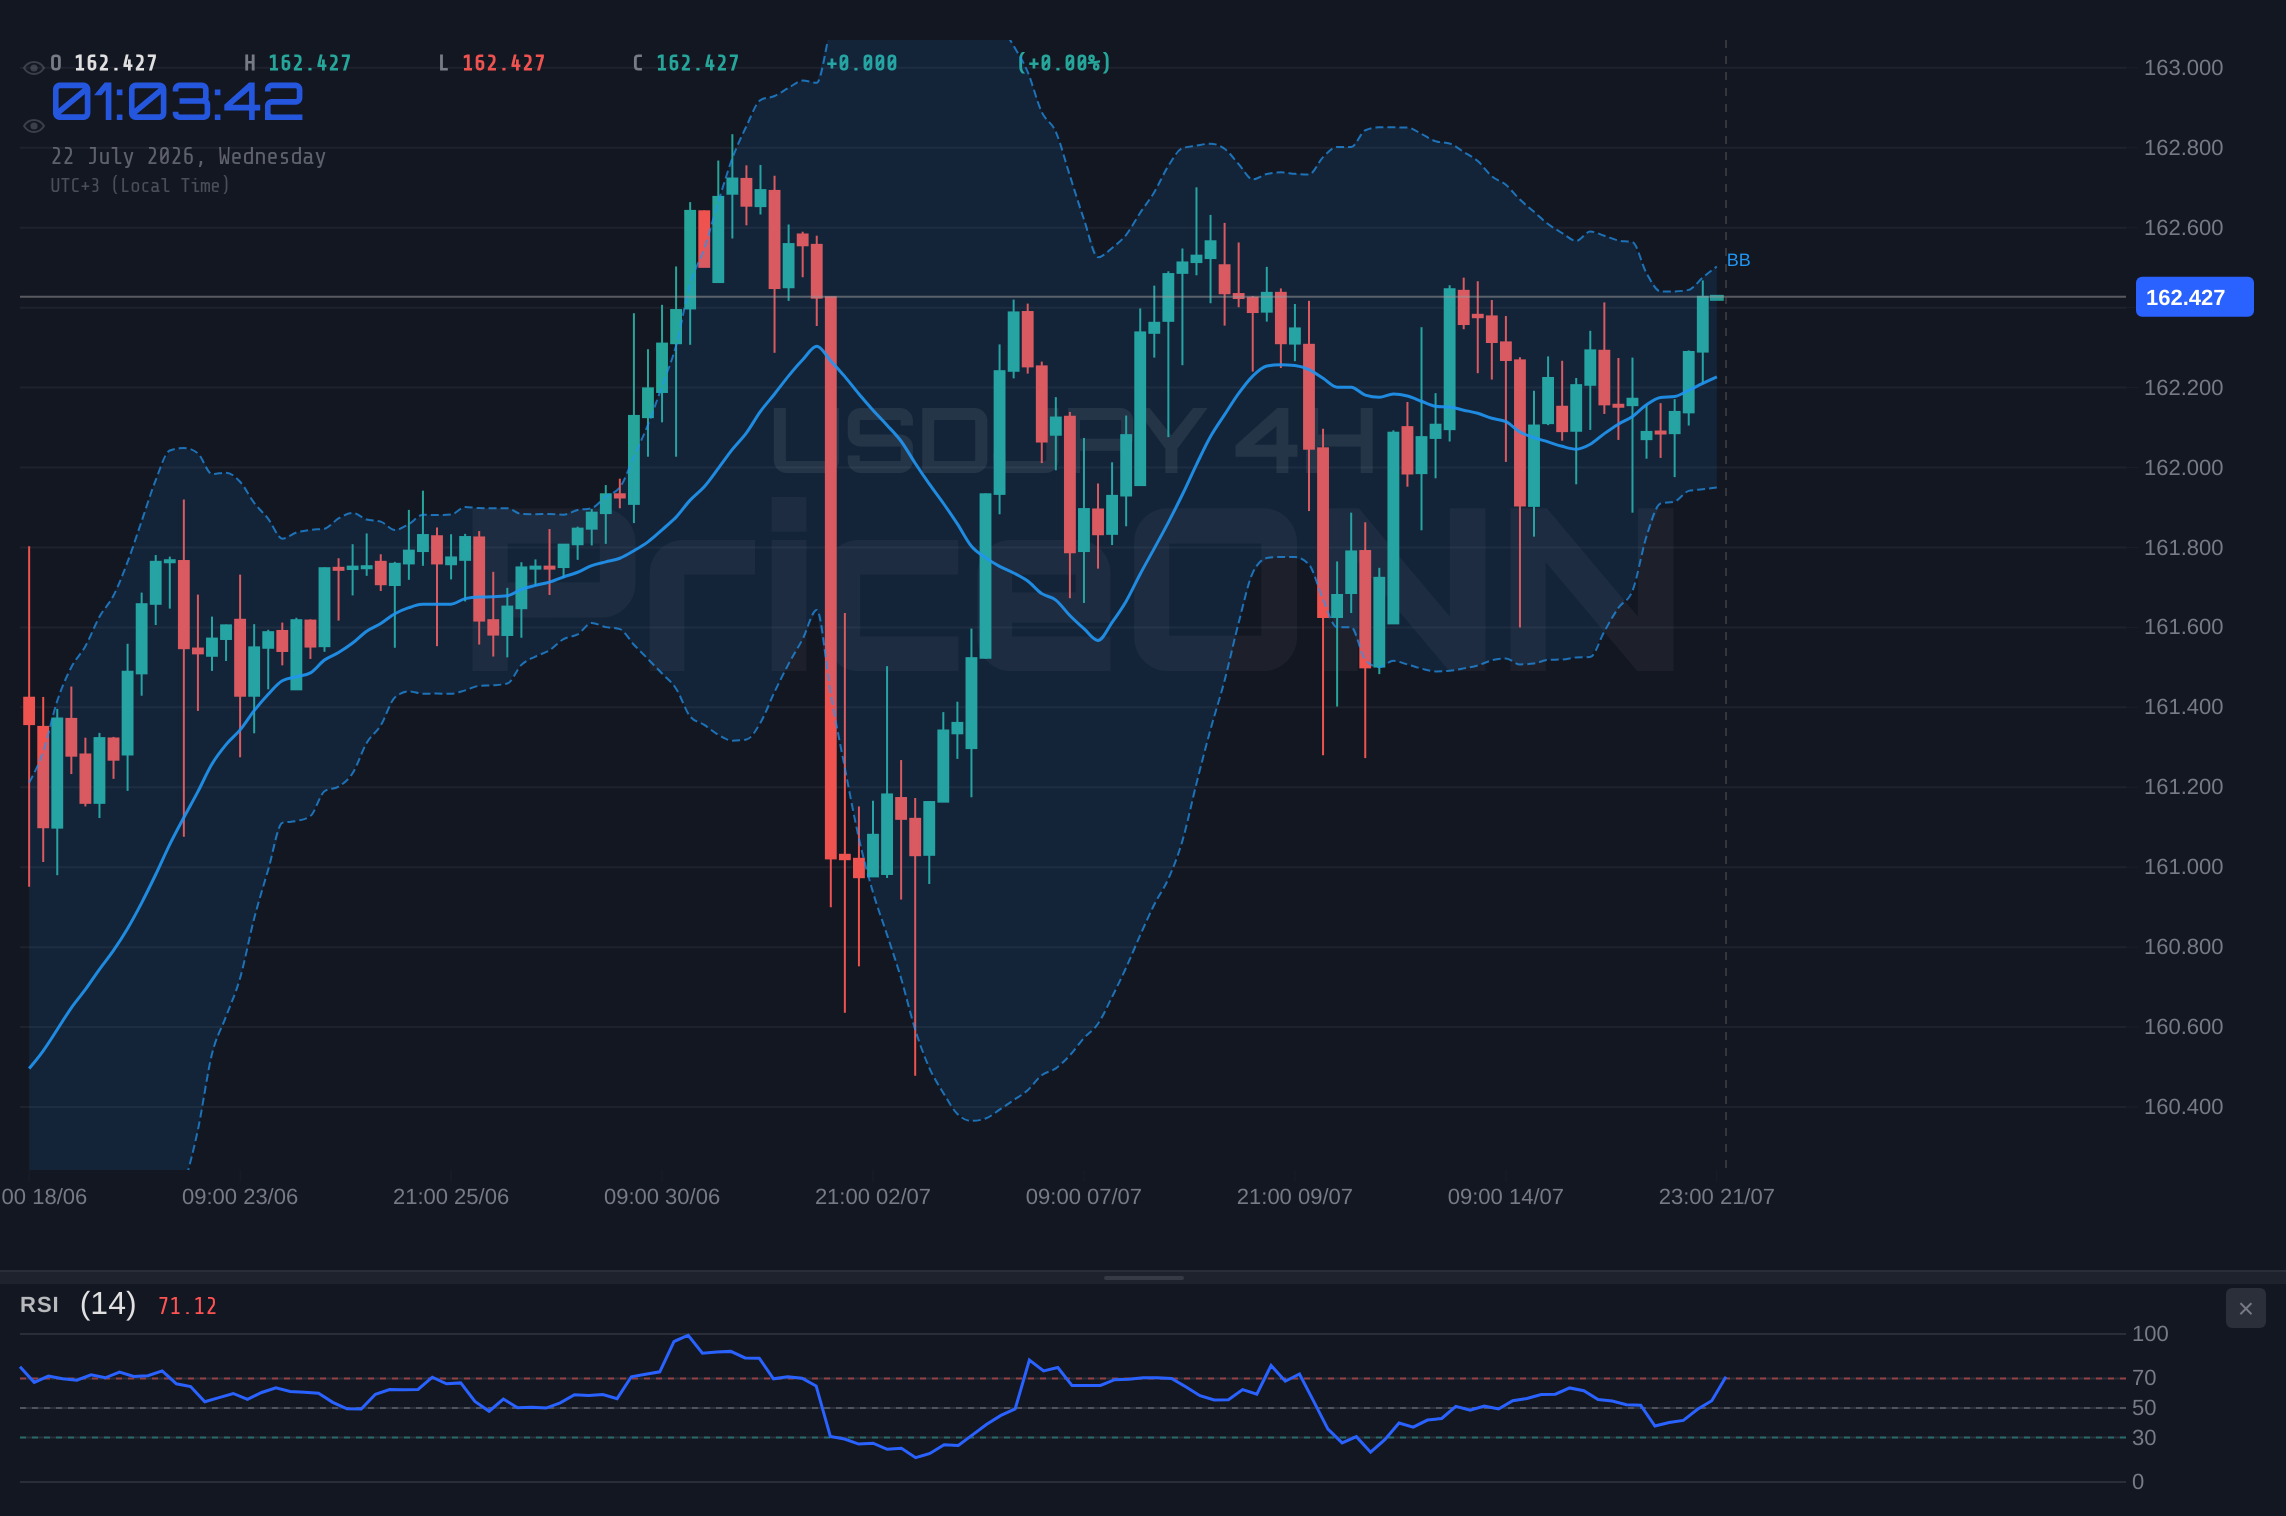
For the bulls to maintain control and push USDJPY higher, a decisive break and hold above the immediate resistance at $162.43 is paramount. This level, acting as a ceiling on the 1-hour chart, needs to be breached with conviction. A clean break above $162.43, ideally accompanied by increased trading volume, would signal a potential continuation towards the next resistance at $162.54. If this level is also overcome, the target shifts to $162.68, a significant hurdle on the 4-hour chart. The daily chart also shows resistance around $162.428, reinforcing the importance of this price zone. For this bullish scenario to play out, we would need to see the RSI remain above 60 and the MACD sustain its positive momentum across multiple timeframes. The Stochastic Oscillator on the daily chart, currently showing a bullish signal with K at 78.93 and D at 75.09, supports this outlook, but it's also nearing overbought territory, meaning upside could be limited without a significant catalyst.
The strength of this bullish move will be heavily influenced by external factors, particularly the US Dollar Index (DXY). With the DXY currently at 100.7, any further strengthening of the dollar could act as a headwind for USDJPY, even if the pair is technically poised for a move higher. Conversely, a weakening dollar, perhaps triggered by dovish signals from the Federal Reserve or a flight to safety into other currencies, could provide the necessary tailwind. The low ADX values across timeframes suggest that the market is not yet strongly committed to a trend, making breakouts more susceptible to volatility and potential fake-outs. Therefore, confirmation is key: a sustained move above $162.43, followed by a successful retest of this level as support, would significantly increase the probability of reaching higher targets.
Where Bears Take Control: The Invalidation Levels
Conversely, a failure to break through the $162.43 resistance could see USDJPY face a sharp correction. The bears are waiting for any sign of weakness to push the price lower. The first line of defense for the bulls, and the initial target for bears, would be the support level at $162.392 on the 1-hour chart. A decisive close below this level would invalidate the immediate bullish setup and could trigger a move towards the next support at $162.367. Further down, the $162.329 support level on the 1-hour chart, and $162.165 on the 4-hour chart, would become targets if the selling pressure intenshes. The daily chart also presents support at $161.902, which could act as a more significant floor if a broader risk-off sentiment emerges.
The conditions that would favor this bearish scenario include a renewed surge in the DXY, perhaps driven by stronger-than-expected US economic data or hawkish commentary from Fed officials. Geopolitical tensions, particularly concerning the Middle East, could also influence currency markets, though the Yen often acts as a safe-haven, which might complicate this dynamic. On the technical side, a bearish divergence on the RSI or MACD, or a Stochastic crossover in the overbought zone on the 1-hour chart, would be an early warning sign. The ADX on the daily chart is 18.76, which is a weak trend reading, suggesting that a move below $162.43 might not immediately develop into a strong downtrend but could lead to a period of consolidation or a sharp, short-lived decline. The key is the price action: a sustained break below $162.392 would be the first signal that the bulls are losing their grip.
The Waiting Game: Consolidation and Uncertainty
It's also entirely plausible that USDJPY will remain range-bound, consolidating its recent gains or losses around the $162.43 level. This scenario often occurs when there's a lack of clear directional catalysts, or when conflicting signals from different timeframes and indicators create indecision. On the 1-hour chart, the ADX of 19.33 and the Stochastic K > D signal suggest a potential for upward movement, but the RSI at 66.56, while not extreme, hints at caution. The 4-hour chart's positive trend strength (95%) is countered by the 1-hour chart's neutral trend strength (50%). This divergence points towards a period of choppiness rather than a clear trend. During such consolidation phases, price action tends to oscillate between defined support and resistance levels without making significant progress in either direction.
In a consolidation scenario, traders might look for short-term opportunities within the range, buying near support and selling near resistance. The immediate support at $162.392 and resistance at $162.43 would define the intraday range. A slightly wider range could be seen between $162.329 and $162.54. This period of indecision could be driven by market participants awaiting key economic data releases, such as upcoming inflation figures or central bank policy statements, which could provide the necessary impetus for a directional move. The absence of strong trends indicated by the ADX on the 1-hour and 4-hour charts supports the possibility of a ranging market. This phase can be frustrating for trend followers but can offer opportunities for range traders if managed carefully.
The Most Probable Path Forward
Considering the technical data across multiple timeframes, the immediate outlook for USDJPY appears cautiously bullish, but with a significant caveat: the resistance at $162.43 is a formidable obstacle. The strong bullish signals on the 4-hour and daily charts, particularly the positive MACD momentum and supportive Stochastic readings on the daily timeframe, suggest underlying strength. However, the 1-hour chart's weaker trend indicators (low ADX) and the proximity to overbought RSI levels temper this optimism. The current price action at $162.43 suggests a pivotal moment. A break above this level, confirmed by a hold on the 4-hour chart, would likely open the door for further upside towards $162.54 and potentially $162.68. This scenario carries a higher probability due to the confluence of daily and 4-hour bullish signals.
The probability of a bullish continuation, assuming a decisive break above $162.43, is estimated at around 60%. This scenario hinges on the DXY remaining stable or weakening, and positive sentiment carrying over from broader market trends. Conversely, the bearish scenario, where price fails to break $162.43 and retreats, is assigned a 30% probability. This would likely be triggered by dollar strength or negative geopolitical news. The neutral, consolidation scenario, where price oscillates around $162.43, is given a 10% probability. While possible, the strong signals from the higher timeframes suggest that a breakout, either upwards or downwards, is more likely than a prolonged period of ranging. The key will be the next 24-48 hours of trading and how the pair reacts to this critical resistance.
USDJPY Bearish Scenario: Retreat from Resistance
30% ProbabilityUSDJPY Neutral Scenario: Choppy Consolidation
10% ProbabilityUSDJPY Bullish Scenario: Breaking the Barrier
60% ProbabilityThe current technical setup on USDJPY presents a classic resistance test scenario. The bullish momentum built across higher timeframes is undeniable, but the immediate price action at $162.43 is the critical juncture. A successful breakout here could signal the start of a significant upward move, potentially challenging higher resistance levels and confirming the bullish bias. However, the market is complex, and external factors like DXY movements and geopolitical news can quickly shift sentiment. Traders must remain vigilant, focusing on price action confirmation and managing risk prudently.
The key to navigating this volatile period lies in observing the price action around the $162.43 level. A decisive close above this resistance on the 4-hour chart, followed by a successful retest of this level as support, would be a strong bullish signal, aligning with the higher probability scenario. Conversely, a rejection from this level, accompanied by a break below $162.392, would pivot the outlook towards the bearish case. The low ADX readings across timeframes suggest that while a move is likely, the strength and sustainability of that move remain uncertain until a clear breakout or breakdown occurs. Patience and discipline will be crucial for traders looking to capitalize on the next move in USDJPY.
What I'm Watching This Week
My focus for USDJPY this week will be on three key elements. Firstly, the price action around the critical resistance level of $162.43. A clear, confirmed break above this level is the primary bullish trigger I'll be looking for. Secondly, I'll be monitoring the US Dollar Index (DXY). With the DXY currently at 100.7, any significant move in the dollar will directly impact USDJPY. A sustained rise in DXY could cap USDJPY's upside, while a fall could fuel further gains. Lastly, I'll be paying close attention to any major economic data releases from the US or Japan that could influence monetary policy expectations. While specific economic calendar events aren't detailed here, any news impacting Fed or BoJ policy will be critical. The confluence of technical resistance and potential macroeconomic shifts makes this a pivotal moment for USDJPY.
📊 Indicator Dashboard
| Indicator | Value | Signal | Interpretation |
|---|---|---|---|
| RSI (14) | 66.56 | Neutral | Approaching overbought, watch for divergence or confirmation |
| MACD Histogram | +0.257 | Bullish | Positive momentum building |
| Stochastic %K | 78.93 | Bullish | In upper zone, nearing overbought |
| Stochastic %D | 75.09 | Bullish | Supporting K, nearing overbought |
| ADX | 18.76 | Weak Trend | Current move lacks strong trend conviction |
| Bollinger Band | Middle Band | Bullish | Price holding above middle band |
Frequently Asked Questions: USDJPY Analysis
What happens if USDJPY breaks above the $162.43 resistance level?
A decisive break above $162.43, confirmed by a hold on the 4-hour chart, would likely trigger further upside towards $162.54 and potentially $162.68. This scenario carries a higher probability due to strong daily and 4-hour bullish signals.
Should I buy USDJPY at current levels near $162.43 given the mixed signals?
Buying at current levels carries risk due to the strong resistance at $162.43. A confirmed breakout above this level, with a retest as support, would offer a higher-probability entry. Otherwise, waiting for a pullback to support levels like $162.392 might offer a better risk/reward.
Is the RSI at 66.56 a sell signal for USDJPY right now?
An RSI of 66.56 is approaching overbought territory but is not an immediate sell signal on its own. It indicates building upward momentum that warrants caution near resistance. Confirmation from price action or other indicators would be needed for a bearish signal.
How will the DXY at 100.7 affect USDJPY trading this week?
A stronger DXY (currently 100.7) typically puts downward pressure on USDJPY due to the inverse correlation. If the DXY continues to rise, it could cap USDJPY's upside even if technicals suggest a move higher, making the $162.43 resistance even more critical.
Track markets in real-time
AI-powered analysis, technical indicators and real-time price data.
Join Our Telegram Channel
Breaking market news, AI analysis and trading signals instantly.
Join Channel