

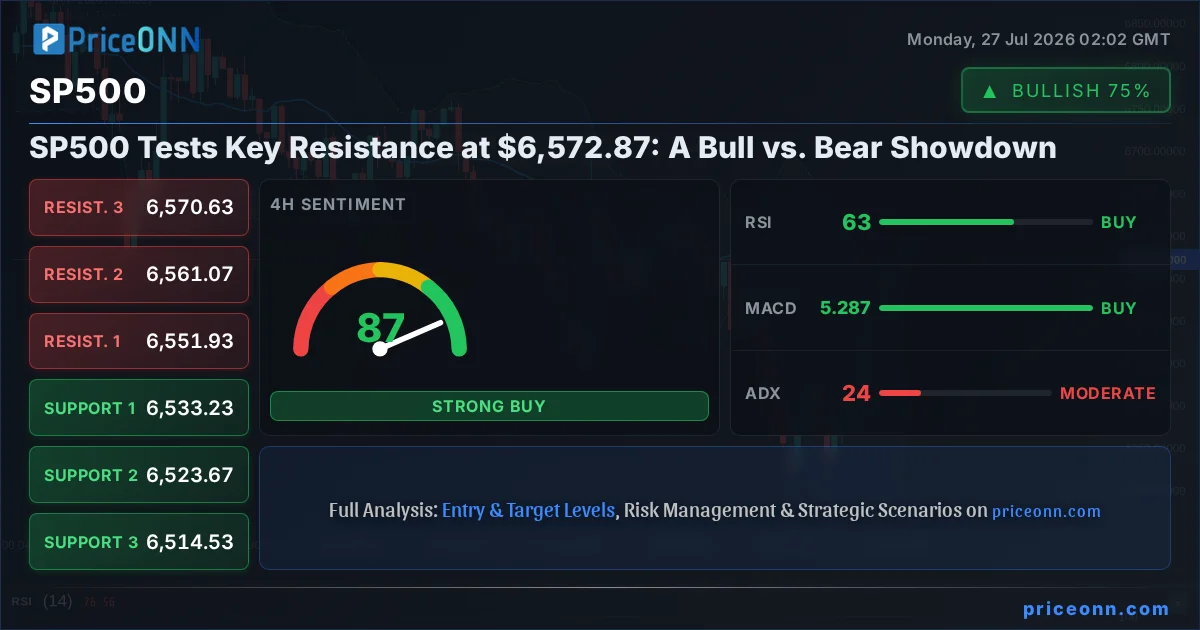
Is the SP500 poised for a breakout or a pullback? The index currently sits at $6,572.87, a pivotal point where bulls and bears are locked in a fierce battle. This level is more than just a number; it represents a critical juncture where market sentiment, economic data, and central bank policy expectations converge, creating a fascinating tug-of-war that every trader needs to understand. The question on everyone's mind is whether the current upward momentum can overcome the significant resistance ahead, or if underlying economic headwinds will force a correction.
- The SP500 is trading at $6,572.87, testing a key resistance zone.
- RSI at 70.95 on the 1H chart signals potential overbought conditions, suggesting caution.
- Critical resistance stands at $6,568.73, with a decisive break needed for continuation.
- DXY strengthening to 100.70 correlates with pressure on risk assets like the SP500.
The narrative surrounding the SP500 is currently a tale of two markets, with compelling arguments on both the bullish and bearish sides. On one hand, strong performance in certain sectors and a general risk-on sentiment have propelled the index upwards. On the other, persistent inflation concerns, the specter of future interest rate hikes, and geopolitical uncertainties cast a long shadow. Understanding this dynamic is crucial for navigating the choppy waters ahead. The current price action around $6,572.87 is a direct reflection of this underlying tension, as market participants digest a complex mix of economic signals and central bank signals.
The Bull Case: Momentum and Macro Support
The bulls are certainly making a strong case for continued upside in the SP500, currently trading at $6,572.87. The index's recent ascent, marked by a daily gain of 0.74% to $6,572.87, demonstrates underlying buying pressure. On the 1-hour chart, the trend is firmly bullish with 100% strength, supported by positive MACD momentum and the price trading above the middle Bollinger Band, indicating upward pressure. The Stochastic Oscillator, while showing some overbought conditions at K=65.73 and D=73.5, is still displaying a slight edge for buyers. Furthermore, the ADX at 49.72 suggests a strong trend is in place, reinforcing the bullish narrative. This technical picture suggests that if the index can consolidate or push higher, there is significant room to run.
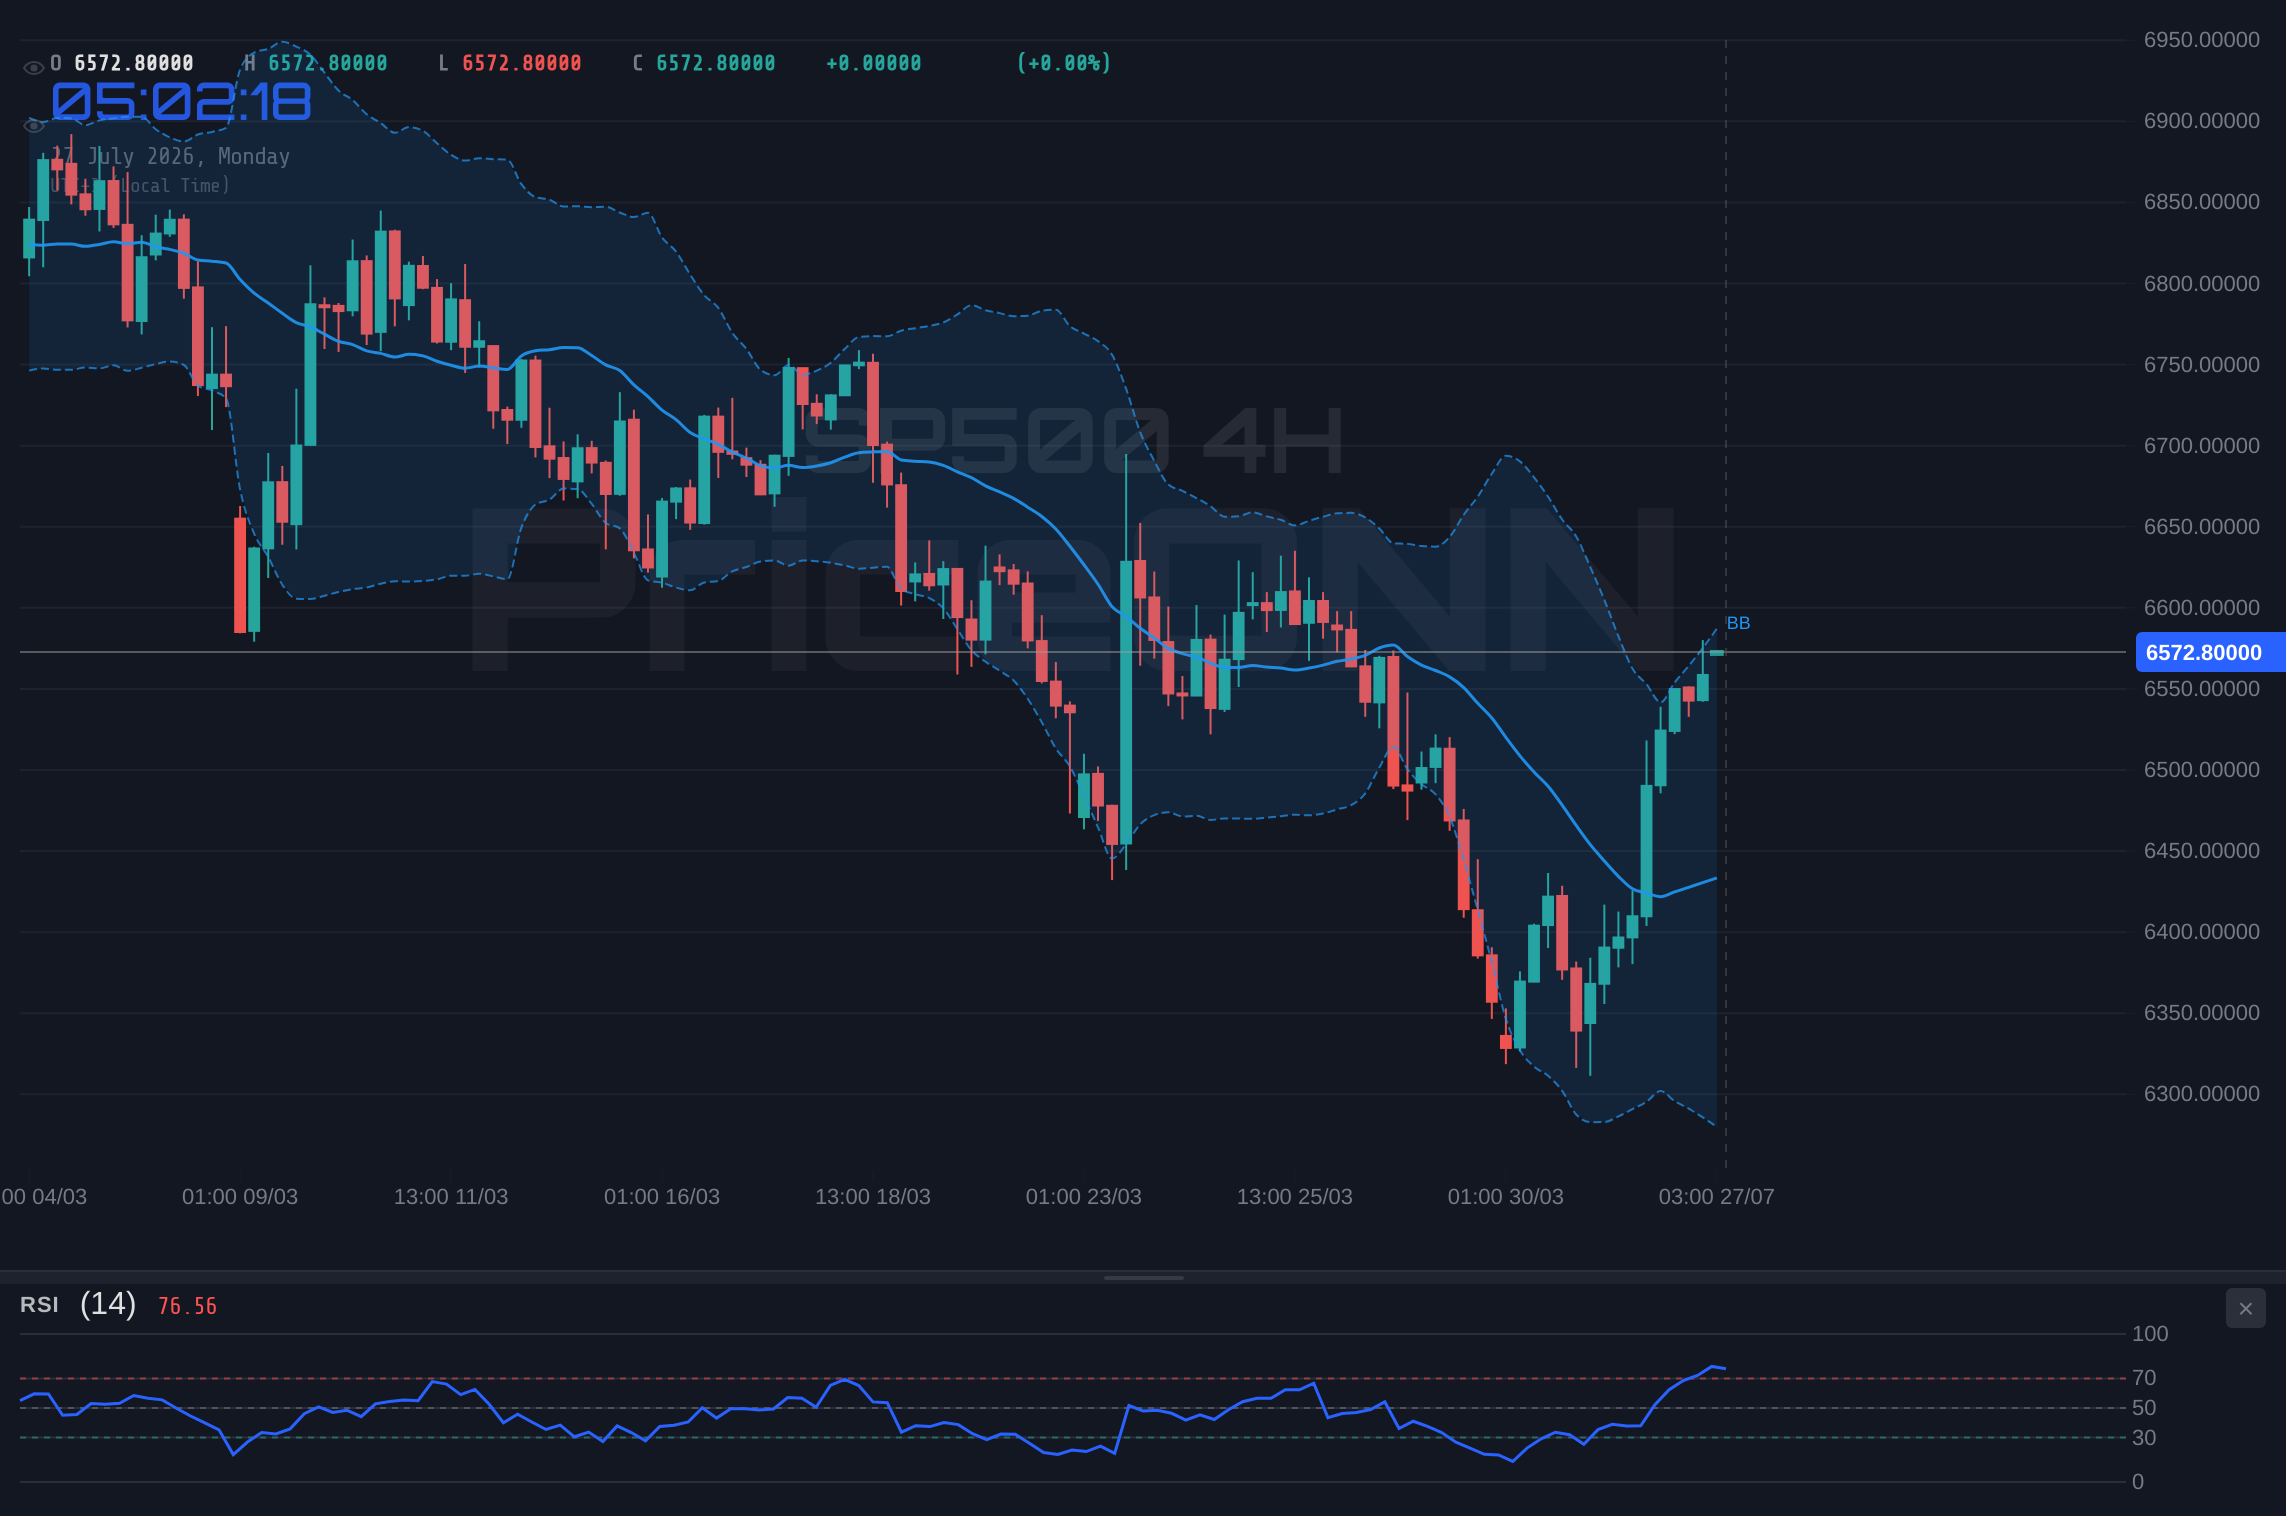
From a fundamental perspective, the bulls are drawing strength from a seemingly resilient economy, albeit with caveats. Recent economic data, while mixed, has not yet presented a clear enough picture to derail the recovery narrative entirely. While inflation remains a concern, the market seems to be pricing in the possibility that central banks might navigate a soft landing. The strength in the Dow Jones Industrial Average, also showing a bullish trend with a strong daily signal, adds to the positive sentiment within the broader equity market. The fact that the SP500 has managed to climb despite a strengthening DXY (currently at 100.70) can be interpreted as a sign of internal strength, suggesting that domestic factors are outweighing dollar strength for now.
The bullish argument also hinges on the idea that market participants are looking past current inflation figures, anticipating that central banks will eventually pivot or at least pause their tightening cycles. The Fed's stance, while data-dependent, is seen by some as nearing its peak hawkishness. If inflation begins to show consistent signs of cooling in upcoming reports, such as the Producer Price Index (PPI) or Consumer Price Index (CPI) in the coming weeks, this could provide a significant tailwind for equities. The current RSI reading on the 4-hour chart, at 62.83, indicates a healthy upward trend without being excessively overbought, supporting the idea that there is still room for growth. The ADX at 24.23 on this timeframe suggests a consolidating uptrend, which could precede a more significant move.
Moreover, the performance of other risk assets plays a crucial role. While oil prices have seen some volatility, the overall energy market isn't signaling an imminent economic collapse. The fact that the SP500 is trading at $6,572.87, pushing towards resistance, suggests that investors are willing to take on risk, betting on continued economic expansion and corporate earnings growth. The strong bullish signals across multiple timeframes for the Dow Jones Industrial Average (DJI30) and the generally positive outlook for cryptocurrencies like Bitcoin (BTCUSD) at $64,629.65, further bolster the argument that a broader risk-on appetite might be in play, favoring equity markets.
The Bear Case: Inflation, Fed, and Technical Weakness
However, the bears have a potent counter-argument, pointing to significant underlying weaknesses and potential triggers for a reversal. The current price of $6,572.87 for the SP500 is teetering on the edge of resistance, specifically at $6,568.73 on the 1-hour chart. The RSI(14) on this timeframe is at 70.95, firmly in overbought territory, which historically often precedes a pullback or consolidation. Coupled with the Stochastic Oscillator showing K=65.73 and D=73.5, suggesting a bearish crossover is imminent or has just occurred, the technical indicators on the shorter timeframe are flashing warning signs. The MACD also shows negative momentum on the 1H chart, indicating that buying pressure might be waning.
On the daily chart, the picture becomes even more concerning for the bulls. The SP500 is currently in a confirmed downtrend with 100% strength, and the RSI(14) at 45.35 suggests there is significant room to fall before reaching oversold territory. The MACD is also negative, reinforcing the bearish sentiment. The ADX at 49.72 on the daily chart indicates a very strong downtrend, suggesting that the recent upward move might just be a temporary bounce within a larger bearish structure. The fact that the index is trading below its middle Bollinger Band on the daily chart further supports the bearish outlook, indicating that the price is under pressure.
The fundamental backdrop provides ample ammunition for the bears. Inflation remains stubbornly high, and the market is increasingly pricing in the possibility that the Federal Reserve might need to maintain its hawkish stance for longer than anticipated, or even implement further rate hikes if inflation doesn't show a clear downward trajectory. Upcoming economic data, such as the CPI and PPI reports, will be critical. Any sign of sticky inflation could trigger a significant sell-off, as investors re-price the risk of prolonged higher interest rates, which typically dampens economic activity and corporate earnings. The strengthening DXY to 100.70 is a classic indicator of risk aversion and tighter financial conditions, which historically correlates with pressure on global equity markets.
Geopolitical tensions also add to the bearish narrative. While specific news items about oil supply or trade relations might seem isolated, they contribute to a general sense of uncertainty that can lead to a flight to safety. The recent news highlighting potential oil supply bottlenecks and geopolitical risks in major energy-producing regions underscores the fragilities in the global economic system. If these tensions escalate, they could lead to renewed inflationary pressures, forcing central banks into a more aggressive tightening cycle, which would be detrimental to equity markets like the SP500. The correlation between rising oil prices, inflation, and potential Fed action cannot be ignored by bears.
The Verdict: A Critical Juncture
The SP500 is at a critical crossroads, trading at $6,572.87. The bullish case is supported by short-term technical momentum and a narrative of economic resilience, while the bearish case is bolstered by longer-term technical weakness, persistent inflation fears, a strengthening dollar, and potential geopolitical risks. The 1-hour RSI at 70.95 and the daily ADX at 49.72 present conflicting signals, highlighting the indecision in the market. The key level to watch is the resistance at $6,568.73. A decisive break above this level, supported by increasing volume and a dip in the RSI, could signal a continuation of the bull trend. However, failure to break this resistance, especially if accompanied by a rise in the DXY and negative inflation surprises, could lead to a sharp reversal.
From a macro perspective, the upcoming economic calendar will be paramount. Any data that suggests inflation is cooling faster than expected could embolden the bulls, while data indicating persistent price pressures would likely fuel the bears. The Federal Reserve's policy stance remains the central theme; any hint of dovishness would be a green light for risk assets, whereas continued hawkish rhetoric would likely lead to further downside pressure. The current technical setup on the daily chart, with its strong downtrend signal and negative MACD, suggests that the path of least resistance might still be downwards, despite the intraday strength.
The interplay between the SP500 and the DXY is particularly important. With the DXY at 100.70 and showing signs of strength on the 1-hour chart, it implies that global investors are favoring the US dollar, often at the expense of riskier assets. This inverse correlation suggests that for the SP500 to make a sustained move higher, either the DXY needs to reverse its trend, or the SP500 needs to demonstrate exceptional strength independent of dollar movements. The current short-term technicals on the SP500 might be misleading, as the longer-term daily indicators point towards caution.
Ultimately, the market is grappling with uncertainty. The bulls are betting on a soft landing and a Fed pivot, while the bears are bracing for sticky inflation and continued monetary tightening. The price action around $6,572.87 is the battleground where these narratives clash. Traders should pay close attention to the reaction at the $6,568.73 resistance level. A failure to break through could signal the start of a significant correction, especially if upcoming economic data disappoints. The strong downtrend indicated by the daily ADX of 49.72 cannot be ignored, suggesting that any rallies might be opportunities for bears to enter the market.
Navigating the Uncertainty: A Trader's Perspective
The current market environment for the SP500, trading at $6,572.87, is characterized by a high degree of uncertainty, making disciplined risk management paramount. While short-term technicals might offer some bullish signals, the longer-term daily indicators, particularly the strong ADX of 49.72 and RSI at 45.35, suggest that the prevailing trend is still downwards. This means that any rallies should be approached with caution. Bulls will need to see a clear and convincing break above the $6,568.73 resistance, ideally with strong volume and positive confirmation from other indicators, to signal a sustained move higher. Until then, the risk of a pullback remains significant.
Bears, on the other hand, will be looking for a decisive failure at the current resistance level, followed by a break below key support levels. The 1-hour RSI at 70.95 is a potential warning sign that the current upward push might be unsustainable. A close below the 1-hour support at $6,547.63 could be the first indication of renewed selling pressure. Confirmation would come from a break below the 4-hour support at $6,533.23. Traders should monitor the correlation with the DXY, which is currently at 100.70 and showing strength, potentially adding headwinds to the SP500. The narrative around inflation and Fed policy will be the primary driver of sentiment in the coming days and weeks.
The conflicting signals across different timeframes and indicators require a patient approach. Scalpers might find short-term opportunities on either side of the current price, but swing and position traders should wait for clearer confirmation. The strength of the daily downtrend indicated by the ADX necessitates a bearish bias on longer timeframes, making any upward moves suspect unless they are decisively confirmed by a shift in fundamental drivers or a strong technical breakout accompanied by robust volume. The market is clearly at a pivotal moment, and the next few trading sessions will likely determine the short-to-medium term direction.
It's essential to remember that market trends can shift rapidly, especially when influenced by major economic data releases or central bank commentary. The current price action at $6,572.87 is a snapshot in time. The real opportunity lies in understanding the underlying forces at play and waiting for high-probability setups. Whether the bulls can overcome the resistance at $6,568.73 or the bears reclaim control below $6,547.63 will depend heavily on the incoming economic data and the Federal Reserve's reaction function. Staying disciplined, managing risk, and waiting for the market to provide clear signals are the keys to navigating this complex environment.
Frequently Asked Questions: SP500 Analysis
What happens if the SP500 breaks above the $6,568.73 resistance level?
A decisive break above $6,568.73, especially with increasing volume and a cooling RSI from its current 70.95, would signal bullish continuation. This could open the door for further upside towards the $6,577.27 resistance level, potentially attracting more buyers and reinforcing the bullish narrative.
Should I consider selling the SP500 at current levels around $6,572.87 given the RSI at 70.95?
With the 1-hour RSI at 70.95, short-term overbought conditions are present, suggesting caution. While it doesn't automatically signal a sell, it indicates that the upward momentum might be waning. Bears might look for confirmation below the $6,547.63 support level before initiating short positions.
Is the MACD negative momentum on the 1H chart a strong sell signal for the SP500?
The negative MACD momentum on the 1-hour chart does indicate waning buying pressure, supporting a bearish short-term outlook. However, it's not a standalone sell signal. Confirmation would be needed, such as a break below key support levels and a bearish crossover on longer timeframes.
How will upcoming economic data and Fed policy impact the SP500's move above $6,572.87?
Upcoming inflation data and Fed commentary are critical. Cooler inflation could fuel a rally above $6,572.87, while persistently high inflation might lead to a rejection at resistance and a move lower. The market is sensitive to any hints about future interest rate policy.
Track markets in real-time
AI-powered analysis, technical indicators and real-time price data.
Join Our Telegram Channel
Breaking market news, AI analysis and trading signals instantly.
Join Channel