

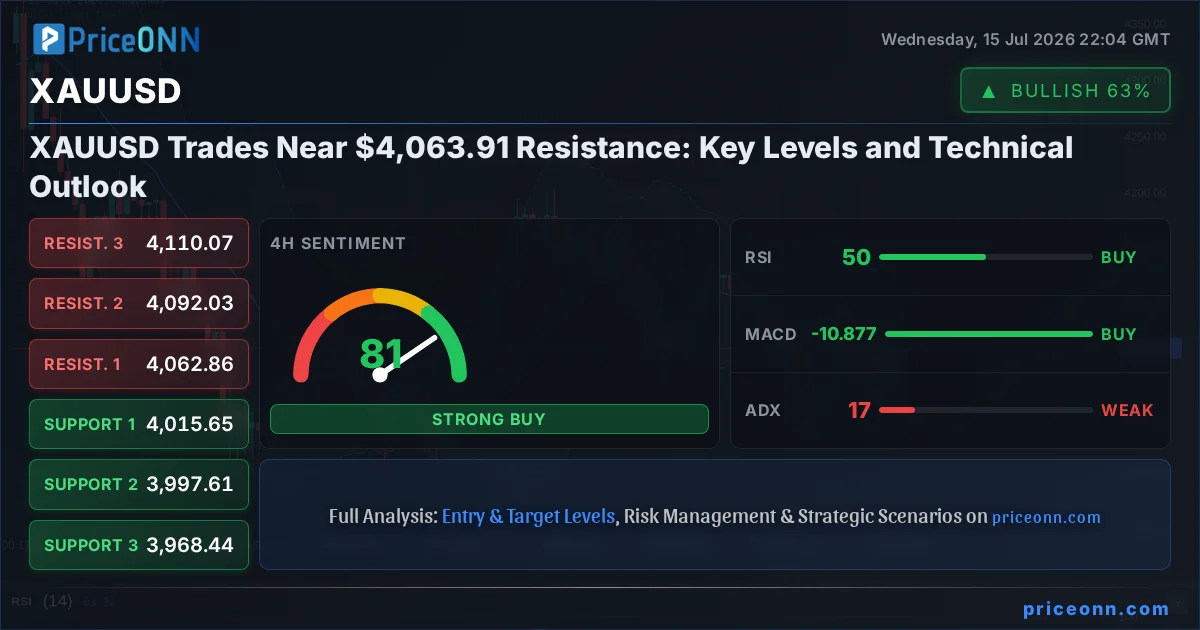
As gold prices consolidate near the significant $4,063.91 mark, traders are keenly observing for signs of a breakout or a reversal. The current technical landscape for XAUUSD presents a complex picture, with conflicting signals across various timeframes and indicators. This analysis delves into the intricate details of XAUUSD's price action, examining the interplay of technical indicators, crucial support and resistance levels, and the broader market context to decipher the most probable path forward. Understanding the nuances of the current market sentiment and the potential impact of upcoming economic events is paramount for navigating this volatile asset.
- RSI at 67.36 indicates a neutral-to-bullish leaning, but caution is advised as it approaches overbought territory.
- Critical resistance is currently found at $4,063.95, a level XAUUSD is testing, while immediate support lies at $4,049.02.
- The ADX reading of 19.47 on the 1-hour chart suggests a weak trend, highlighting potential choppiness and a lack of strong directional commitment.
- Correlation with a strengthening DXY (currently at 100.52) adds a layer of pressure, potentially capping upside for gold.
The price action surrounding gold, or XAUUSD, is currently at a critical juncture, trading around the $4,063.91 level. This specific price point is not just a number; it represents a confluence of technical factors that demand close attention from market participants. On the 1-hour chart, XAUUSD is showing a slight upward bias, with the trend strength pegged at a robust 85%. However, this bullish momentum is met with resistance just above the current price, specifically at $4,063.95. This proximity to resistance, coupled with a somewhat neutral RSI of 57.53, suggests that while buyers are present, they are facing headwinds. The MACD indicator on the 1-hour timeframe shows positive momentum, with the MACD line above its signal line, reinforcing the short-term bullish inclination. Stochastic oscillators also lean bullish, with the %K line at 61.13 crossing above the %D line at 58.77, indicating a potential continuation of the upward move. Yet, the ADX, a measure of trend strength, stands at a mere 19.47. This low reading points to a weak trend, implying that the current upward push might lack conviction and could be susceptible to sharp reversals or sideways consolidation. The 'General Signal' on this timeframe is 'BUY', with 7 out of 8 indicators suggesting a purchase. This, however, must be viewed with caution given the weak ADX reading and the proximity to resistance.
Shifting our focus to the 4-hour timeframe, the picture for XAUUSD becomes more neutral, with the trend strength at a balanced 50%. The current price of $4,063.91 is finding itself just below the immediate 4-hour resistance at $4,062.86. This level is crucial; a sustained break above it could signal further upside, while failure to do so might lead to a retest of the support levels, the nearest being $4,015.65. The RSI on this timeframe sits at 50.5, precisely at the midpoint, reflecting indecision in the market. Neither buyers nor sellers have a clear upper hand. The MACD continues to show positive momentum, but the Stochastic oscillators are painting a different story, with the %K line at 50.17 dipping below the %D line at 52.03, suggesting a potential bearish signal or a cooling of upward momentum. The ADX here is even weaker, at 16.86, further emphasizing the lack of a defined trend and the sideways, choppy nature of the market on this intermediate timeframe. The 'General Signal' on the 4-hour chart is also 'BUY', but with a less convincing conviction (5 buys, 3 sells). This divergence between the 1-hour and 4-hour signals underscores the choppiness and the need for traders to exercise caution.
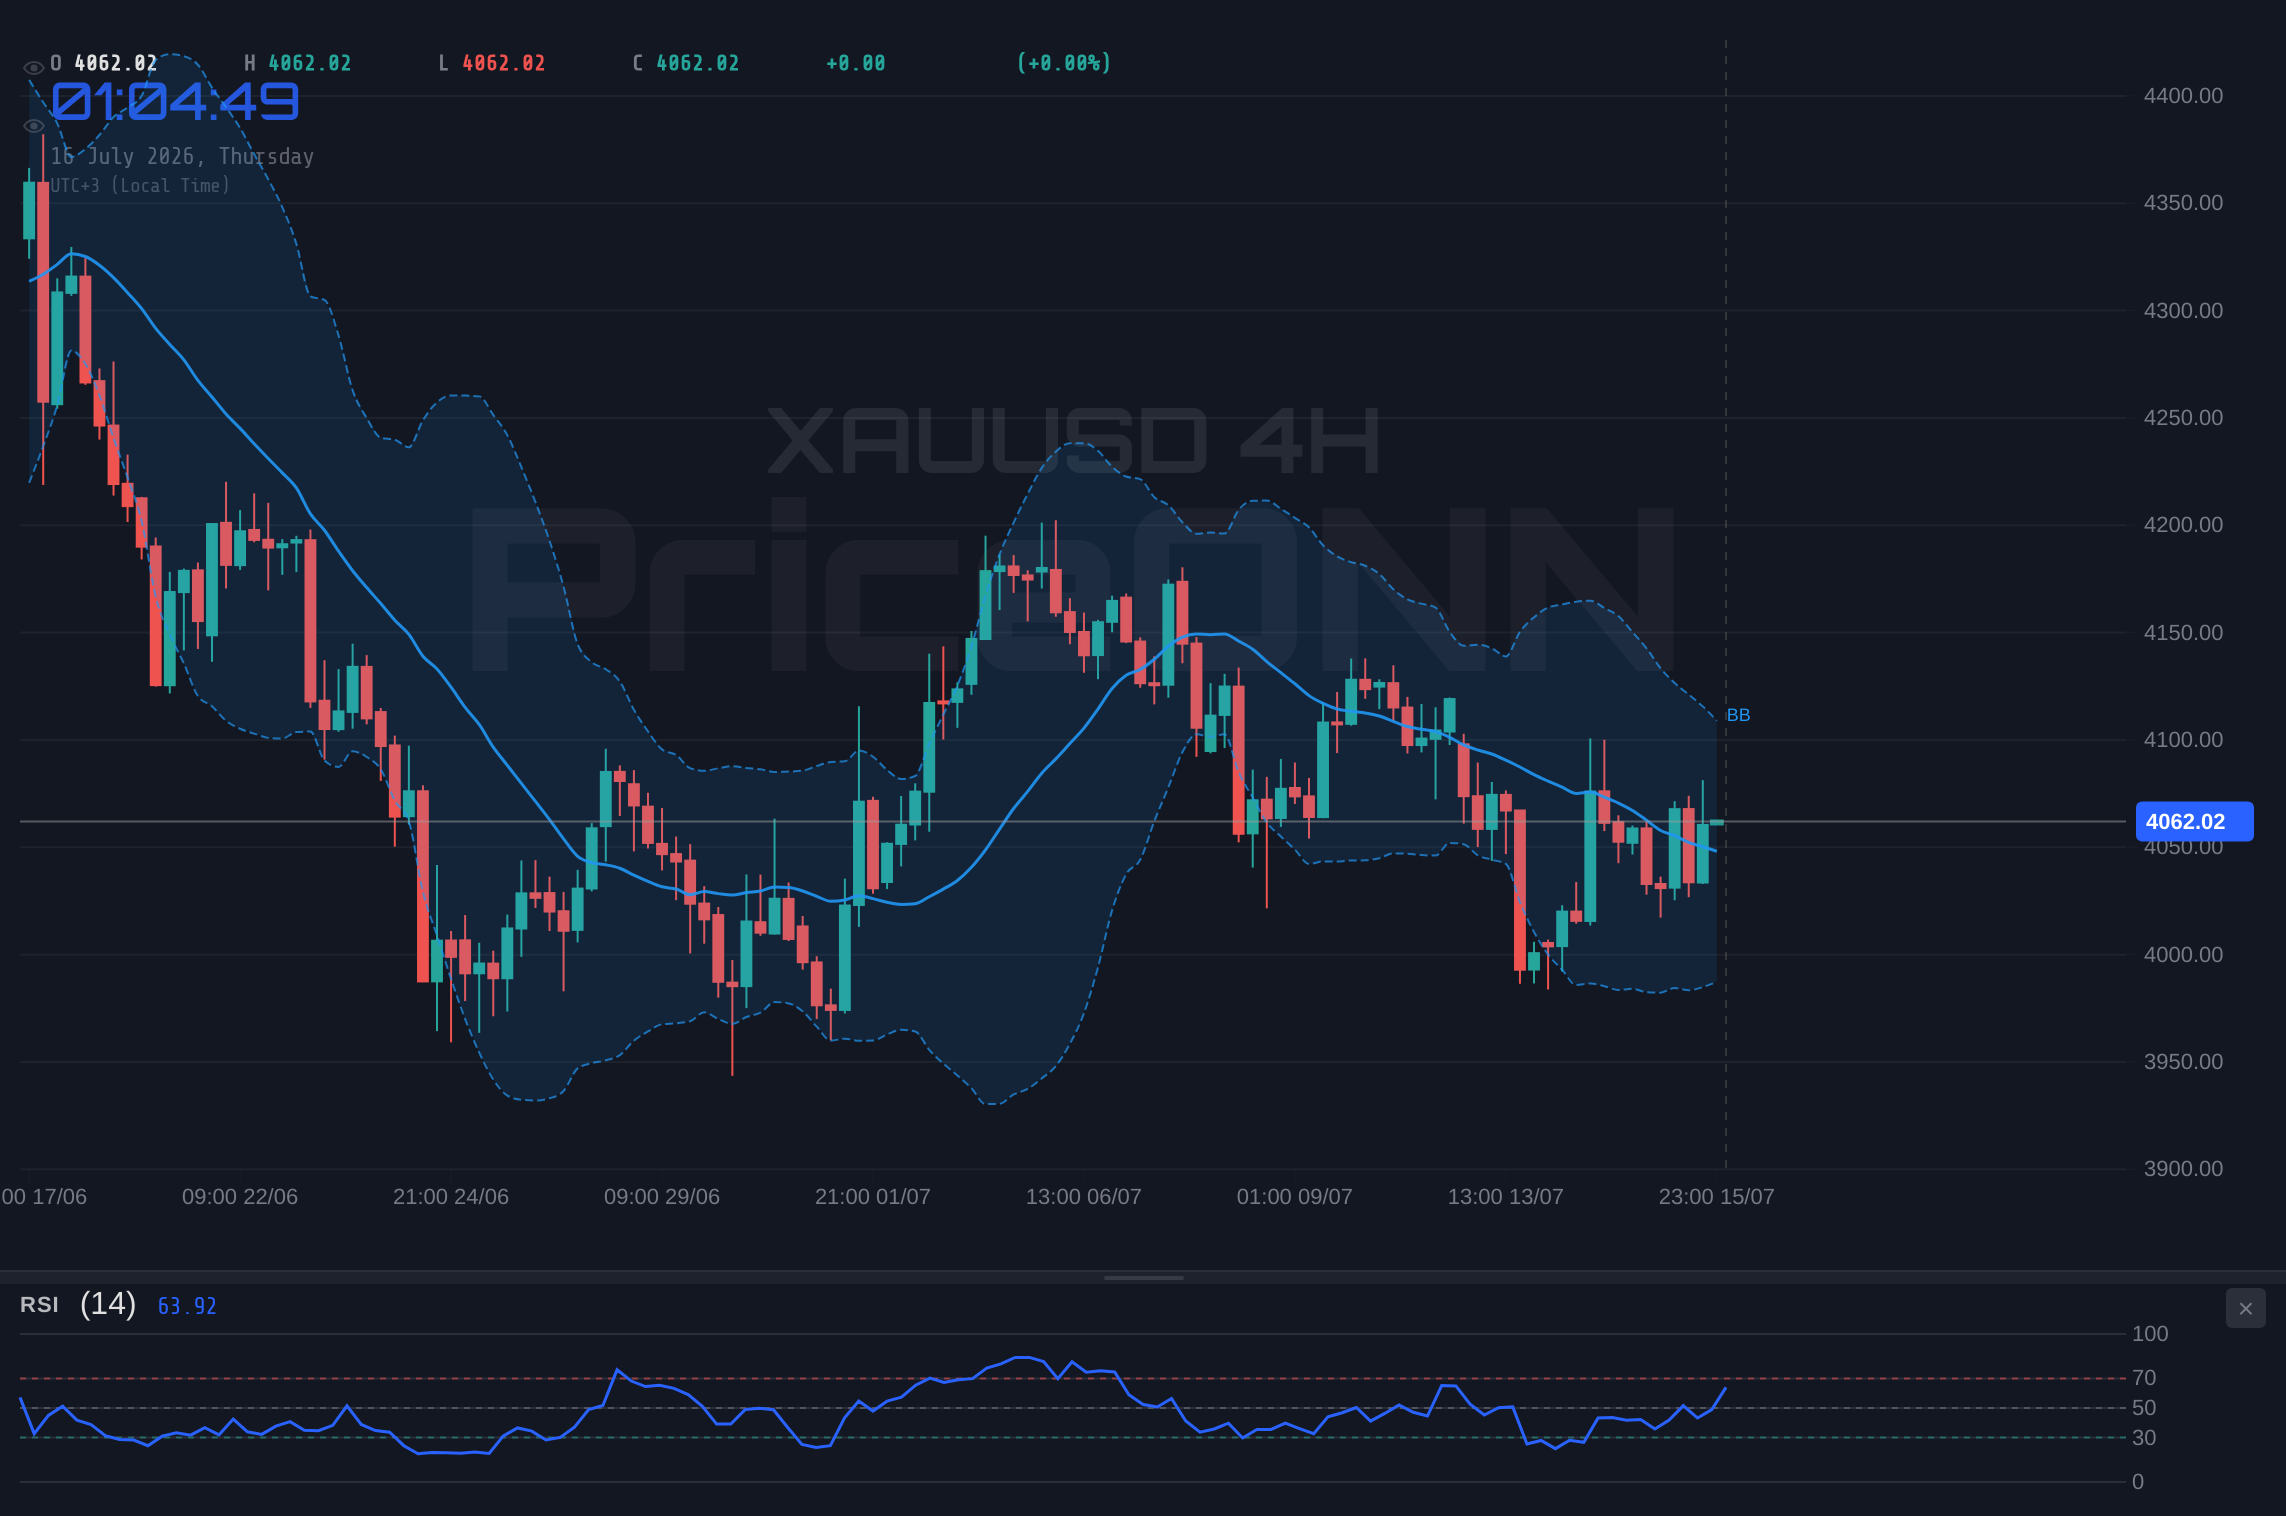
The daily chart for XAUUSD, however, paints a decidedly bearish picture, with a strong trend strength of 89% indicating a prevailing downward bias. The current price of $4,063.91 is well below the key daily resistance level of $4,107.61. This level has acted as a significant ceiling, and its failure to break suggests that the bears are still in control on the longer timeframe. The daily RSI is at 42.67, firmly in the neutral zone but trending downwards, indicating weakening buying pressure. The MACD, despite showing positive momentum on the 1-hour and 4-hour charts, is still above its signal line on the daily chart, but the histogram suggests that this positive momentum might be waning. Bollinger Bands are positioned below the middle band, which is a bearish signal on the daily timeframe, reinforcing the downward pressure. The Stochastic oscillator on the daily chart is bearish, with %K at 28.31 below %D at 51.55, signaling oversold conditions that could precede a bounce, but within the context of a strong downtrend. The ADX on the daily chart is at 38.49, confirming a strong bearish trend. The 'General Signal' for the daily timeframe is a clear 'SELL', with only 1 buy signal against 7 sell signals. This longer-term bearish outlook directly contradicts the short-term bullish signals, creating a significant divergence that traders must navigate carefully.
Given these conflicting signals across different timeframes, the current market condition for XAUUSD can be described as a 'WATCH_ZONE'. The ADX readings across the board (19.47, 16.86, 38.49) highlight a market that is either trending weakly or is in a strong trend on the daily chart but showing signs of consolidation on shorter timeframes. The 1-hour and 4-hour charts suggest potential for an upward move, perhaps a retest of higher resistance levels, driven by positive momentum indicators like MACD and Stochastic. However, the daily chart's bearish trend and the proximity of XAUUSD to the $4,063.95 resistance level on the 1-hour chart introduce significant risk. A valid trading setup would require a clearer confirmation of direction. For instance, a decisive break and sustainment above the $4,070.88 resistance on the 1-hour chart, confirmed by increasing volume and positive RSI divergence, could open the door for a move towards higher targets. Conversely, a break below the $4,049.02 support on the 1-hour chart, especially if accompanied by a surge in selling volume and a bearish cross on the MACD, would signal a continuation of the daily downtrend.
The DXY, or Dollar Index, currently trading at 100.52 and showing a slight downtrend on the 1-hour chart (ADX 30.89), plays a crucial role in the gold market. Historically, a strengthening dollar often exerts downward pressure on gold prices, as they are inversely correlated. The current DXY price of 100.52, while showing a slight dip, remains in a territory that can still support a stronger dollar, indirectly capping gold's upside potential. If the DXY were to break below its immediate support levels, it could provide a tailwind for XAUUSD, potentially helping it overcome the current resistance. However, the market sentiment regarding future Federal Reserve policy remains a key driver. Any hints of a less hawkish stance from the Fed could weaken the dollar and boost gold, while a continued focus on inflation control could strengthen the dollar and weigh on gold.
Analyzing the broader market context, major equity indices like the S&P 500 and Nasdaq 100 are also showing mixed signals. The S&P 500 is currently trading at 6572.87 with a 0.74% daily gain, indicating a risk-on sentiment in the short term. However, its daily chart shows a strong bearish trend with an ADX of 47.51, suggesting that this current rally might be a bear market bounce rather than a sustained recovery. The Nasdaq 100, trading at 29524.62, is showing a similar pattern, with a bearish trend on the daily chart despite short-term gains. This risk-off sentiment in equities, if it intensifies, could indirectly support gold as a safe-haven asset, but the immediate correlation with the dollar remains a stronger force. The current price action in gold, therefore, is occurring within a complex macro environment where risk appetite is fragile, and currency movements are heavily influenced by central bank expectations.
The recent news flow also adds layers to the XAUUSD narrative. Reports of oil prices climbing for the fourth consecutive day due to escalating tensions in the Middle East, as reported by sources like Reuters, could fuel inflation concerns. Higher oil prices have historically been a precursor to increased inflation, which often drives demand for gold as an inflation hedge. However, the impact of this is currently being counteracted by the dollar's strength and mixed equity market signals. Silver, XAGUSD, is also showing weakness, trading at $57.87 with a 1.35% daily drop, and facing risks of falling to $50 according to some analyses, which could suggest broader weakness in precious metals or specific market dynamics affecting silver. The conflicting signals from XAUUSD and XAGUSD, with gold showing a potential for upside while silver appears to be under pressure, warrants careful observation of which metal's trend will prevail.
Considering the technical indicators, the Stochastic oscillator on the 1-hour chart (K=61.13, D=58.77) suggests a bullish crossover, while on the 4-hour chart (K=50.17, D=52.03), it indicates a bearish crossover. This is a classic example of conflicting signals that traders must reconcile. Similarly, the RSI values across timeframes (57.53, 50.5, 42.67) show a transition from a neutral-to-bullish leaning on shorter frames to a bearish inclination on the daily. The ADX values, particularly the low readings on the 1-hour and 4-hour charts, strongly suggest that the market is lacking a clear directional conviction. This means that any move higher might be met with quick profit-taking, and any dip could be seen as a buying opportunity by short-term traders, leading to a range-bound environment until a more significant catalyst emerges. The overall 'General Signal' across all timeframes is mixed, leaning towards BUY on shorter timeframes but firmly SELL on the daily. This ambiguity is the hallmark of a market in flux.
For traders looking to capitalize on XAUUSD's current position, patience and a clear strategy are essential. The $4,063.95 resistance level on the 1-hour chart is the immediate hurdle. A successful and sustained break above this level, ideally with increasing volume and confirmation from other indicators like a bullish MACD crossover on the daily or a rising RSI above 60, could signal the start of a more significant upward move. The target for such a move could be the next resistance at $4,070.88, and potentially higher towards $4,078.88. However, the prevailing daily downtrend and the weak ADX readings suggest that such a breakout might be short-lived or face immediate selling pressure. The risk of a false breakout is high in such conditions.
Conversely, a failure to break the $4,063.95 resistance, leading to a close below the $4,049.02 support on the 1-hour chart, would likely confirm the bearish bias seen on the daily timeframe. This could lead to a retest of the more significant daily support levels, starting with $3,990.67. The strong bearish trend indicated by the daily ADX of 38.49 suggests that if the price breaks below the near-term supports, the downside could be substantial. Traders should closely monitor the interplay between the dollar index and any shifts in risk sentiment, as these macro factors will likely dictate the direction once a clear trend emerges.
The neutral scenario, where XAUUSD continues to trade within its current range, is also highly probable given the conflicting signals and weak trend strength on shorter timeframes. This would involve price oscillating between the immediate resistance around $4,063.95 and the support at $4,049.02 on the 1-hour chart, or potentially widening its range between the 4-hour support at $4,015.65 and resistance at $4,062.86. In such a scenario, scalpers and range traders might find opportunities, but swing traders would likely wait for a clearer directional signal. The key here would be to identify the boundaries of this consolidation and trade accordingly, always with tight risk management, as a sudden breakout could occur.
Looking ahead, key economic data releases, particularly inflation figures and central bank commentary, will be crucial in shaping the market's direction. If inflation data continues to show signs of cooling, it could reduce the pressure on central banks to maintain aggressive monetary policies, potentially weakening the dollar and supporting gold. Conversely, any indication that inflation remains sticky could lead to a stronger dollar and renewed pressure on gold prices. The geopolitical landscape, especially concerning oil supply and demand, also remains a significant wildcard that could inject volatility into the precious metals market.
XAUUSD is currently trapped in a technical tug-of-war. Shorter timeframes suggest a cautious optimism, but the longer-term daily trend and the proximity to resistance cast a shadow of doubt. The low ADX readings across multiple charts indicate a market that is waiting for a catalyst. Traders should remain vigilant, focusing on the key levels of $4,063.95 resistance and $4,049.02 support on the 1-hour chart, and $4,015.65 on the 4-hour chart. A decisive move beyond these levels, supported by confirming indicators and macro drivers, will provide the clarity needed for a profitable trade. Until then, patience and disciplined risk management are the best allies for any trader in this choppy market environment.
Bearish Scenario: Daily Trend Reasserts Control
65% ProbabilityNeutral Scenario: Range-Bound Consolidation
25% ProbabilityBullish Scenario: Breakout Above Resistance
10% Probability| Indicator | Value | Signal | Interpretation |
|---|---|---|---|
| RSI (14) | 67.36 | Neutral | Approaching overbought, caution advised. |
| MACD Histogram | +0.08 | Bullish | Positive momentum building. |
| Stochastic %K | 61.13 | Bullish | Bullish crossover forming. |
| ADX | 19.47 | Weak Trend | Lack of directional conviction. |
| Bollinger Bands | Middle Band | Bullish | Price above middle band. |
Frequently Asked Questions: XAUUSD Analysis
What happens if XAUUSD breaks decisively above the $4,070.88 resistance level?
A sustained break above $4,070.88, confirmed by increased volume and positive daily chart signals, would invalidate the short-term bearish outlook. This could open the door for a rally towards the $4,078.88 resistance, and potentially challenge the daily resistance at $4,107.61.
Should I consider buying XAUUSD at current levels around $4,063.91 given the mixed signals?
Buying at current levels carries significant risk due to the proximity to resistance and conflicting signals across timeframes. A more prudent approach would be to wait for confirmation: either a clear break above $4,070.88 or a decisive break below $4,049.02 support, coupled with favorable indicator alignment.
Is the RSI reading of 67.36 a sell signal for XAUUSD right now?
An RSI of 67.36 on the 1-hour chart is in the neutral-to-bullish zone, not yet considered a definitive sell signal. However, it indicates that the upward momentum is maturing. A move into the high 70s would warrant greater caution, especially if it coincides with bearish divergence or a failure to break key resistance levels.
How will the current DXY level of 100.52 affect XAUUSD's price action this week?
The DXY at 100.52, while slightly down, remains at a level that can exert pressure on gold. A sustained decline in the DXY below 100.00 could provide a bullish tailwind for XAUUSD, potentially aiding a breakout above resistance. Conversely, any strengthening of the dollar could cap gold's upside, reinforcing the bearish daily trend.
Track markets in real-time
AI-powered analysis, technical indicators and real-time price data.
Join Our Telegram Channel
Breaking market news, AI analysis and trading signals instantly.
Join Channel