

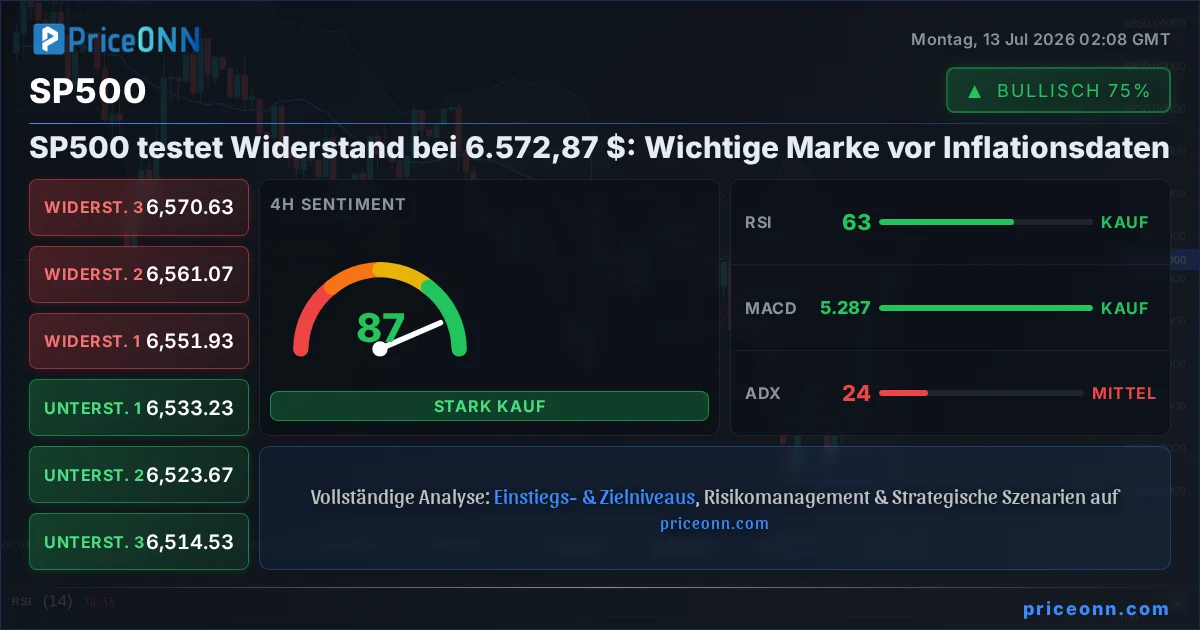
Inmitten eines komplexen Geflechts globaler Wirtschaftsindikatoren und sich wandelnder geopolitischer Strömungen befindet sich der S&P 500 (SP500) an einem kritischen Punkt und wird derzeit bei 6.572,87 $ gehandelt. Dieser entscheidende Moment kommt gerade rechtzeitig vor der Veröffentlichung wichtiger Inflationsdaten, eine Entwicklung, die die Politik der Zentralbanken und damit die Bewertung von Risikoanlagen maßgeblich beeinflussen könnte. Das Zusammenspiel von steigenden Renditen von Staatsanleihen, einem stärker werdenden US-Dollar-Index (DXY) und dem allgegenwärtigen Gespenst geopolitischer Instabilität schafft ein herausforderndes Umfeld für die Aktienmärkte. Diese Analyse befasst sich mit den komplexen Korrelationen und technischen Signalen, die die unmittelbare Zukunft des SP500 prägen, und konzentriert sich auf die entscheidende Widerstandszone bei 6.605,07 $.
- Der SP500 wird derzeit bei 6.572,87 $ gehandelt, mit einem signifikanten Widerstand im oberen Bereich bei 6.605,07 $.
- Der RSI liegt auf dem 1-Stunden-Chart bei 67,35, was auf eine wachsende Dynamik hindeutet, aber noch unterhalb des überkauften Bereichs liegt, was Potenzial für weitere Aufwärtsbewegungen vor Verkaufsdruck signalisiert.
- Der DXY stärkt sich und notiert derzeit bei 101,16, was typischerweise Abwärtsdruck auf Risikoanlagen wie den SP500 ausübt.
- Bevorstehende Inflationsdaten sind ein wichtiger Katalysator, der erhebliche Volatilität auslösen könnte und möglicherweise jüngste Markttrends bestätigt oder widerlegt.
- Ein Bruch über 6.605,07 $ könnte 6.685,83 $ anvisieren, während ein Scheitern, 6.547,63 $ zu halten, die Tür für eine Bewegung in Richtung 6.535,07 $ öffnet.
Die globale Wirtschaftslage ist derzeit von einem empfindlichen Gleichgewicht geprägt, und die Märkte warten gespannt auf entscheidende Inflationsdaten, die die Politik der Zentralbanken beeinflussen könnten. Der US-Dollar-Index (DXY), ein Gradmesser für die globale Risikostimmung, hat eine Aufwärtsbewegung gezeigt und notiert derzeit bei 101,16. Dieser stärkere Dollar korreliert oft mit Druck auf Rohstoffe und Schwellenländer und kann auch US-Aktien belasten, indem er dollar-denominierte Vermögenswerte für ausländische Investoren teurer macht. Die aktuelle DXY-Notierung, die auf den 1- und 4-Stunden-Charts eine positive Dynamik zeigt, deutet auf eine zugrunde liegende Stärke hin, die nicht ignoriert werden kann. Während der MACD auf dem Tages-Chart eine negative Dynamik aufweist, scheint der Gesamttrend sich zu konsolidieren, mit Potenzial nach oben, was die Gewinne im SP500 begrenzen könnte.
In diesem Umfeld ist die Performance des SP500 untrennbar mit der breiteren Risikobereitschaft verbunden. Der Nasdaq 100, der derzeit bei 29.557,76 notiert, verzeichnete in der letzten Stunde einen Rückgang von 0,52 %, was auf eine gewisse Abkühlung im Technologiesektor hindeutet, der oft die breitere Marktstimmung anführt. Diese Divergenz oder deren Fehlen zwischen dem SP500 und dem Nasdaq ist entscheidend. Historisch gesehen signalisiert ein Scheitern des Nasdaq oft eine breitere Risikoaversion, die den gesamten Aktienmarkt nach unten ziehen kann. Die Widerstandsfähigkeit des SP500 trotz einiger Schwankungen deutet jedoch darauf hin, dass bestimmte Sektoren besser abschneiden könnten als andere oder dass der Markt gemischte Signale vor dem Inflationsdruck verarbeitet. Der Dow Jones Industrial Average (DJIA), der bei 52.453 gehandelt wird, zeigt ein stabileres Bild mit einem leichten Gewinn, was auf eine mögliche Rotation oder Sektorspezifische Stärke innerhalb des US-Marktes hindeutet.
Der Rohstoffkomplex bietet eine weitere Linse, durch die Marktdynamiken betrachtet werden können. Brent-Rohöl wird derzeit bei 78,94 $ gehandelt und zeigt einen deutlichen Tagesgewinn von 4,01 %. Dieser Anstieg der Ölpreise ist ein zweischneidiges Schwert. Einerseits kann er auf eine robuste globale Nachfrage hindeuten, was positiv für das Wirtschaftswachstum und die Unternehmensgewinne ist. Andererseits können steigende Energiekosten die Inflation anheizen, was die Konsumausgaben direkt beeinflusst und Zentralbanken möglicherweise zwingt, eine restriktive Haltung beizubehalten oder die Zinsen weiter anzuheben. Der ADX auf dem 1-Stunden-Chart für Brent liegt bei moderaten 16,53, was trotz der starken Preisbewegung auf einen schwachen Trend hindeutet und eher auf Volatilität als auf eine nachhaltige gerichtete Bewegung schließen lässt. Dieser inflationäre Druck aus den Energiemärkten ist ein Schlüsselfaktor, den Trader beobachten, da er direkt die Inflationserwartungen beeinflusst, die die bevorstehenden Daten bestätigen oder widerlegen werden.
Gold, das bei 4.072,72 $ gehandelt wird, verzeichnete einen Rückgang von 1,24 %, was die Stärke des DXY und möglicherweise eine geringere Nachfrage nach sicheren Häfen widerspiegelt, da die Marktteilnehmer sich auf die Inflationsnachrichten vorbereiten. Der 1-Stunden-RSI für Gold liegt bei 37,35 und der MACD zeigt eine negative Dynamik, was die kurzfristige bärische Stimmung bestätigt. Diese Bewegung bei Gold, obwohl abwärtsgerichtet, findet im breiteren Kontext potenzieller Unsicherheit statt. Sollte sich die Inflation als hartnäckiger als erwartet erweisen, könnte Gold wieder an Stärke gewinnen als Absicherung. Umgekehrt könnte die Attraktivität von Gold als Inflationsschutz nachlassen, insbesondere wenn die Realzinsen steigen. Die aktuelle Schwäche bei Gold, gepaart mit der Stärke des DXY, zeichnet ein Bild vorsichtiger Risikobereitschaft, bei dem Investoren kurzfristig den Dollar gegenüber traditionellen sicheren Häfen wie Gold bevorzugen.
Widerstand navigieren: Das technische Schlachtfeld des SP500
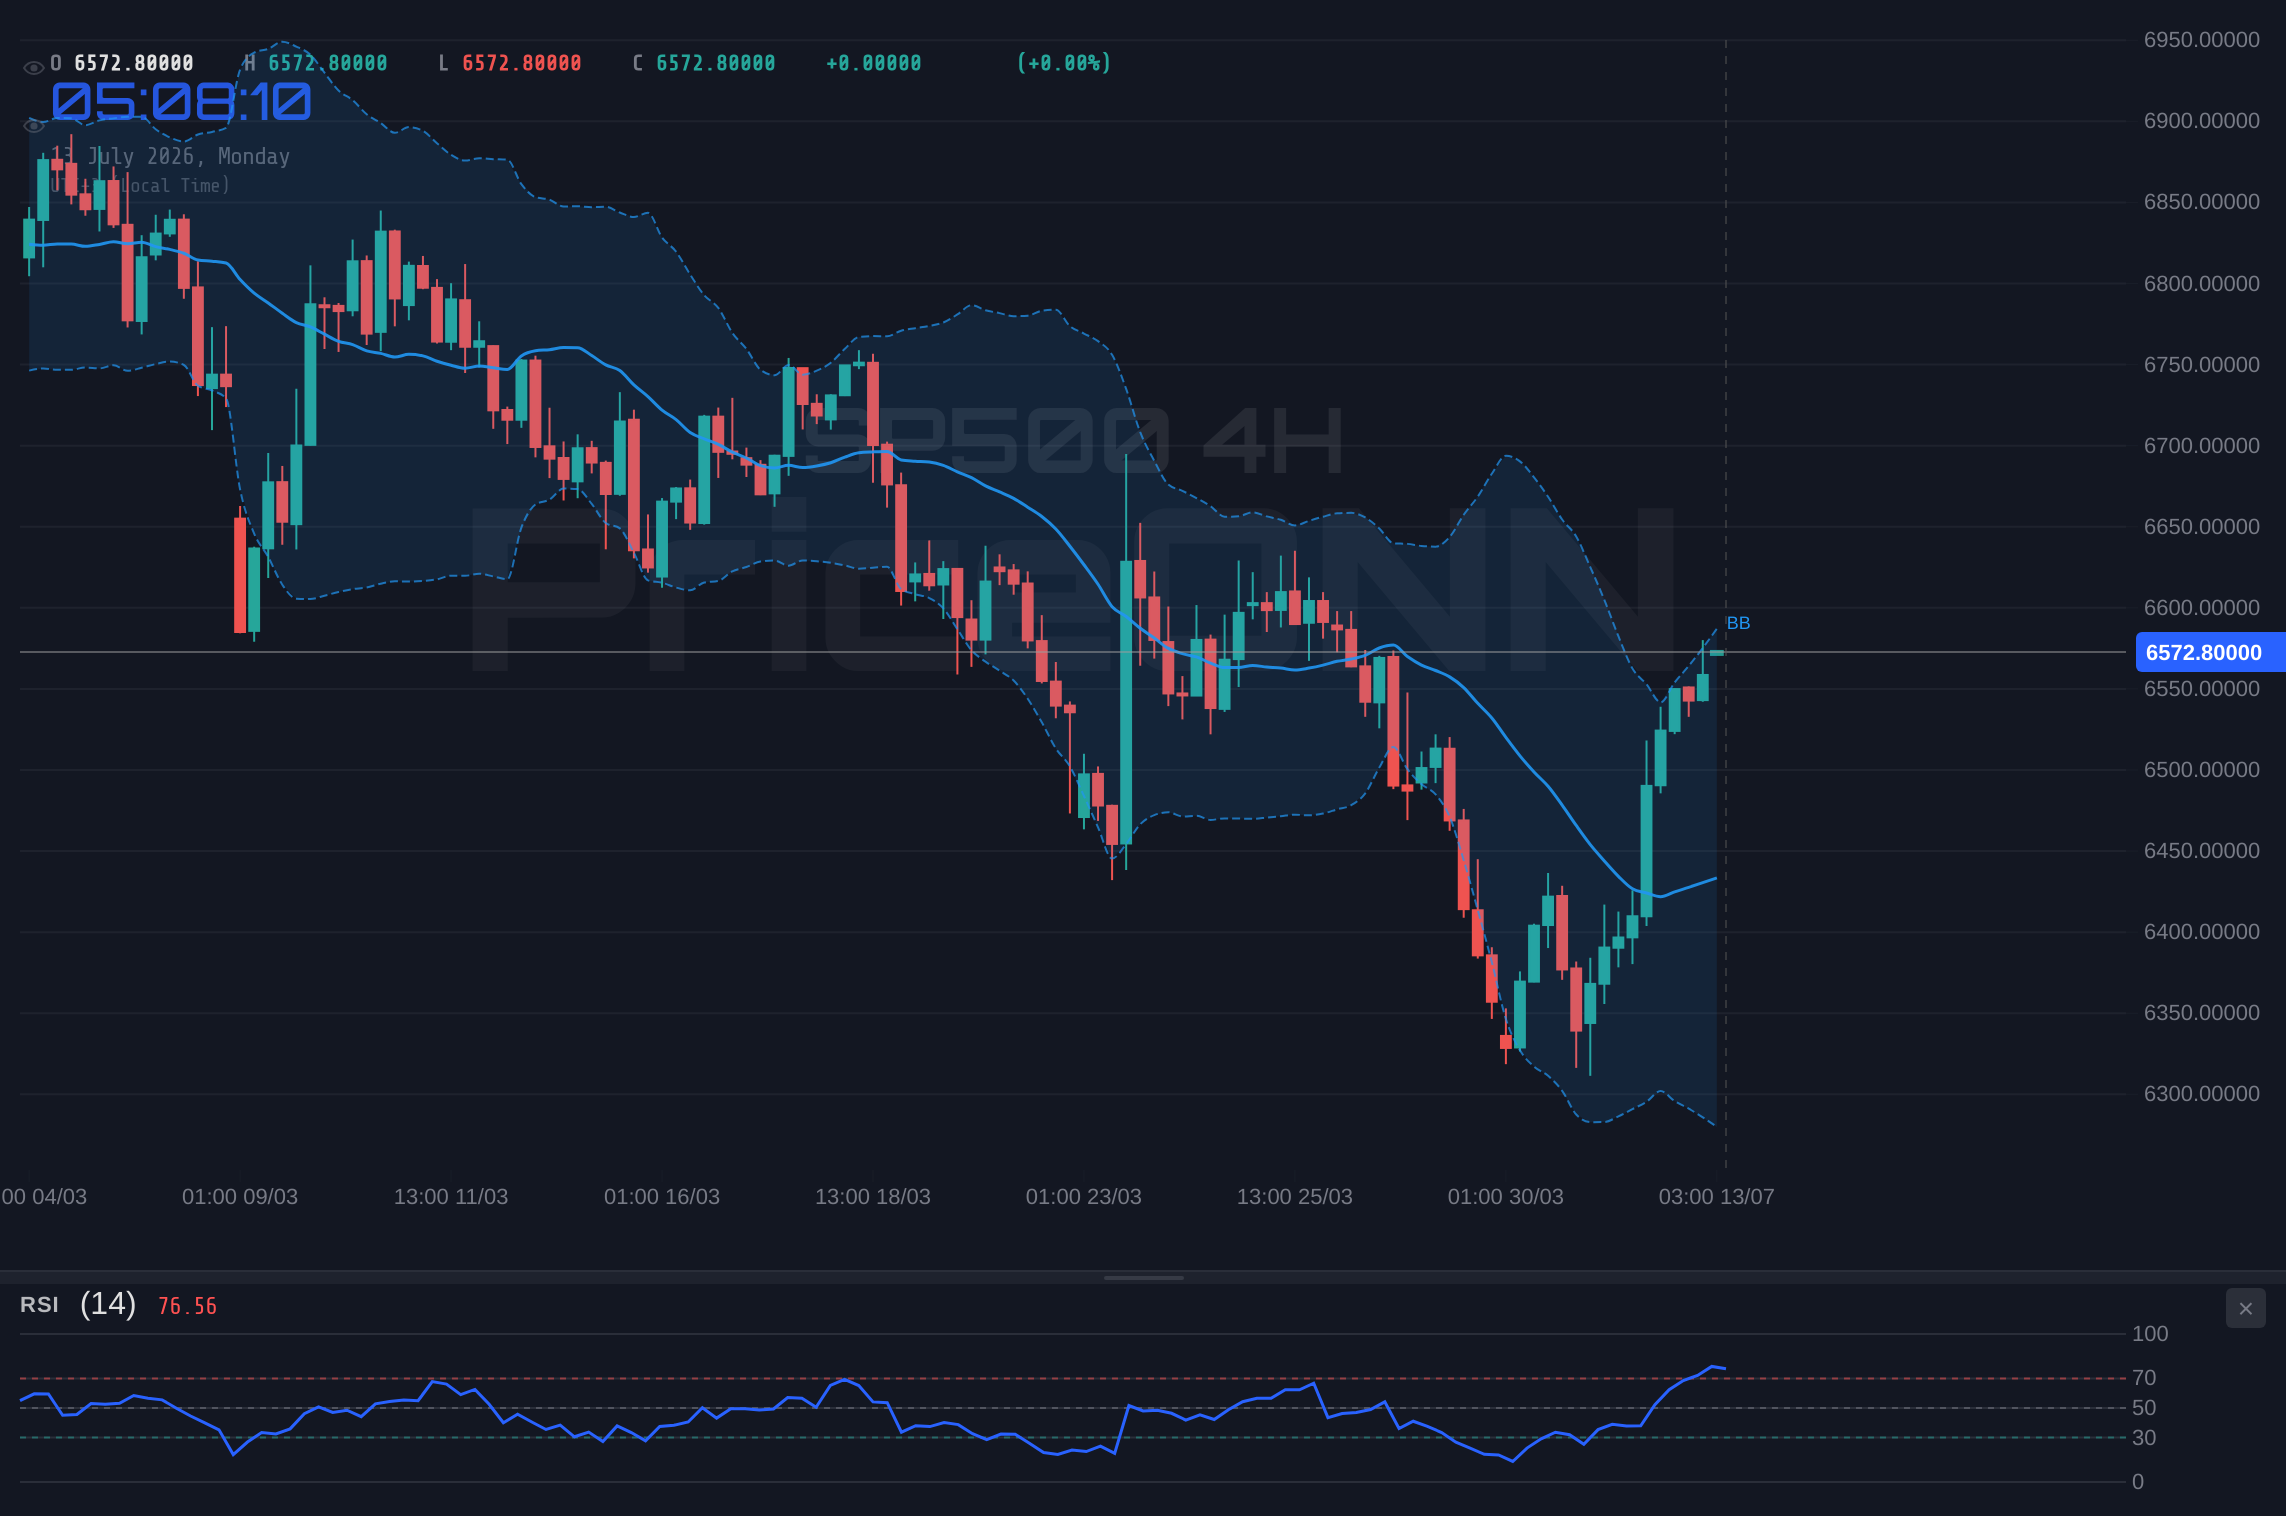
Technisch gesehen kämpft der SP500 derzeit mit einer signifikanten Widerstandszone. Auf dem 1-Stunden-Chart schwebt der Index um 6.572,87 $, wobei das erste wichtige Widerstandsniveau bei 6.605,07 $ identifiziert wurde. Dieses Niveau war ein Streitpunkt, und ein entscheidender Ausbruch darüber wäre ein starkes bullisches Signal, das potenziell den Weg für eine Bewegung zum nächsten Widerstand bei 6.685,83 $ ebnen könnte. Der ADX auf diesem Zeitrahmen liegt bei 49,72, was auf einen starken Trend hindeutet, der, wenn er aufwärts gerichtet ist, eine Bewegung über 6.605,07 $ beschleunigen könnte. Der RSI bei 70,95 liegt jedoch am Rande des überkauften Bereichs, was darauf hindeutet, dass jede weitere Aufwärtsbewegung auf Gewinnmitnahmen stoßen könnte. Diese Konvergenz eines starken Trendindikators und eines sich nähernden überkauften RSI schafft eine prekäre Situation für Bullen.
Der 4-Stunden-Chart präsentiert ein etwas nuancierteres Bild. Der Trend wird als neutral mit einer Stärke von 50 % eingestuft, und der RSI bei 62,83 liegt im bullischen Bereich, ist aber noch nicht überkauft. Der Stochastik-Oszillator zeigt jedoch %K bei 97,85 und %D bei 86,96, was extreme überkaufte Bedingungen und einen potenziellen bärischen Crossover anzeigt. Diese Divergenz zwischen dem RSI und dem Stochastik auf dem 4-Stunden-Chart ist ein Warnsignal. Während der Preis möglicherweise höher steigt, blinken die zugrunde liegenden Momentum-Indikatoren vorsichtig. Der ADX bei 24,23 deutet auf eine moderate Trendstärke hin, nicht so stark wie auf dem 1-Stunden-Chart, was impliziert, dass die aktuelle Aufwärtsbewegung möglicherweise an Überzeugung mangelt. Dies könnte bedeuten, dass 6.605,07 $ eine gewaltige Barriere darstellen, die ohne einen signifikanten Katalysator schwer zu überwinden sein wird.
Auf dem Tages-Zeitrahmen zeigt der Trend des SP500 bärisch mit 100 % Stärke, ein starker Kontrast zu den kürzeren Zeitrahmen. Der RSI liegt bei 45,35, fest im neutralen Bereich, aber abwärtsgerichtet, was mit der bärischen Trendklassifizierung übereinstimmt. Der MACD ist negativ und die Bollinger-Bänder zeigen den Preis unterhalb des mittleren Bandes, was die bärische Aussicht verstärkt. Der ADX bei 47,51 bedeutet einen starken Trend, und angesichts der anderen Indikatoren deutet er auf einen starken Abwärtstrend hin. Diese tägliche Perspektive ist entscheidend; während Intraday- und 4-Stunden-Charts Anzeichen für eine Erholung oder Konsolidierung zeigen könnten, bleibt der längerfristige Trend unter Druck. Dies deutet darauf hin, dass jede Rallye Gelegenheiten für Verkäufer sein könnte, den Markt zu betreten, insbesondere wenn wichtige Widerstandsniveaus halten. Die Unterstützungsniveaus auf dem Tages-Chart, beginnend bei 6.377,47 $, unterstreichen das erhebliche Abwärtsrisiko, wenn sich der breitere bärische Trend wieder durchsetzt.
Die Korrelationsanalyse vertieft unser Verständnis weiter. Ein stärker werdender DXY bei 101,16 ist ein Gegenwind für Aktien. Wenn der Dollar stärker wird, impliziert dies oft eine straffere globale Liquidität oder eine Flucht in Sicherheit, beides ist typischerweise negativ für Aktienmärkte. Wenn der DXY beispielsweise seine Widerstandsniveaus entscheidend durchbrechen würde, würde dies wahrscheinlich zusätzlichen Druck auf den SP500 ausüben und den aktuellen Preis von 6.572,87 $ zu einer potenziellen Decke statt zu einer Startrampe machen. Umgekehrt könnte ein schwächerer DXY Rückenwind bieten und eine Bewegung in Richtung des Widerstands von 6.605,07 $ und darüber hinaus unterstützen. Ebenso stellt die Performance von Öl, das derzeit stark ansteigt, ein komplexes Inflationssignal dar. Während ein starker Ölpreis eine gesunde Nachfrage anzeigen kann, könnte der aktuelle Anstieg Inflationsbedenken verschärfen, was zu einem Szenario führt, in dem die Federal Reserve gezwungen sein könnte, eine straffere Geldpolitik länger beizubehalten, was die Aktienbewertungen belastet.
Die jüngsten Nachrichtenströme fügen dieser Analyse ebenfalls Ebenen hinzu. Berichte über abkühlende Inflationserwartungen gab es bereits zu Beginn der Woche, aber der Anstieg der Energiepreise, wie bei Brent-Rohöl zu sehen, verkompliziert dieses Bild. Sollten die bevorstehenden Inflationsdaten hartnäckige Preisdruckfaktoren bestätigen, insbesondere durch Energiekosten getrieben, könnte dies die vorsichtige Haltung der Federal Reserve bekräftigen. Dies würde wahrscheinlich zu höheren Anleiherenditen und einem stärkeren Dollar führen, beides bärische Faktoren für den SP500. Die Reaktion des Marktes auf solche Nachrichten ist oft schnell und entscheidend, was die bevorstehende Inflationsdruck zu einem großen Risikoereignis macht. Händler werden nicht nur die Schlagzeilen, sondern auch die Kerninflationszahlen und etwaige Kommentare von Fed-Vertretern, die im Anschluss an die Datenveröffentlichung auftauchen könnten, genau prüfen. Dies macht das Widerstandsniveau von 6.605,07 $ noch kritischer, da es unter Bedingungen erhöhter Unsicherheit getestet werden könnte.
Handelsszenarien und Ausblick
Bärisches Szenario: Widerstand hält stand
65% WahrscheinlichkeitKonsolidierungs-Szenario: Inflationsdaten schaffen Unsicherheit
25% WahrscheinlichkeitBullisches Szenario: Inflation kühlt ab, dovish Fed-Pivot erwartet
10% WahrscheinlichkeitHäufig gestellte Fragen: SP500 Analyse
Was passiert, wenn der SP500 den Widerstand von 6.605,07 $ durchbricht?
Ein entscheidender Ausbruch über 6.605,07 $, insbesondere bei starken Inflationsdaten oder dovish Fed-Signalen, könnte eine Bewegung zum nächsten Widerstand bei 6.685,83 $ auslösen. Dies würde eine zunehmende Risikobereitschaft und Potenzial für weitere Aufwärtsbewegungen signalisieren.
Sollte ich den SP500 bei aktuellen Niveaus von 6.572,87 $ angesichts der gemischten Signale kaufen?
Vorsicht ist bei 6.572,87 $ geboten, da der Widerstand bei 6.605,07 $ nahe liegt und die bevorstehenden Inflationsdaten anstehen. Ein sichererer Einstieg könnte nach einem bestätigten Ausbruch über den Widerstand oder einem erneuten Test der Unterstützung um 6.535,07 $ erfolgen, abhängig vom Ergebnis der Daten.
Ist der RSI bei 67,35 derzeit ein Verkaufssignal für den SP500?
Ein RSI von 67,35 auf dem 1-Stunden-Chart zeigt eine starke Aufwärtsdynamik, liegt aber noch nicht im überkauften Bereich. Obwohl dies darauf hindeutet, dass die Bullen aktiv sind, stellt es kein automatisches Verkaufssignal dar. Eine Bestätigung durch die Kursentwicklung und andere Indikatoren, wie ein bärischer MACD-Kreuzung oder ein Scheitern am Widerstand, wäre erforderlich.
Wie werden die bevorstehenden Inflationsdaten den SP500 diese Woche beeinflussen?
Deutlich niedrigere Inflation könnte den SP500 ankurbeln, indem sie die Erwartungen an Zinssenkungen durch die Fed erhöht und ihn potenziell über 6.605,07 $ treibt. Umgekehrt könnten höhere als erwartete Inflationszahlen einen Test der Unterstützungsniveaus um 6.535,07 $ zur Folge haben, da die Märkte länger anhaltend höhere Zinsen einpreisen.
| Indikator | Wert | Signal | Interpretation |
|---|---|---|---|
| RSI (14) | 67.35 | Neutral | Nähert sich überkauftem Bereich, auf Rückgänge achten |
| MACD Histogramm | -0.52 | Bärisch | Negative Dynamik, potenzieller Abwärtsdruck |
| Stochastik %K | 97.85 | Bärisch | Extrem überkauft, potenzielle Umkehr |
| ADX | 49.72 | Bullisch | Starke Trendstärke |
| Bollinger Bänder | Mittleres Band | Beobachten | Preis über mittlerem Band, aber Trend unklar |
Märkte in Echtzeit verfolgen
KI-gestützte Analyse und Echtzeit-Preisdaten.
Treten Sie unserem Telegram-Kanal bei
Aktuelle Marktnachrichten und KI-Analysen sofort.
Kanal beitreten