

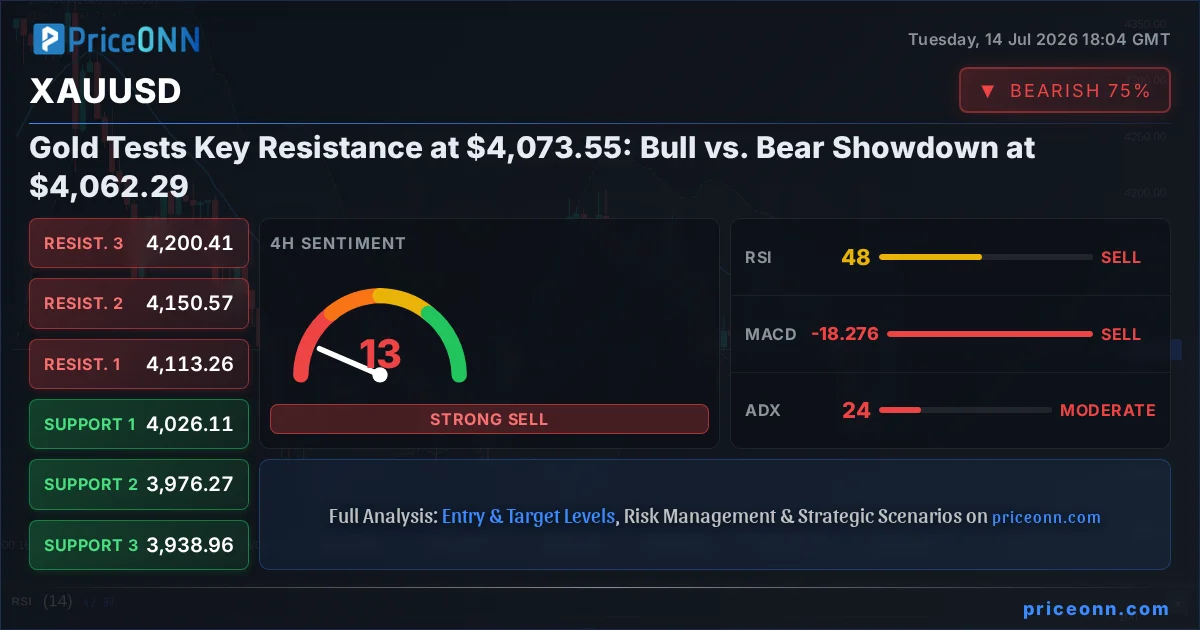
The battle lines are drawn around $4,062.29 for XAUUSD, a price point currently acting as a battleground between bullish aspirations and bearish pressures. This critical level, nestled within a broader neutral trend according to 1-hour technicals, is seeing intense price action as traders weigh conflicting signals. On one side, the immediate 1-hour chart screams 'buy' with a strong ADX of 40.06 and a bullish RSI of 58.89, suggesting momentum is on the side of the buyers. Yet, delve deeper into the 4-hour and daily timeframes, and a different narrative emerges. The 4-hour chart shows a neutral trend with a bearish lean, RSI dipping to 48.54, and MACD indicating negative momentum. The daily chart reinforces this cautious outlook, with RSI at 42.48 and a strong daily ADX of 38.11 pointing to a potent downtrend. This divergence across timeframes creates significant uncertainty, making the current price of $4,062.29 a pivotal moment for gold's next major move.
- XAUUSD is currently trading at $4,062.29, a critical level where 1-hour bullish momentum clashes with daily bearish trends.
- The 1-hour RSI at 58.89 suggests upward pressure, while the daily RSI at 42.48 indicates a prevailing bearish sentiment.
- Key resistance looms at $4,073.55, with support identified at $4,057.07 on the 1-hour chart.
- Divergent signals across timeframes create a volatile environment, with the DXY's slight dip and Brent oil's rise adding complexity.
The Bull Case: Riding the Momentum Wave
Bulls are undoubtedly drawing confidence from the immediate H1 technical picture. The RSI at 58.89, while not yet in overbought territory, clearly indicates a positive bias and upward momentum. This is further supported by the MACD, which is showing positive momentum and trading above its signal line, a classic sign of strengthening buying pressure. The ADX on the 1-hour chart stands robustly at 40.06, confirming a strong trend is in play. For the bulls, this suggests that the recent upward move, which saw gold prices climb to $4,062.29 and test the upper bounds of its intraday range, is sustainable. The immediate target would be the first resistance level at $4,066.15. A decisive break and hold above this level, particularly with increasing volume, could pave the way for a swift advance towards the next resistance at $4,070.94 and potentially the more significant $4,073.55. This thesis is bolstered by the fact that the Dollar Index (DXY) has seen a slight dip to 100.94, which typically correlates with strength in gold. Furthermore, Brent crude oil is showing a strong upward trend, currently trading around $83.47, which can fuel inflation expectations and, by extension, safe-haven demand for gold. If inflation concerns continue to simmer, as suggested by oil's rally, gold could find further impetus to climb, especially if upcoming US CPI data proves to be hotter than expected, forcing a more aggressive stance from the Federal Reserve down the line, or conversely, a weaker number that prompts a risk-on rally. The overall signal on the 1-hour chart is a strong 'BUY' (6 buys, 2 sells), which is a powerful indicator for short-term traders looking to capitalize on immediate price action.
The Bear Case: Daily Trend and Divergence Concerns
However, the optimism painted by the 1-hour chart is significantly challenged when broadening the perspective to the daily and even the 4-hour timeframes. The 4-hour chart presents a neutral trend with a bearish inclination, as indicated by an RSI of 48.54 and negative MACD momentum. This suggests that the buying pressure seen in the shorter timeframe might be a temporary retracement within a larger, more dominant downward move. The daily chart is even more telling. Here, the RSI is firmly in bearish territory at 42.48, showing a clear downward eğilim. The ADX on the daily chart is a formidable 38.11, underscoring a strong existing downtrend. This technical picture implies that the current price action around $4,062.29 is merely a pause in a larger decline. Bears are keenly watching for any signs of failure at the current resistance levels, particularly the $4,066.15 and $4,070.94 marks. A rejection from these levels, especially if accompanied by increasing selling volume, could signal a resumption of the downtrend. The first support level to watch on the 1-hour chart is $4,057.07, followed by $4,052.78. A decisive break below these levels would confirm the bearish sentiment and could lead to a rapid decline towards the 4-hour support at $4,026.11. The conflicting Stochastic signals across timeframes also add to the bearish argument. While the 1-hour Stochastic shows a 'sell' signal (%K
Weighing the Indicators: A Tale of Two Timeframes
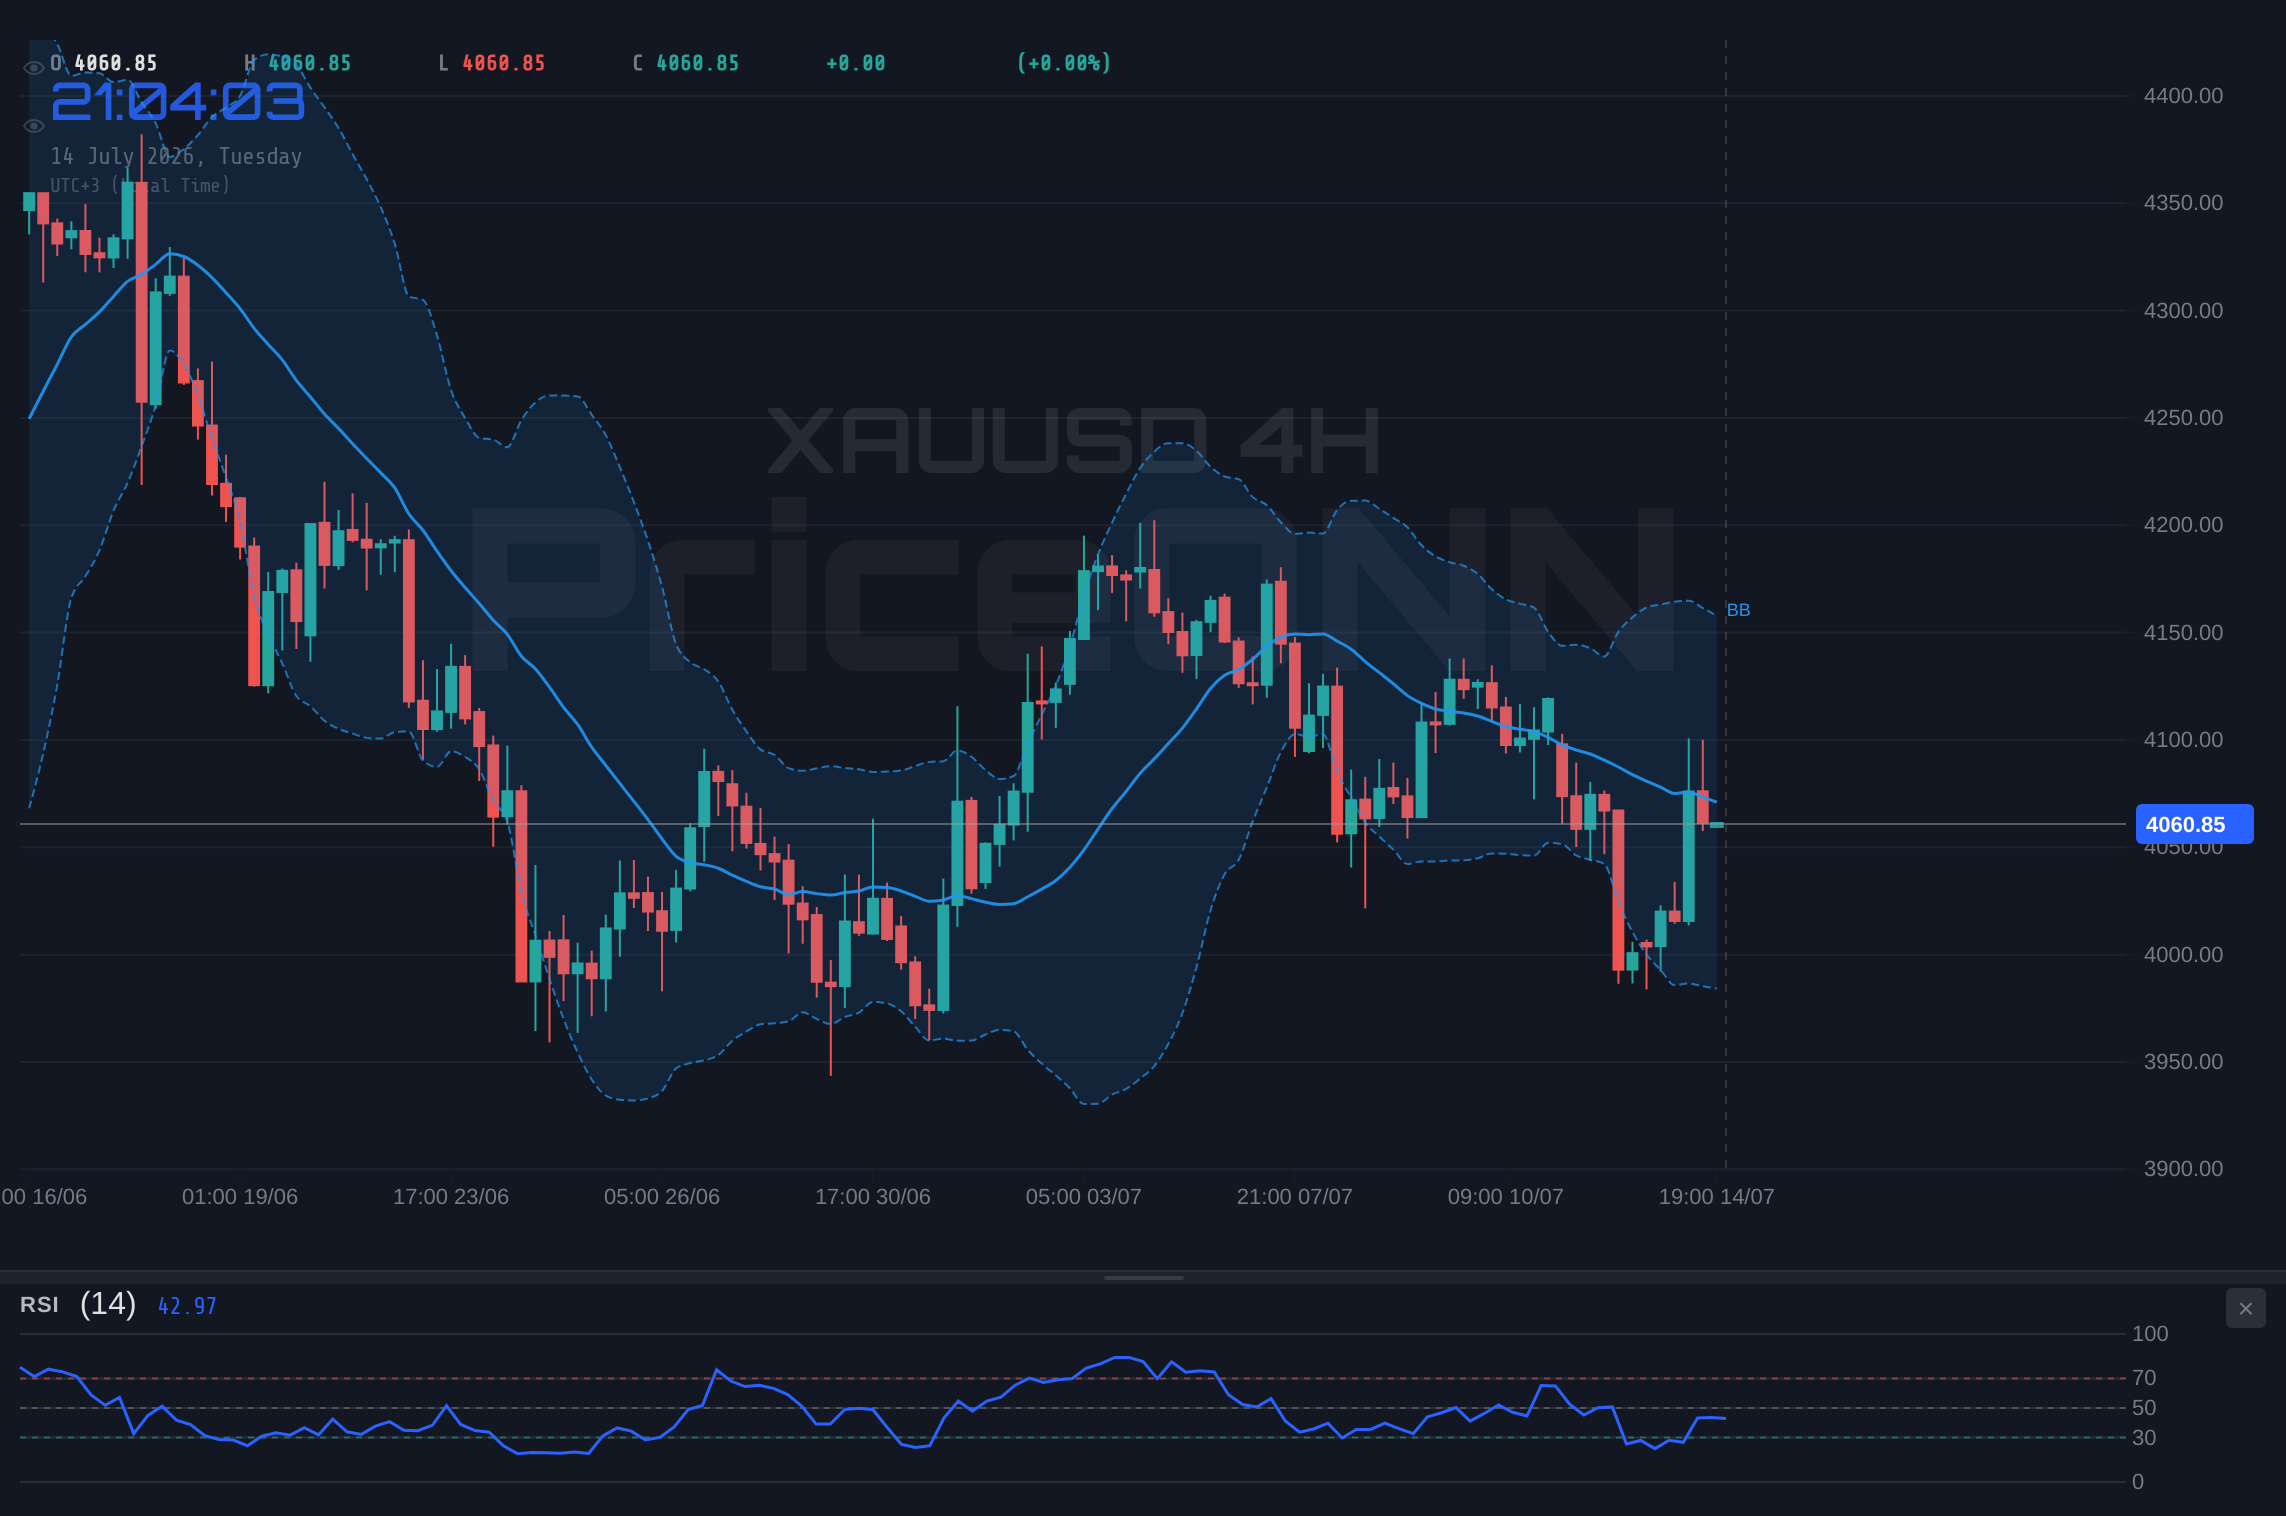
The divergence in technical signals between the short-term (1-hour) and long-term (4-hour and daily) charts is the crux of the current XAUUSD dilemma. On the 1-hour chart, indicators like RSI (58.89) and MACD are leaning bullish, supported by a strong ADX (40.06). This paints a picture of immediate upward momentum, potentially targeting the $4,073.55 resistance. Bulls might interpret this as the start of a recovery, perhaps driven by short-covering or anticipation of favorable economic data. They would be looking for confirmation through sustained price action above $4,066.15. Conversely, the 4-hour and daily charts present a more somber outlook. The daily RSI at 42.48 and ADX at 38.11 are strong indicators of a prevailing downtrend. The MACD on the daily chart, while showing positive momentum, is still below the signal line in some readings, and the Bollinger Bands are below the middle band, suggesting bearish pressure. The Stochastic oscillator provides a confusing mix: a sell signal on the 1-hour and daily charts, but a buy signal on the 4-hour. This indecision from the Stochastic suggests that traders should be wary of immediate directional bets. The conflict between the short-term bullish signals and the longer-term bearish indicators highlights a market in transition or consolidation. Traders must decide whether the immediate strength is a precursor to a trend reversal or merely a temporary pause before the larger downtrend resumes. The 1-hour 'AL' signal is compelling for intraday traders, but the daily 'SAT' signals demand respect from those with a longer investment horizon.
Fundamental Undercurrents: Inflation, Fed, and Geopolitics
Beyond the technical indicators, fundamental factors are playing a crucial role in shaping the gold market's narrative around $4,062.29. The upcoming US Consumer Price Index (CPI) data release is a significant event on the economic calendar. Expectations are for inflation to cool, partly due to falling fuel prices, as reported by the US Bureau of Labor Statistics. However, any deviation from these expectations could trigger substantial market moves. If CPI comes in hotter than anticipated, it could reignite inflation fears, boost demand for gold as an inflation hedge, and potentially increase bets on further Federal Reserve interest rate hikes. Conversely, a significantly cooler CPI reading might reinforce the narrative of disinflation, potentially leading to a risk-on sentiment where investors move away from safe-haven assets like gold towards riskier assets, and also reduce expectations for Fed hikes. The market's reaction to the Dollar Index (DXY) is also key. The current slight dip in the DXY to 100.94 provides some breathing room for gold, but any resurgence in dollar strength, perhaps fueled by hawkish Fed commentary or stronger-than-expected US economic data, would likely exert downward pressure on XAUUSD. Geopolitical tensions, while not explicitly detailed in the provided data, remain a constant backdrop. The rise in Brent crude oil prices to $83.47 suggests underlying supply concerns or geopolitical risks in energy-producing regions, which can indirectly support gold prices by increasing inflation expectations and safe-haven demand. The conflicting signals from these fundamental drivers - potential for higher inflation versus a cooling trend, a weakening dollar versus potential Fed tightening - create a complex environment for gold, making it difficult to establish a clear directional bias solely based on macroeconomics.
The Role of Correlation: DXY and Equities
Understanding the correlation between XAUUSD and other major markets is paramount for a comprehensive analysis. The inverse relationship between gold and the US Dollar Index (DXY) is a well-established principle. Currently, the DXY is trading at 100.94, showing a slight decline. This has provided some tailwind for gold, helping it to test resistance levels. If the DXY continues to weaken, perhaps due to a less hawkish Federal Reserve stance or a broader shift in global risk sentiment, gold could find further upside potential. However, if the DXY reverses its trend and begins to climb again, driven by renewed safe-haven demand or anticipation of aggressive Fed tightening, it would almost certainly put pressure on XAUUSD. The correlation with equity markets, particularly the S&P 500 and Nasdaq, also warrants attention. The S&P 500 is showing a strong upward trend, trading at 6572.87, while the Nasdaq is also climbing at 29660.04. Typically, a strong equity market reflects increased risk appetite, which can sometimes draw capital away from safe-haven assets like gold. However, in the current environment, the relationship can be nuanced. If the rally in equities is perceived as unsustainable or driven by factors that also fuel inflation (like commodity price surges), gold might still benefit. Conversely, a significant downturn in equities, signaling a broader risk-off sentiment, would likely boost gold prices as investors seek refuge. The current divergence between the bullish equity markets and the mixed signals in gold, with its strong 1-hour bullishness battling longer-term bearish indicators, suggests that traders are carefully monitoring these correlations for confirmation of a sustained move. The fact that Brent crude is rising while equities are also strong adds another layer of complexity, potentially indicating a scenario where inflation fears are driving both commodity prices and a search for hard assets, even amidst general risk appetite.
Navigating the Short-Term vs. Long-Term Conflict
The immediate challenge for traders analyzing XAUUSD at $4,062.29 lies in reconciling the conflicting signals from different timeframes. The 1-hour chart presents a compelling case for a short-term bullish continuation. With RSI at 58.89, MACD bullish, and ADX at 40.06, the path of least resistance appears to be upwards, targeting resistance levels like $4,066.15 and $4,070.94. This timeframe is crucial for day traders and scalpers looking to capitalize on intraday volatility. They might initiate long positions with tight stop-losses just below the $4,057.07 support level, aiming for quick gains. However, the longer-term picture, particularly the daily chart, paints a starkly different scenario. The RSI at 42.48 and a strong ADX of 38.11 strongly suggest that the overarching trend is still down. This implies that any short-term rallies might be opportunities for sellers to re-enter the market at more favorable prices, aiming for the daily support levels around $3,957.11. Swing traders and those with a longer investment horizon must weigh the strength of the daily trend against the immediate bullish signals. Confirmation would be needed on the daily chart to suggest a genuine trend reversal. This could involve a sustained close above the $4,073.55 resistance, followed by a successful retest of this level as support. Until then, the prevailing bearish sentiment on the daily chart should temper aggressive bullish bets. The conflicting Stochastic signals - bearish on 1-hour/daily, bullish on 4-hour - add another layer of complexity, highlighting the current market indecision and the need for caution. The market is essentially offering two opposing narratives, and the price action around $4,062.29 will be key to determining which one prevails.
The $4,073.55 Resistance: A Crucial Test
The resistance level at $4,073.55 emerges as a critical focal point for XAUUSD in the immediate trading sessions. For the bulls to gain sustained control, a decisive breach of this level is paramount. Currently trading at $4,062.29, gold needs to overcome not only the immediate intraday resistance at $4,066.15 and $4,070.94 but also this more significant daily resistance. A successful push above $4,073.55, especially if accompanied by strong buying volume and a positive break in longer-term indicators like the daily RSI moving back above 50, would invalidate the current bearish outlook on the daily chart. It would signal a potential shift in trend, opening the door for further upside towards higher resistance levels, perhaps even challenging the $4,113.26 mark on the 4-hour chart. Traders anticipating such a move would look for confirmation, such as a bullish crossover on the daily MACD or a sustained period of trading above the middle Bollinger Band on the daily timeframe. On the other hand, a failure to break through $4,073.55, leading to a price rejection and a move back below the $4,057.07 support, would strongly reinforce the bearish case. This would suggest that the intraday strength was merely a 'bull trap' or a profit-taking rally within the established downtrend. In such a scenario, the focus would shift to the downside targets, with the $4,052.78 and $4,047.99 levels on the 1-hour chart, and subsequently the $4,026.11 support on the 4-hour chart, becoming the next areas of interest. The outcome of this test at $4,073.55 will likely dictate gold's trajectory for the coming days, acting as a key determinant in the ongoing bull vs. bear debate.
The $4,057.07 Support: A Line in the Sand for Bulls
Conversely, the support level at $4,057.07 represents a crucial line in the sand for the bulls. Should the price action falter near the current resistance or if bearish sentiment intensifies, this level will be the first significant barrier to prevent a steeper decline. A hold above $4,057.07, even amidst intraday volatility, would suggest that the short-term bullish momentum is still intact, or at least that the bears are struggling to gain firm control. This could manifest as a bounce from this level, potentially leading to another attempt at the $4,066.15 resistance. For bulls, a successful defense of $4,057.07 would be a sign of resilience, indicating underlying buying interest that prevents a rapid sell-off. They would be looking for this level to hold firm, perhaps with lower volume on the decline towards it, followed by a pickup in buying volume as the price rebounds. Confirmation of strength here would involve the RSI remaining above 50 on the 1-hour chart and the MACD holding its bullish posture or showing a less pronounced bearish divergence. However, a decisive break below $4,057.07 would be a significant warning sign for the bulls. It would suggest that the short-term buying pressure has evaporated and that the longer-term bearish trend, as indicated by the daily chart's RSI at 42.48 and ADX at 38.11, is reasserting itself. A close below this support level would likely trigger stop-loss orders and accelerate selling, opening the path towards the next support at $4,052.78 and potentially the more substantial $4,047.99. The ability of the market to hold $4,057.07 will be a key indicator of whether the current price action is a mere pause or the beginning of a more significant pullback. This level is not just a technical support; it's a psychological marker for the bulls to defend.
Economic Calendar Watchlist: CPI and Beyond
The immediate future for XAUUSD is heavily influenced by upcoming economic data, with the US Consumer Price Index (CPI) release being the most critical event on the horizon. As noted, expectations are for cooling inflation due to tumbling fuel prices, a narrative that could significantly impact Federal Reserve policy expectations and, consequently, gold prices. A CPI report that shows inflation cooling faster than expected could lead to a risk-on environment, potentially pressuring gold. Conversely, a sticky or higher-than-expected inflation print would likely bolster safe-haven demand for gold and increase speculation about further Fed rate hikes, both of which are bullish for XAUUSD. Beyond the CPI, traders will be closely watching other economic indicators. Upcoming employment data, such as Non-Farm Payrolls (NFP), and manufacturing/services PMIs will provide further clues about the health of the US economy and the Fed's likely path. Any signs of economic weakness could support gold's safe-haven appeal, while robust growth figures might favor a stronger dollar and weaker gold. Central bank communications, particularly from the Federal Reserve, will also be crucial. Any hints about the future direction of interest rates or quantitative easing policies will be scrutinized for their impact on gold. Geopolitical developments, though less predictable, can also act as significant catalysts. Escalations in existing conflicts or the emergence of new geopolitical hotspots could trigger a flight to safety, driving gold prices higher regardless of the immediate economic data. The current price of $4,062.29 sits at a precarious balance, awaiting these fundamental catalysts to provide a clearer directional signal.
The Verdict: A Precarious Balance Demanding Caution
The current technical and fundamental landscape for XAUUSD at $4,062.29 presents a market in a state of precarious balance, demanding a high degree of caution from traders. While the 1-hour chart offers a compelling bullish setup with strong momentum indicators and a positive ADX, the longer-term daily and 4-hour charts reveal underlying bearish pressures and significant divergence. The RSI on the daily chart at 42.48 and a robust ADX of 38.11 suggest that the prevailing trend may still be downwards, making the current upward push a potential retracement rather than a true trend reversal. The upcoming US CPI data is a critical wildcard. A cooler-than-expected reading could fuel a risk-on rally, potentially pushing gold lower as investors favor growth assets, while a hotter print could reignite inflation fears, supporting gold as a safe haven and potentially leading to more Fed tightening bets. The DXY's slight dip provides some support, but its correlation with gold remains a key factor to monitor. Given the conflicting signals across timeframes and the significant fundamental uncertainties, it is prudent to adopt a cautious approach. The $4,073.55 resistance level is a key battleground; a failure to decisively break above it, especially with bearish confirmation from longer-term charts, would likely signal a resumption of the downtrend. Conversely, a sustained hold above $4,057.07, coupled with bullish confirmation on daily indicators, could initiate a more significant upward move. Until a clearer directional bias emerges from these conflicting forces, patience and risk management are paramount. The market is not yet offering a high-conviction setup, making it a zone where scalpers might find opportunities but longer-term investors should exercise restraint.
Bearish Scenario: Trend Resumption
60% ProbabilityNeutral Scenario: Consolidation Around $4,062.29
25% ProbabilityBullish Scenario: Resistance Breakout
15% ProbabilityFrequently Asked Questions: XAUUSD Analysis
What happens if XAUUSD breaks above the $4,073.55 resistance level?
A sustained break above $4,073.55, confirmed by daily chart indicators turning bullish, could signal a trend reversal. This might open the door for further gains towards the $4,113.26 level on the 4-hour chart, suggesting a strong bullish move is underway.
Should I buy XAUUSD at current levels of $4,062.29 given the mixed signals?
Buying at $4,062.29 is a high-risk proposition due to conflicting signals between short-term bullish momentum and longer-term bearish trends. A more prudent approach might be to wait for confirmation, such as a hold above $4,057.07 or a clear break above $4,073.55, which would offer a higher probability setup.
Is the RSI at 58.89 a buy signal for XAUUSD right now?
An RSI of 58.89 on the 1-hour chart indicates positive momentum but is not yet in overbought territory, suggesting room for upward movement. However, the daily RSI at 42.48 contradicts this, indicating caution is warranted as the longer-term trend may still be bearish.
How will the upcoming US CPI data affect XAUUSD this week?
If US CPI data comes in hotter than expected, it could fuel inflation fears and support gold prices as a safe haven, potentially pushing XAUUSD towards resistance. Conversely, cooler data might weaken gold by reducing Fed tightening expectations and encouraging a risk-on rally away from safe assets.
Track markets in real-time
AI-powered analysis, technical indicators and real-time price data.
Join Our Telegram Channel
Breaking market news, AI analysis and trading signals instantly.
Join Channel