

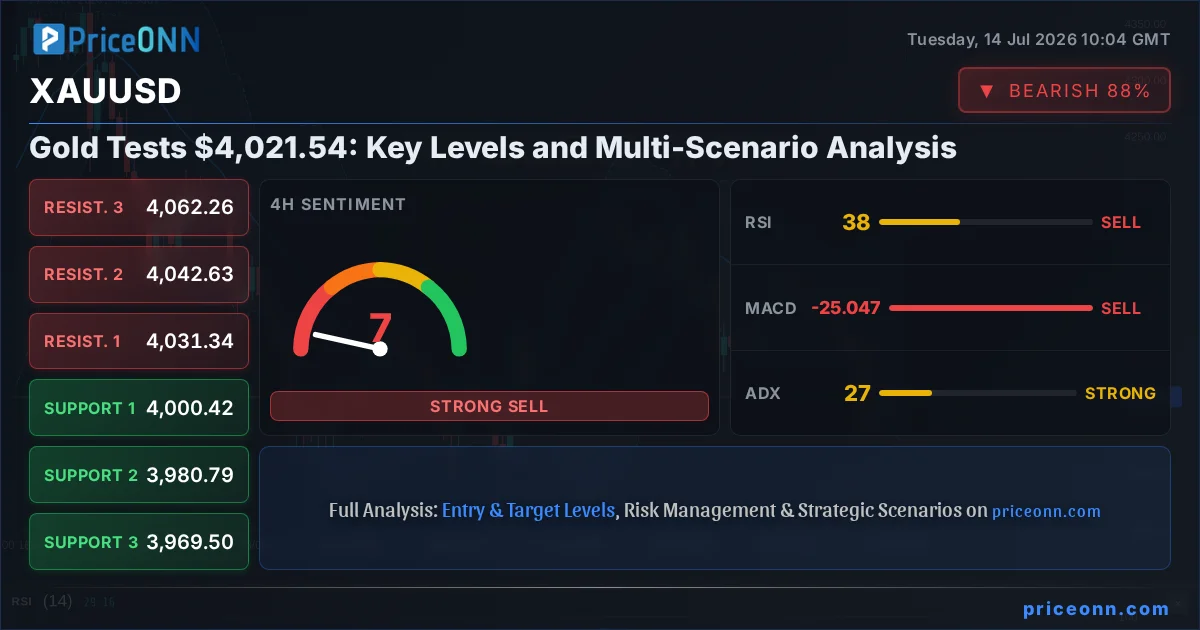
Gold is currently testing the critical $4,021.54 level, a point of significant attention for traders navigating a complex market landscape. With the Dollar Index (DXY) showing a slight pullback to 101.10 and Brent crude oil surging to $85.47, the precious metal finds itself at an interesting crossroads. This XAUUSD today analysis delves into the intricate technical indicators and market sentiment, dissecting multiple scenarios to provide a clear trading roadmap.
- RSI at 45.48 on the 1H chart signals neutral pressure with a slight downward lean, indicating a lack of strong buying conviction.
- Critical support for XAUUSD is identified at $3,957.11 on the daily timeframe, a level that has historically provided a floor.
- The MACD histogram on the 1H chart shows positive momentum, suggesting short-term buying interest, but this conflicts with the broader bearish trend on the 4H and 1D charts.
- DXY at 101.10 is currently experiencing a minor dip, which historically supports gold, but the overarching strong trend in DXY suggests this may be temporary.
The broader market sentiment is currently mixed, with equities showing divergent trends. While the S&P 500 is up 0.74% to 6572.87, suggesting some risk appetite, the Dow Jones Industrial Average has dipped 0.13% to 52390.50. This divergence adds a layer of complexity to gold's outlook, as it typically benefits from both risk-off sentiment (driving safe-haven demand) and inflationary pressures (often linked to rising oil prices). The current price action around $4,021.54 reflects this tug-of-war, with neither bulls nor bears able to establish decisive control in the short term.
The Bull's Roadmap: Chasing the $4,073 Resistance
Establishing the Bullish Case
For gold bulls to regain control, a decisive break and hold above the immediate 1-hour resistance at $4,021.43 is paramount. This initial hurdle needs to be cleared with conviction, ideally accompanied by increasing trading volume. Following this, the next significant resistance level to watch is $4,027.14. A sustained push above this zone would signal a shift in short-term momentum, potentially paving the way for a test of the more substantial daily resistance at $4,073.55. The RSI(14) on the 1-hour chart, currently at 45.48, needs to climb decisively into the 50-70 range to confirm strengthening bullish sentiment. Similarly, the MACD on the 1H chart, while showing positive momentum, needs to maintain its position above the signal line and ideally push higher, indicating that the upward pressure is building.
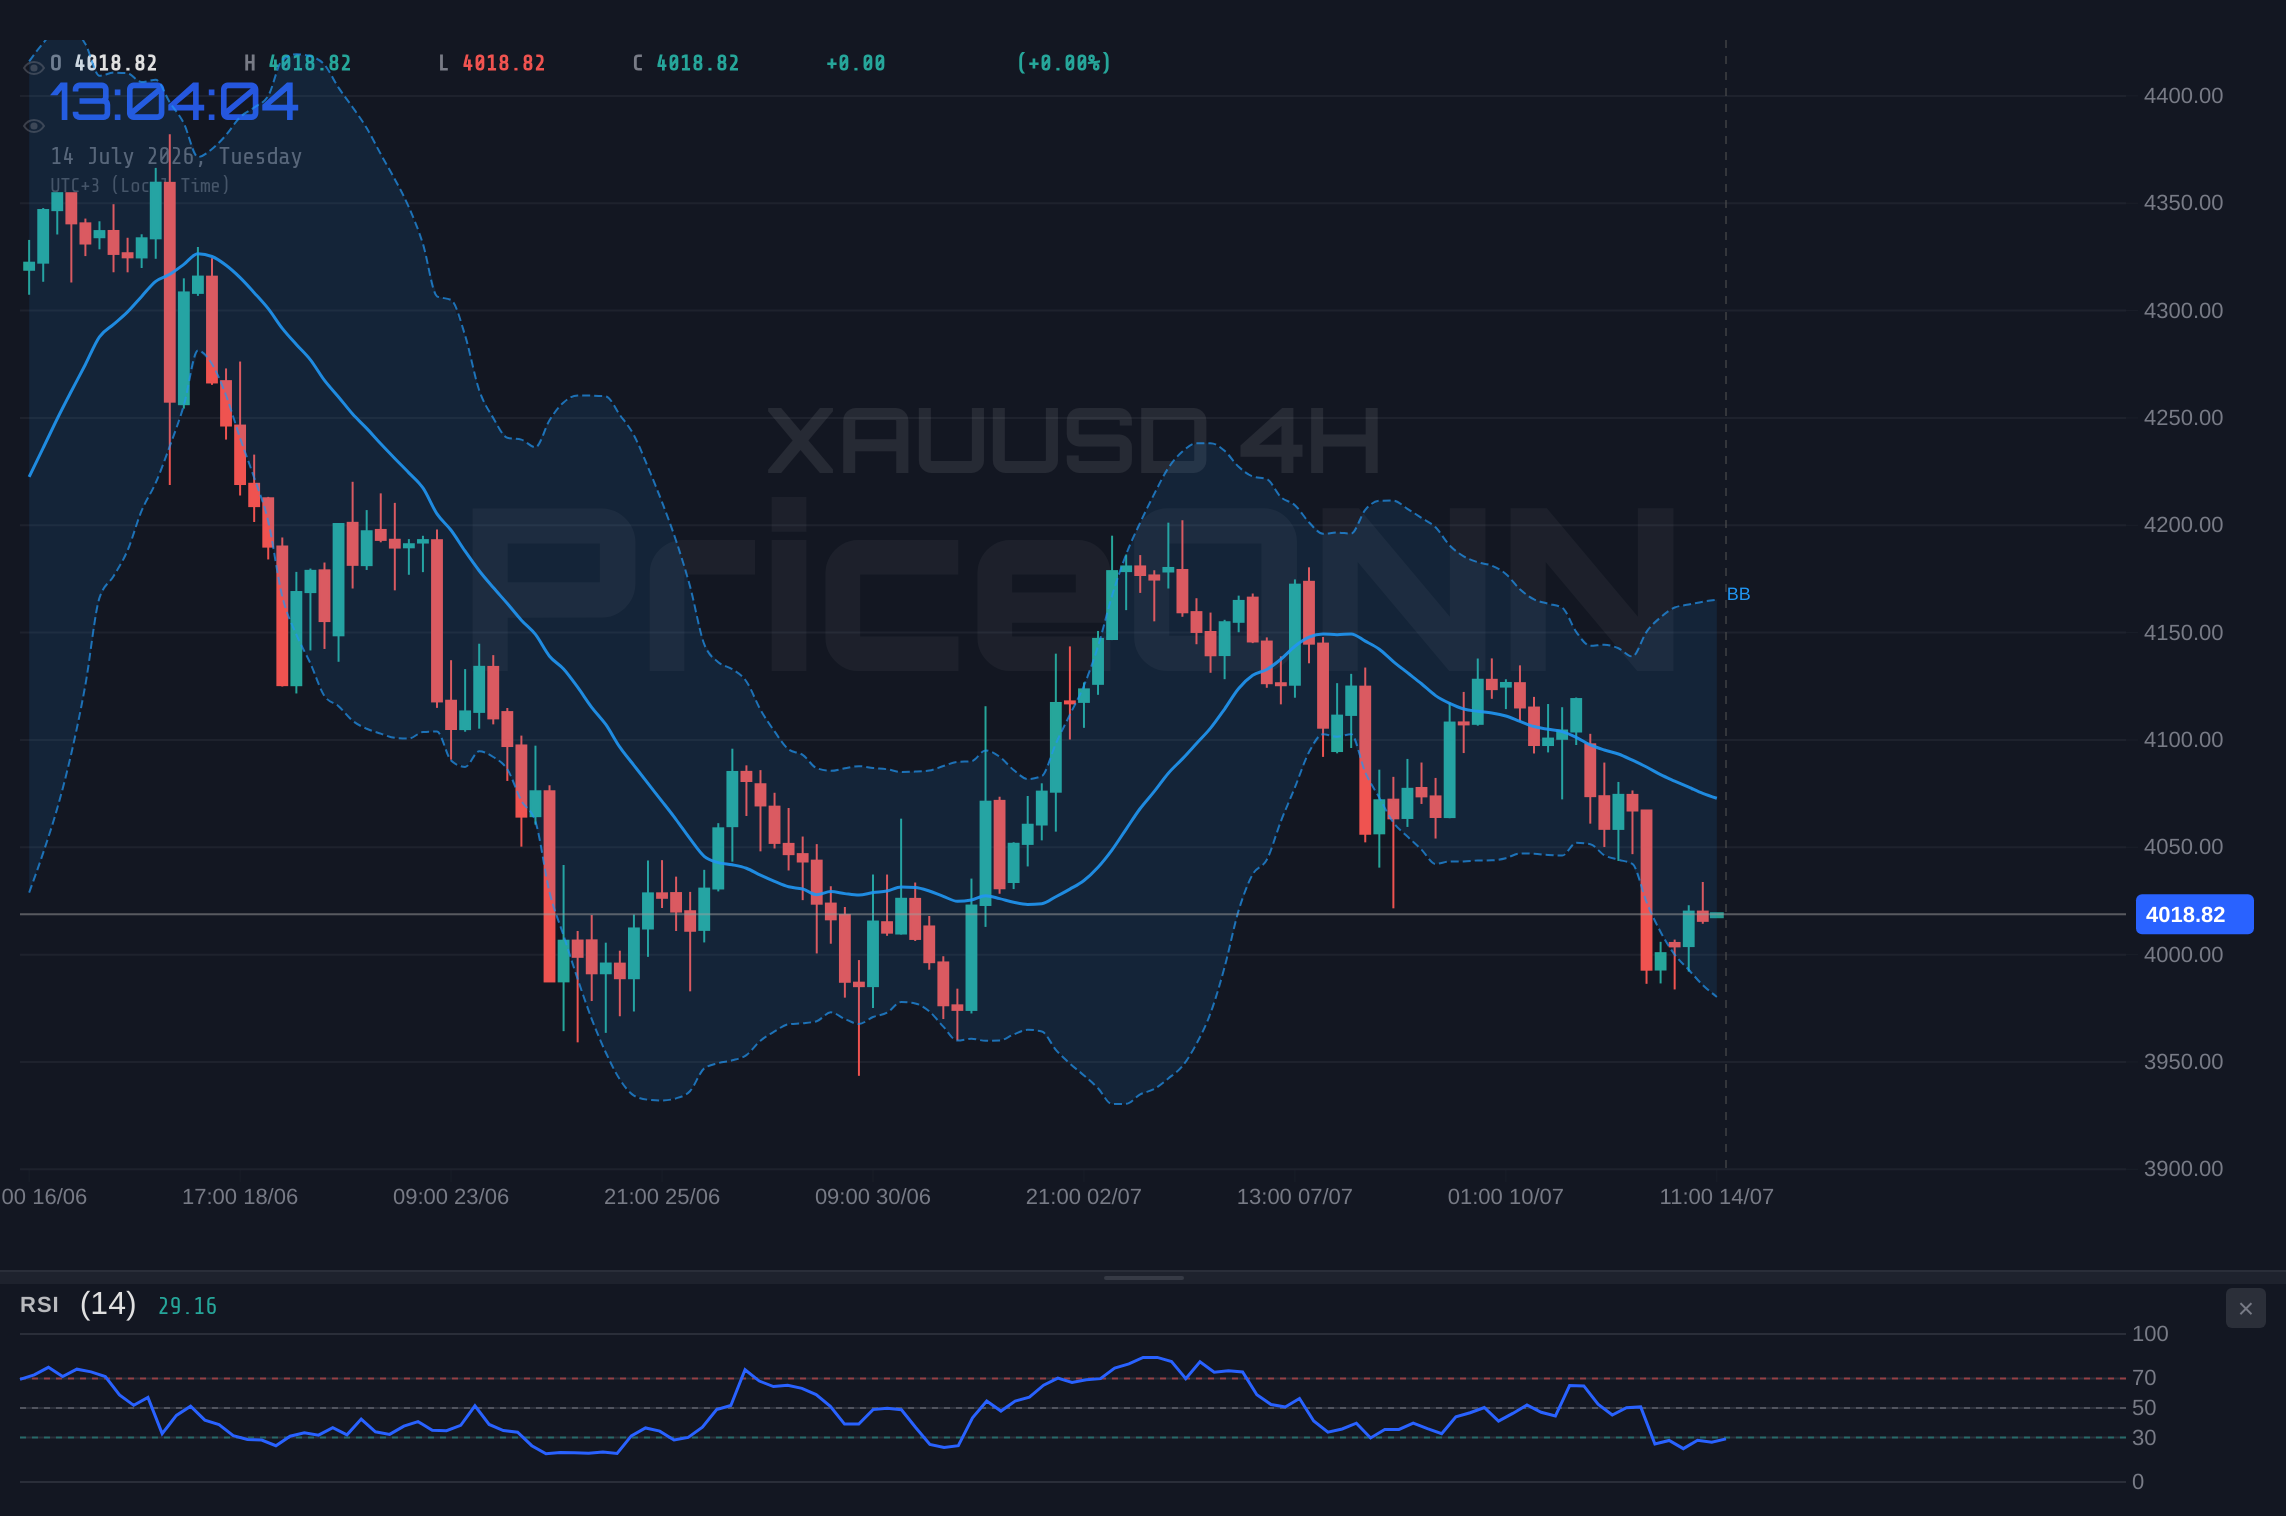
The ADX indicator presents a challenge to the bullish narrative. On the 1H timeframe, it reads 43.08, indicating a strong trend, but the directionality is currently favoring the downside. For a sustained bullish move, we would ideally want to see the ADX decline or at least stabilize, with the +DI moving above the -DI. However, given the current trend strength, a more likely scenario for a bullish move to gain traction would involve a significant catalyst that fundamentally shifts market expectations, such as a surprise dovish pivot from the Federal Reserve or a sudden escalation in geopolitical tensions that dramatically increases safe-haven demand. Without such a catalyst, breaking through the established resistance levels will be an uphill battle, requiring significant buying pressure to overcome the prevailing bearish undertones seen on the longer timeframes.
Confirmation and Targets
Confirmation of a bullish reversal would require a daily close above $4,073.55. If this level is breached, the next logical targets would be the daily resistance levels at $4,146.42 and subsequently $4,189.99. The 4-hour chart, which currently shows a strong downtrend (ADX 27.34), would need to see a significant shift, with the RSI climbing above 50 and the MACD generating a bullish crossover. The Stochastic oscillator on the 4H chart is showing a potential buy signal (%K > %D), but this is in the oversold territory (K=24.37, D=18.37), suggesting that while a bounce is possible, it may not signal a full trend reversal without broader confirmation. The overall signal across all timeframes leans heavily towards 'SELL' (1 Buy, 7 Sell, 0 Neutral on 4H and 1D), underscoring the significant headwinds facing gold buyers. Therefore, any bullish move needs to be treated with caution and validated by strong technical and fundamental shifts.
Where Bears Take Control: The $3,957.11 Support Zone
The Bearish Scenario Unfolds
The prevailing technical signals across multiple timeframes suggest a bearish bias for XAUUSD. The 4-hour and daily charts both indicate a downtrend, with ADX readings of 27.34 and 38.11 respectively, confirming strong trend momentum to the downside. The immediate 1-hour support at $4,012.20 is the first line of defense for the bulls. A break below this level would open the door for a test of the more significant 4-hour support at $4,000.42. Should this psychological level falter, the bears would likely target the daily support zone beginning at $3,957.11. This area represents a crucial inflection point; a decisive break below $3,957.11 could trigger a cascade of selling, potentially leading to a rapid decline towards the subsequent support levels at $3,913.54 and $3,840.67.
On the indicators, the RSI(14) readings across all timeframes (45.48 on 1H, 38.77 on 4H, 39.22 on 1D) are below the 50 level and showing a downward trend, reinforcing the bearish sentiment. The MACD on the 4H and 1D charts is also below its signal line with negative momentum, further supporting the case for lower prices. The Stochastic oscillator on the 1H and 1D charts are showing bearish signals (%K
Confirmation and Targets
A confirmed bearish move would be marked by a daily close below the $3,957.11 support. This would invalidate any near-term bullish hopes and open up the lower targets. The subsequent support levels are $3,913.54 and $3,840.67. These levels represent significant historical price action and a break through them would signal a major trend shift. The 1-hour chart's general signal is 'SELL' (3 Buy, 5 Sell, 0 Neutral), but the conflicting signals from the MACD and Stochastic need careful monitoring. If the price consolidates around the current levels without a clear direction, it could lead to a period of sideways movement, but the underlying trend indicators on longer timeframes suggest that any upward fluctuations might be opportunities for sellers to re-enter the market at better prices.
The Waiting Game: Consolidation Around $4,000
Conditions for a Range-Bound Market
In the absence of a clear directional catalyst, XAUUSD could remain range-bound, oscillating between the key support and resistance levels identified. The immediate 1-hour resistance is pegged at $4,021.43, while the 1-hour support stands at $4,012.20. This tight range suggests indecision in the market. If price action remains confined within this narrow band, traders might look for opportunities to fade moves towards the edges of the range – selling near resistance and buying near support, provided risk management is strictly applied. The ADX indicator, particularly on the 1H chart at 43.08, indicates a strong trend is present, which contradicts a purely range-bound scenario. However, the conflicting signals from other indicators, like the RSI being neutral and MACD showing mixed momentum across different timeframes, could lead to a period where the trend fails to establish clear direction, resulting in choppy price action.
A neutral scenario would likely persist if key economic data releases fail to provide a clear direction or if geopolitical events remain on a low simmer. For example, if the upcoming US CPI data shows inflation cooling significantly, it might dampen inflation expectations and reduce the need for aggressive Fed tightening, potentially weakening the dollar and supporting gold, but if the data is mixed or the market has already priced it in, the price could simply react briefly before returning to its range. The Bollinger Bands on the 1H chart are currently above the middle band with an upward bias, but the Stochastic is showing a bearish signal, indicating potential for a short-term pullback within the range. For this neutral scenario to dominate, price would need to consistently fail to break either the immediate 1-hour support or resistance, leading to a period of consolidation before the next significant move.
Watching for the Breakout
The true 'waiting game' scenario is characterized by price action consolidating within a wider range, perhaps between the 4-hour support of $4,000.42 and the 4-hour resistance of $4,031.34. Within this broader neutral zone, scalpers and short-term traders might find opportunities, but the larger trend remains uncertain. The critical factor to watch is what breaks this consolidation. A decisive move above $4,031.34 could signal the start of a bullish trend, targeting higher resistance levels. Conversely, a breakdown below $4,000.42 would likely confirm the bearish outlook, leading towards the daily support at $3,957.11. The ADX on the daily chart at 38.11 suggests a strong trend is present, implying that this consolidation phase might be temporary, and a breakout is more likely than a prolonged period of range-bound trading. The market is essentially coiling, and traders should be prepared for a significant move once the breakout occurs.
The Most Likely Path Forward: A Bearish Lean
Considering the technical indicators across multiple timeframes, the most probable scenario for XAUUSD in the short to medium term leans bearish. The 4-hour and daily charts exhibit strong downtrend signals, with ADX readings consistently above 25, indicating significant trend strength. The RSI values on these longer timeframes are below 50 and trending downwards, suggesting a lack of buying pressure and potential for further price depreciation. While the 1-hour chart presents some conflicting positive signals, such as a positive MACD momentum and a 'BUY' general signal, these are often overshadowed by the dominant trends on the higher timeframes. The Stochastic on the 1H and 1D charts also aligns with the bearish outlook, showing %K below %D. The overwhelming 'SELL' signals on the 4H and 1D charts (7 out of 8 indicators) cannot be ignored. Therefore, the probability of a bearish move appears higher.
Probability Estimate: Bearish Scenario (65%), Neutral/Consolidation (25%), Bullish Scenario (10%).
This bearish bias is further supported by the current macro environment. The Dollar Index (DXY) is showing signs of strength on the daily chart (ADX 31.75), which historically exerts downward pressure on gold. While there's a minor pullback in the DXY currently, the underlying trend suggests potential for appreciation, especially if upcoming US economic data, such as the CPI report, proves to be robust, reinforcing expectations for Federal Reserve policy. Additionally, the surge in oil prices to $85.47, while typically bullish for gold due to inflation concerns, is currently being counteracted by the strengthening dollar and potentially hawkish Fed expectations. This complex interplay suggests that the inflationary hedge narrative for gold might be temporarily overshadowed by monetary policy factors.
What I'm Watching: Key Triggers for the Week
The immediate focus for traders will be the $4,012.20 support level on the 1-hour chart. A confirmed break below this level, particularly on increased volume, would be the first sign of bears taking charge. Following that, attention will shift to the $4,000.42 level on the 4-hour chart. A decisive breach of this psychological barrier would significantly increase the probability of the bearish scenario playing out, targeting the key daily support at $3,957.11.
On the bullish side, traders will be watching for a sustained hold above the $4,021.43 resistance, followed by a break above $4,027.14. Confirmation would require the daily RSI to move above 50 and the MACD to show a clear bullish crossover on the 4H chart. Geopolitical developments and any shifts in central bank rhetoric could act as catalysts. The upcoming US CPI data release is crucial; a significantly higher-than-expected number could bolster gold's safe-haven appeal, while a much cooler reading might strengthen the dollar and weigh on gold prices, reinforcing the bearish outlook.
Scenario Breakdown:
Bearish Scenario: The Slide Towards $3,957
65% ProbabilityNeutral Scenario: Range-Bound Indecision
25% ProbabilityBullish Scenario: Reclaiming the Highs
10% ProbabilityTechnical Outlook Summary
| Indicator | Value | Signal | Interpretation |
|---|---|---|---|
| RSI (14) | 45.48 | Neutral | Slight downward pressure, needs to break 50 for bullish confirmation. |
| MACD Histogram | +0.68 | Bullish Momentum | Positive on 1H, but negative on 4H/1D; requires higher timeframe confirmation. |
| Stochastic | K=69.25, D=82.56 | Bearish Crossover | Suggests potential for further downside on 1H chart. |
| ADX | 43.08 | Strong Trend | Indicates a strong trend is in play, currently favoring the downside on 1H. |
| Bollinger | Middle Band Break | Watch | Price is above the middle band on 1H, but below on 4H/1D, indicating mixed signals. |
Frequently Asked Questions: XAUUSD Analysis
What happens if XAUUSD breaks below the $4,000 support level?
A decisive break below $4,000.42 would likely trigger further downside, with the next key target being the daily support at $3,957.11. This would confirm the bearish trend indicated by longer-term technicals.
Should I buy XAUUSD at current levels near $4,021.54 given the mixed signals?
Buying at current levels carries significant risk due to conflicting signals and bearish trends on higher timeframes. A more prudent approach would be to wait for confirmation of a bullish reversal, such as a close above $4,073.55, or a confirmed break below $4,000.42 to join the prevailing trend.
Is the RSI at 45.48 a sell signal for XAUUSD right now?
An RSI of 45.48 on the 1-hour chart is in the neutral zone but shows a slight downward bias. It's not a direct sell signal on its own but supports the bearish case by indicating a lack of strong buying momentum.
How will the upcoming US CPI data affect XAUUSD this week?
Higher-than-expected CPI could boost gold's inflation hedge appeal, while lower-than-expected data might strengthen the dollar and pressure gold. The market's reaction will depend on how the data influences Fed rate hike expectations.
Track markets in real-time
AI-powered analysis, technical indicators and real-time price data.
Join Our Telegram Channel
Breaking market news, AI analysis and trading signals instantly.
Join Channel