

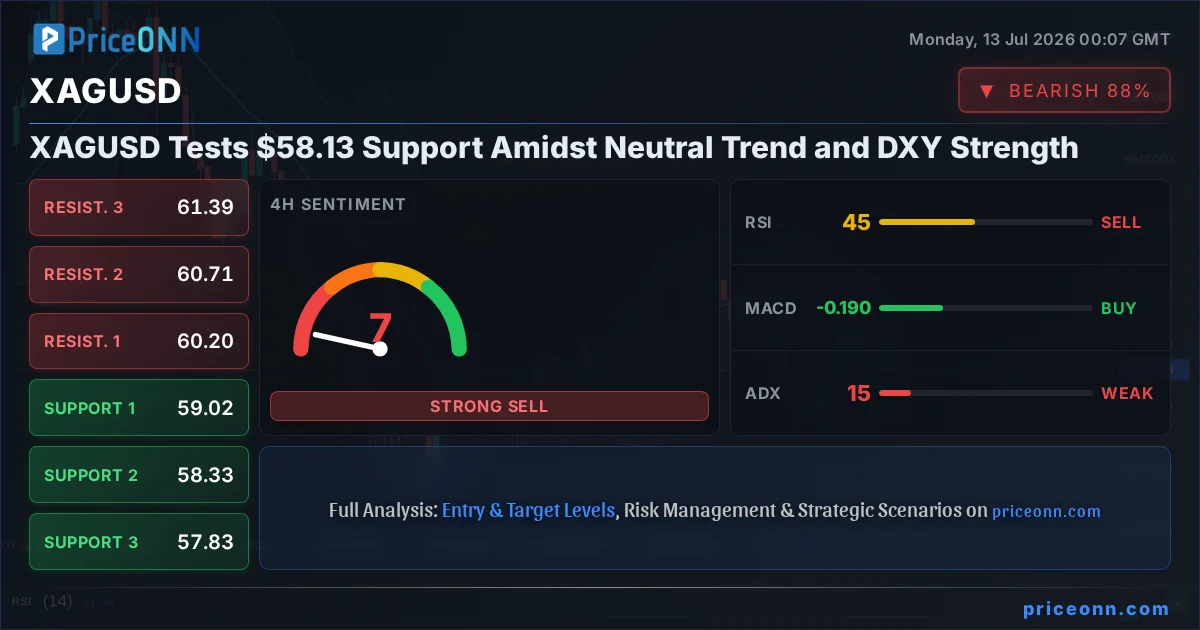
The financial markets are currently navigating a complex landscape, with geopolitical tensions simmering and central banks carefully calibrating their monetary policies. In this environment, understanding the interplay between major indices, currency strength, and commodity prices is paramount for any serious trader. Today, our focus sharpens on silver (XAGUSD), currently hovering around the $59.07 mark, as it approaches a significant support level at $58.13. This price action is occurring against a backdrop of a strengthening US Dollar Index (DXY) and a generally neutral trend across multiple timeframes, presenting a nuanced picture for market participants.
- Silver (XAGUSD) is testing the crucial support level at $58.13, with the current price at $59.07.
- The US Dollar Index (DXY) is showing strength, currently at 101.1, which typically exerts downward pressure on precious metals like silver.
- Technical indicators across 1H, 4H, and 1D timeframes largely suggest a bearish bias for XAGUSD, with a strong sell signal on the 1-hour chart.
- The ADX indicator shows a moderate to strong downtrend on shorter timeframes (1H: 21.66, 4H: 15.07, 1D: 39.45), indicating prevailing downward momentum.
- Market sentiment is cautious, with traders closely watching upcoming economic data releases for confirmation of inflation trends and potential shifts in central bank policy.
Macroeconomic Currents Shaping Silver's Path
The recent economic calendar has been a focal point, with investors scrutinizing data for clues about inflation and economic growth. Last week's reports, while delivering a mixed bag, have set the stage for continued market volatility. The anticipation surrounding upcoming inflation data, particularly CPI readings, is palpable. A cooler-than-expected CPI could embolden central banks to signal a pause or even a pivot in their tightening cycles, which would typically support risk assets and potentially weigh on the dollar. Conversely, persistent inflation would likely reinforce a hawkish stance, keeping upward pressure on yields and the dollar, thereby creating headwinds for silver. The Bank of Canada's anticipated hold on rates, as widely expected, suggests a cautious approach to monetary policy across major economies, prioritizing stability amidst lingering inflation concerns.
Geopolitical developments continue to add layers of complexity. The ongoing tensions in the Middle East, particularly concerning oil supply routes and potential escalations, inject an element of risk premium into energy markets. While Brent crude prices have seen a notable surge, XAGUSD's correlation with oil is not always direct and can be influenced by broader risk sentiment. The escalation of energy concerns, as highlighted by Kazakhstan's extension of its petroleum export ban and the escalating energy war in California, underscores the fragility of global energy supplies. This can indirectly influence inflation expectations, which in turn affects monetary policy and, consequently, precious metal prices. Traders are keenly observing how these energy market dynamics translate into broader inflation figures and central bank reactions.
The Dollar's Grip: DXY's Influence on XAGUSD
The US Dollar Index (DXY) currently trading at 101.1 is a critical factor influencing the price of silver. A strengthening dollar generally makes dollar-denominated commodities, like silver, more expensive for holders of other currencies, thus dampening demand. The DXY's recent upward movement, supported by robust economic data and a hawkish outlook from the Federal Reserve, has been a significant headwind for precious metals. This inverse correlation is a well-established market dynamic. If the DXY continues its ascent, pushing past key resistance levels, it will likely exert further downward pressure on XAGUSD. Conversely, any signs of dollar weakness, perhaps triggered by softer US inflation data or a dovish shift in Fed commentary, could provide a much-needed reprieve for silver prices. The interplay between Fed policy expectations, reflected in Fed Fund Futures and OIS pricing, and the DXY's trajectory remains a central theme for traders.
The market is constantly assessing the Federal Reserve's stance. While recent data might suggest a cooling inflation trend, the Fed's mandate to achieve price stability means they will likely remain vigilant. Any indication that inflation remains 'stubborn,' as some reports suggest, will reinforce the Fed's commitment to higher-for-longer interest rates. This scenario would typically support the dollar and weigh on non-yielding assets like gold and silver. On the flip side, if upcoming economic indicators strongly point towards a significant disinflationary trend, the market might begin pricing in earlier rate cuts, which could weaken the dollar and offer a bullish catalyst for XAGUSD. The current neutral trend in DXY on the 1-hour and 4-hour charts, despite a strong daily uptrend, suggests a period of consolidation before its next major move, adding to the uncertainty for silver.
Technical Scrutiny: Decoding XAGUSD's Chart Patterns
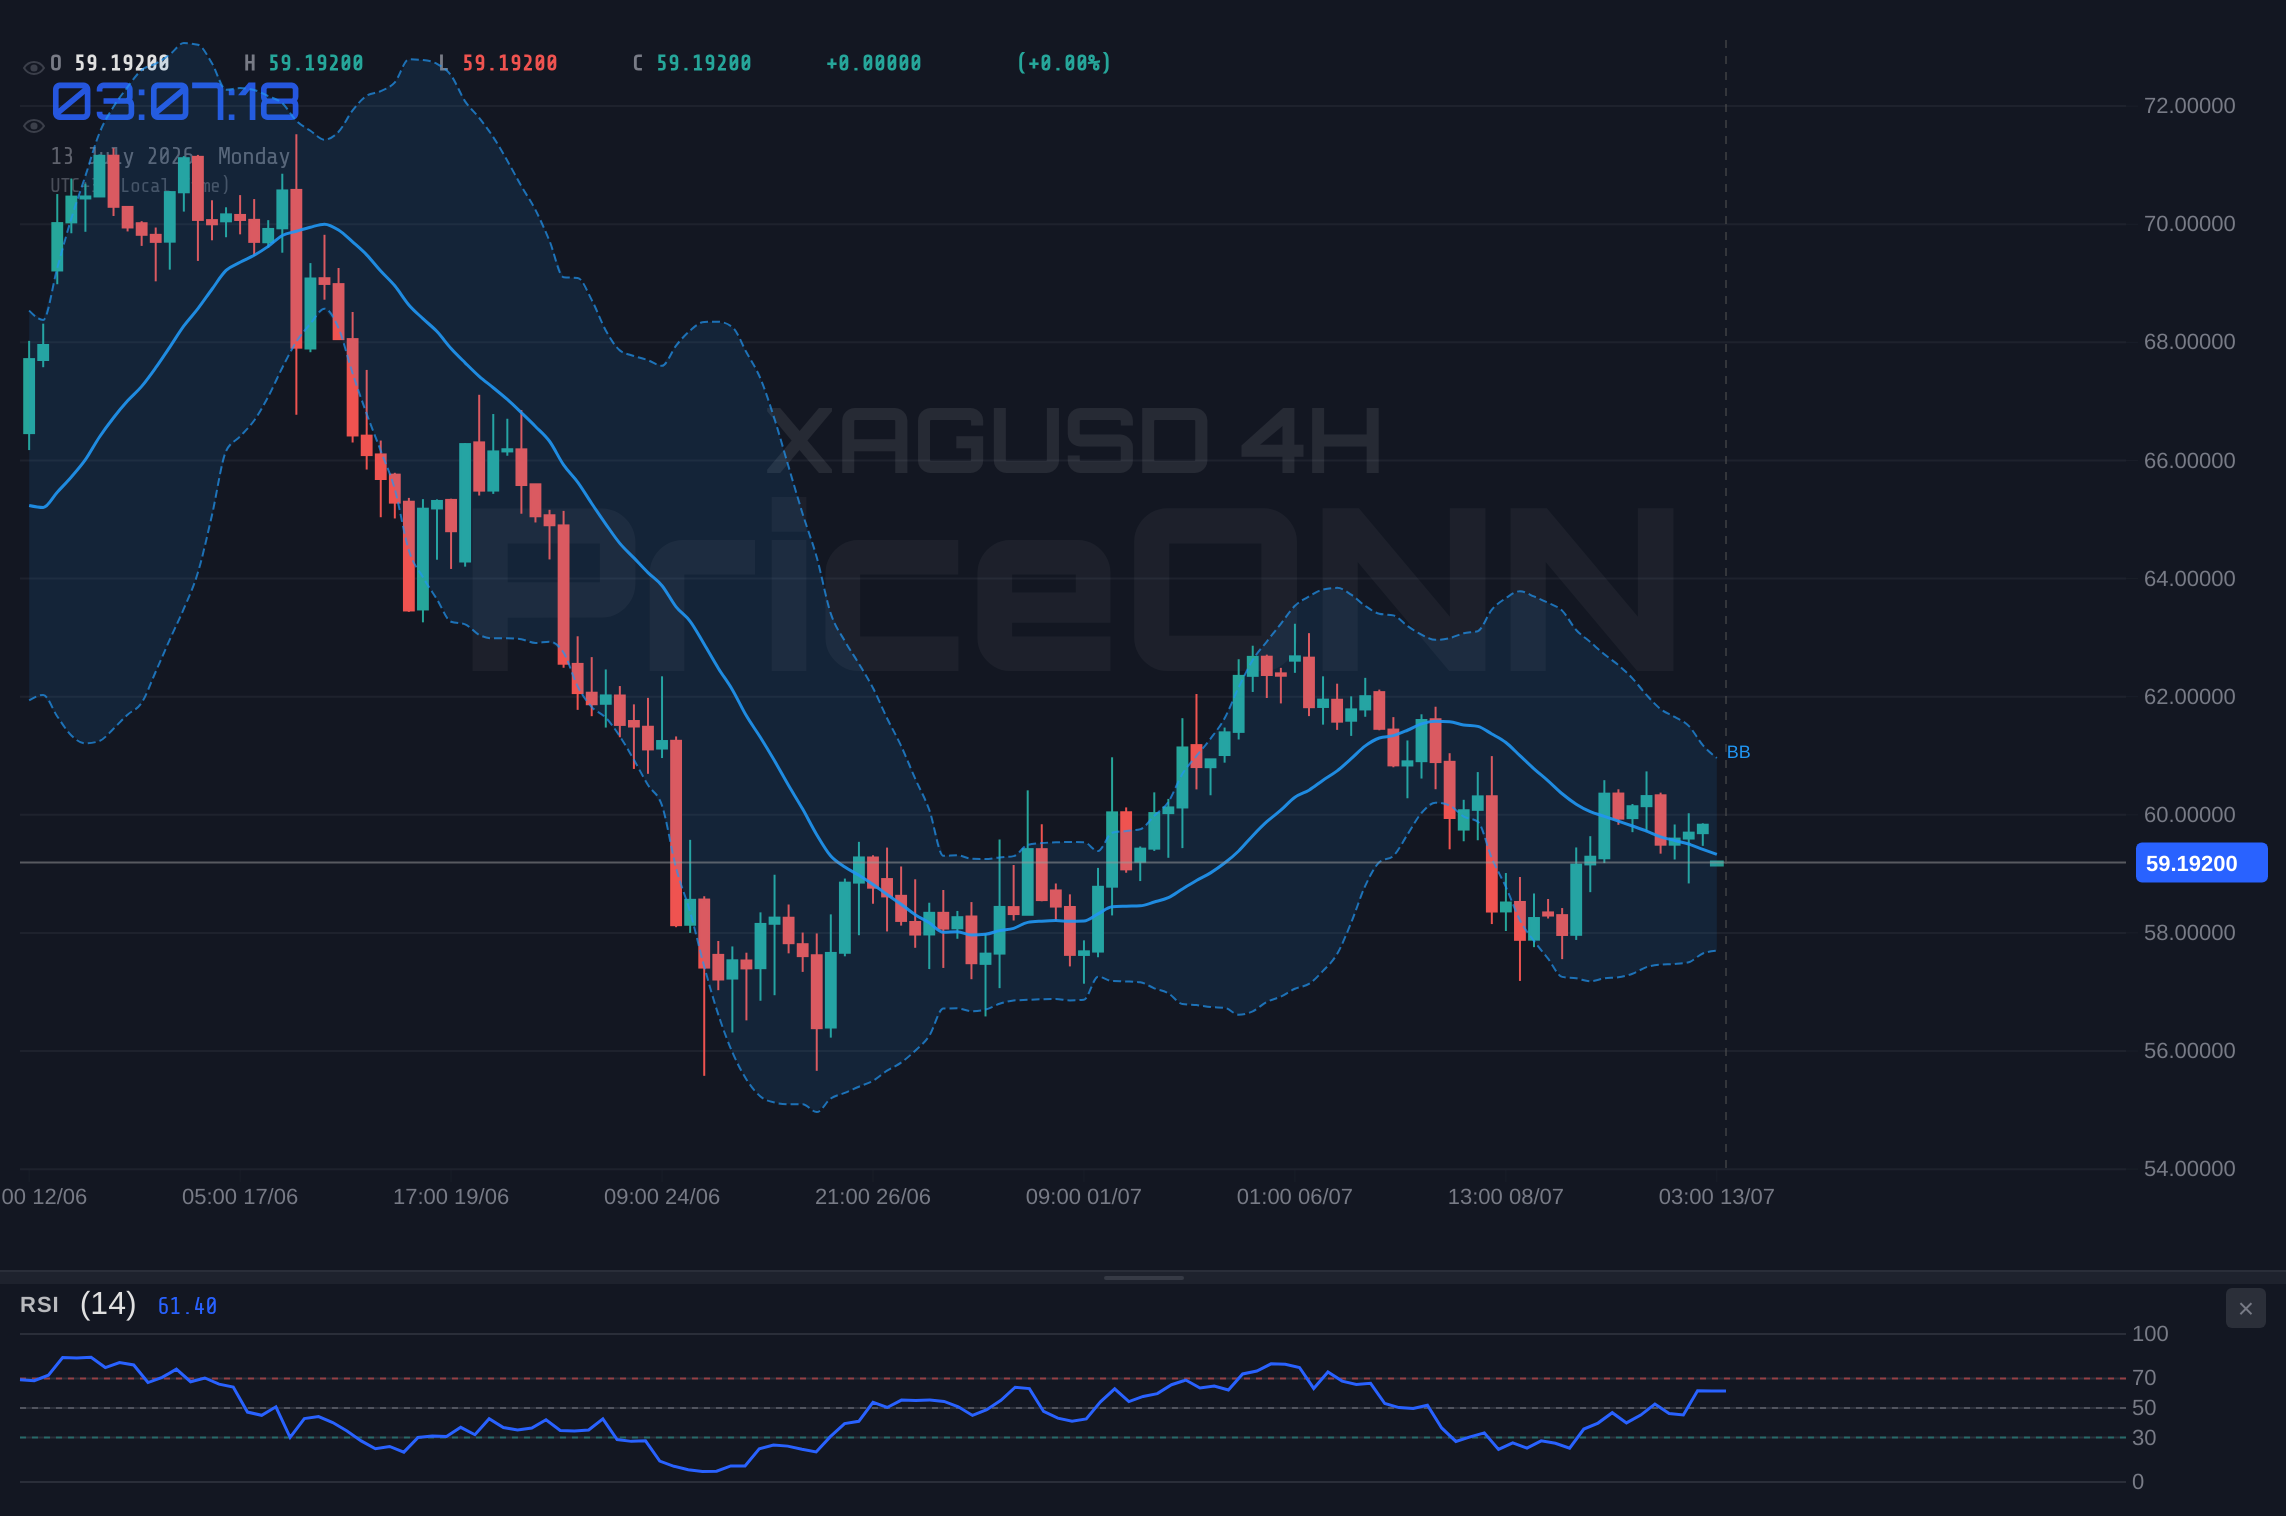
Turning our attention to the technicals, XAGUSD presents a compelling, albeit cautious, picture. On the 1-hour chart, the trend is described as neutral with a strong bearish bias, a sentiment echoed by a 1H General Signal of 'SELL' (0 Buy, 8 Sell, 0 Neutral). The RSI(14) at 41.61 is in neutral territory but trending downwards, indicating a lack of bullish momentum. MACD shows negative momentum with the MACD line below the signal line, and Bollinger Bands are trading below the middle band, all pointing towards potential downside. The Stochastic oscillator confirms this, with %K below %D, signaling a bearish move. The ADX at 20.15 suggests a moderately strong downtrend is in play on this shorter timeframe, an important clue for intraday traders.
The 4-hour timeframe offers a similar, though slightly less definitive, outlook. The trend is also neutral, but the ADX at 14.81 indicates a weaker trend, suggesting a more range-bound environment. However, the RSI at 44.7 still points to a downward inclination, and MACD continues to show negative momentum. Bollinger Bands remain below the middle band. The Stochastic oscillator again favors a bearish outlook with %K below %D. The overall signal is 'SELL' (0 Buy, 8 Sell, 0 Neutral), reinforcing the bearish sentiment on this timeframe. This consistent bearish signal across shorter timeframes is a critical piece of information for traders looking to time their entries or exits, suggesting that any upward retracements might be short-lived.
The daily chart, however, introduces a slight divergence. While the overall trend is still neutral, the ADX at 37.3 indicates a strong downtrend, which is a significant indicator of prevailing market direction. The RSI at 42.28 continues to show a downward trend, and Bollinger Bands are below the middle band. However, the MACD shows positive momentum with the MACD line above the signal line, and the General Signal is 'BUY' (1 Buy, 7 Sell, 0 Neutral). This mixed signal on the daily chart highlights a potential conflict between shorter-term bearish momentum and a lingering, albeit weak, daily bullish divergence or consolidation pattern. This is where careful risk management becomes crucial – identifying the dominant trend and the conditions under which it might change.
Navigating the Support and Resistance Landscape
Currently, XAGUSD is trading at $59.07. The immediate support level to watch is $58.13 on the 1-hour chart, followed by $57.97 and $57.47. A decisive break below $58.13 could signal further downside, potentially targeting the 4-hour support at $57.97 and then $57.47. On the resistance side, the immediate hurdle is found at $59.20 on the 1-hour chart, followed by $59.70 and $60.07. A sustained move above these levels, particularly a close above $59.20, would be needed to challenge the prevailing bearish sentiment. The daily support levels are further down, at $58.13, $57.50, and $57.03, indicating that the current price action is indeed probing a key area.
The confluence of technical signals from multiple timeframes paints a picture of cautious bearishness. While the daily chart offers a glimmer of potential stabilization, the overwhelming bearish sentiment on the 1-hour and 4-hour charts cannot be ignored. The ADX readings, particularly the strong 37.3 on the daily chart, suggest that the downtrend has considerable force behind it. For traders, this means that while the $58.13 support level is critical, the path of least resistance appears to be to the downside until clear bullish confirmation emerges. The recent news regarding gold prices slipping as Trump commented on Iran ceasefire also adds to the cautious sentiment in precious metals, potentially spilling over to silver. This reinforces the idea that geopolitical stability, or instability, plays a significant role in silver's price action.
The Path Forward: What to Watch for in XAGUSD
Looking ahead, the economic calendar remains the primary driver for silver's next significant move. Key inflation reports, such as the upcoming CPI figures, will be closely watched. A significant deviation from expectations could trigger a strong reaction in the US Dollar Index (DXY) and, consequently, in XAGUSD. If inflation proves stickier than anticipated, the Fed's hawkish stance will likely remain firm, supporting the dollar and pressuring silver towards the $58.13 support and potentially lower. Conversely, a sharp drop in inflation could lead to a dollar sell-off, providing a much-needed boost to silver prices, potentially allowing it to reclaim higher ground above $59.20 and target $60.07.
The technical picture, particularly the bearish signals on shorter timeframes and the strong ADX on the daily chart, suggests that traders should remain vigilant for potential downside continuation. A confirmed break below the $58.13 support level would significantly increase the probability of further declines, possibly targeting the next key support at $57.97. However, if silver manages to hold above $58.13 and show signs of stabilization, perhaps accompanied by a weakening DXY and positive shifts in MACD on shorter timeframes, it could set the stage for a potential reversal. The confluence of factors - macroeconomic data, central bank rhetoric, dollar strength, and technical levels - will ultimately dictate silver's trajectory in the coming days and weeks. Patience and disciplined risk management are key as the market digests these competing forces.
Frequently Asked Questions: XAGUSD Analysis
What happens if XAGUSD breaks below the $58.13 support level?
A break below $58.13 on XAGUSD would likely confirm the bearish sentiment indicated by shorter-term technicals. This could trigger further selling pressure, potentially targeting the next support at $57.97, especially if the DXY continues to strengthen and inflation data remains elevated.
Is the current RSI level of 41.61 a sell signal for XAGUSD at $59.07?
While an RSI of 41.61 is in neutral territory, its downward trend on the 1-hour chart suggests weakening momentum. Combined with other bearish indicators like MACD and Stochastic, it reinforces the cautious outlook. However, it's not an immediate sell signal on its own and requires confirmation from price action and other indicators.
How will the upcoming CPI data impact XAGUSD if it comes in hotter than expected?
If CPI data comes in hotter than expected, it would likely reinforce a hawkish Fed stance, supporting the US Dollar Index (DXY) and creating headwinds for XAGUSD. This scenario could push silver prices below the $58.13 support level as risk aversion increases.
Should traders consider buying XAGUSD if it holds $58.13 support, given the neutral trend?
While holding $58.13 could offer a short-term bounce, the prevailing bearish signals on shorter timeframes and the strong daily ADX suggest caution. A confirmed hold of support, coupled with a significant shift in DXY or a dovish surprise in economic data, would be needed to consider a long position with defined risk below $58.13.
Bearish Scenario: Downside Continuation
65% ProbabilityNeutral Scenario: Consolidation Around Support
25% ProbabilityBullish Scenario: Reversal Attempt
10% ProbabilityTechnical Outlook Summary
| Indicator | Value | Signal | Interpretation |
|---|---|---|---|
| RSI (14) | 41.61 | Bearish | Neutral, trending down - lack of bullish momentum. |
| MACD | Negative | Bearish | Negative momentum, below signal line. |
| Stochastic | K=47.89, D=67.61 | Bearish | %K |
| ADX | 20.15 | Bullish (Trend Strength) | Moderately strong downtrend. |
| Bollinger | Middle Band | Bearish | Price below middle band, favoring downside. |
Key Levels
Support Levels
Resistance Levels
Track markets in real-time
AI-powered analysis, technical indicators and real-time price data.
Join Our Telegram Channel
Breaking market news, AI analysis and trading signals instantly.
Join Channel