

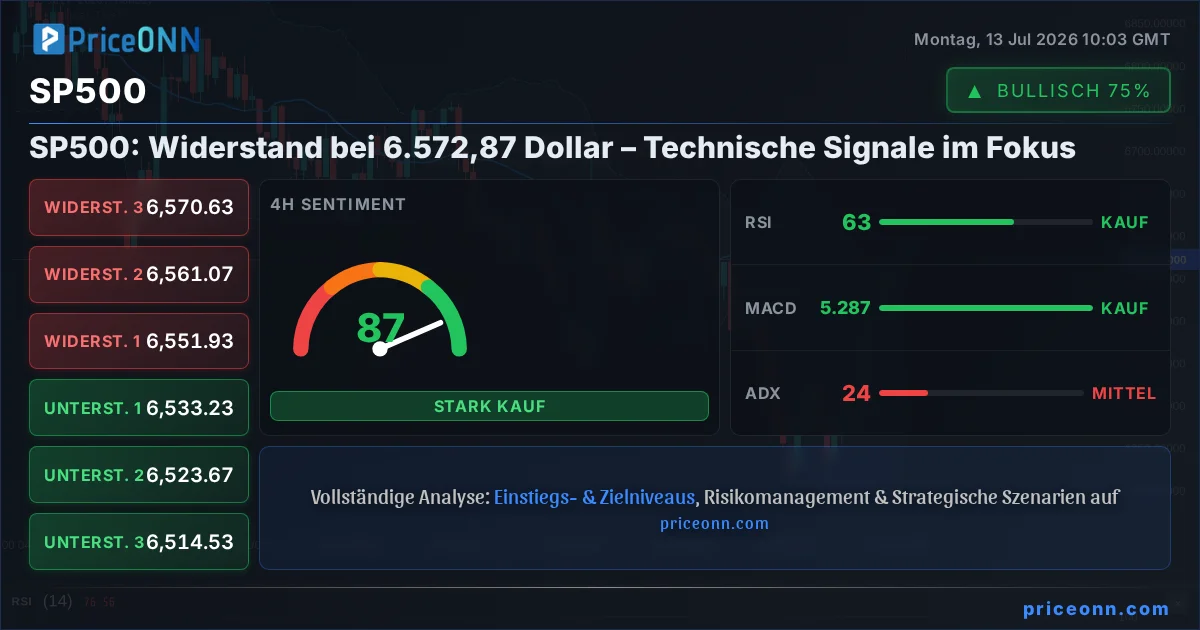
Der S&P 500 befindet sich an einem kritischen Punkt und handelt exakt bei 6.572,87 Dollar. Marktteilnehmer wägen die jüngsten technischen Signale gegen eine Kulisse schwankender globaler Stimmungen ab. Dieser entscheidende Preispunkt stellt einen signifikanten Widerstandsbereich dar, an dem in der Vergangenheit Verkaufsdruck aufkam, aber auch ein Niveau, das bei einem entschlossenen Durchbruch weitere Aufwärtsdynamik entfachen könnte. Das Verständnis des Zusammenspiels von Indikatoren und Preisverhalten auf diesem Niveau ist für Trader, die sich im aktuellen Marktumfeld effektiv positionieren wollen, von größter Bedeutung. Die jüngste Volatilität, angetrieben durch eine komplexe Mischung aus geopolitischen Spannungen und sich ändernden Wirtschaftserwartungen, hat eine herausfordernde, aber chancenreiche Landschaft für Investoren geschaffen. Die sp500 technische Analyse heute zeigt, dass Vorsicht geboten ist.
- Der RSI liegt auf dem 1-Stunden-Chart bei 70,95 und signalisiert überkaufte Bedingungen, was auf eine mögliche kurzfristige Korrektur des SP500 hindeutet.
- Der entscheidende Widerstand liegt bei 6.577,27 Dollar, einem Niveau, das frühere Aufwärtsbewegungen begrenzt hat und erhebliche Kaufkraft zur Überwindung benötigt.
- Das MACD-Histogramm zeigt auf dem 1-Stunden-Chart eine potenzielle bärische Divergenz, was darauf hindeutet, dass die bullische Dynamik nachlässt.
- Die Korrelation mit dem erstarkenden Dollar-Index (DXY), der aktuell bei 100,91 liegt, sorgt für zusätzliche Vorsicht und könnte risikoreiche Anlagen wie den S&P 500 unter Druck setzen.
Die allgemeine Marktstimmung bleibt ein Schlüsselfaktor für die Entwicklung des S&P 500. Mit dem Dollar-Index (DXY) bei 100,91 kann ein starker Dollar oft als Gegenwind für risikoreichere Anlagen, einschließlich Aktien, wirken. Diese inverse Korrelation bedeutet, dass jede anhaltende Aufwärtsbewegung des Dollars zu erhöhtem Verkaufsdruck auf den S&P 500 führen könnte, insbesondere wenn er signifikante Widerstandsniveaus erreicht. Trader beobachten die Interaktion des DXY mit seinen eigenen technischen Niveaus genau, um dessen potenzielle Auswirkungen auf den Gesamtmarkt einzuschätzen. Die aktuelle Preisentwicklung deutet auf ein empfindliches Gleichgewicht hin, bei dem die globale Risikobereitschaft getestet wird und jede Verschiebung die kurzfristige Aussicht für US-Aktien dramatisch verändern könnte.
Eine genauere Betrachtung der technischen Indikatoren auf dem 1-Stunden-Chart zeigt ein gemischtes Bild, das jedoch eher zur Vorsicht mahnt. Der Relative Strength Index (RSI) bei 70,95 befindet sich fest im überkauften Bereich, eine Lesart, die historisch einer Abkühlungsphase oder einem kurzfristigen Rücksetzer vorausgeht. Obwohl dies kein unmittelbares Verkaufssignal ist, deutet es darauf hin, dass die jüngste Aufwärtsdynamik nachlässt und die Käufer möglicherweise erschöpft sind. Dies wird durch den Stochastik-Oszillator weiter untermauert, bei dem die %K-Linie (65,73) die %D-Linie (73,50) gekreuzt hat, was ebenfalls auf eine mögliche kurzfristige Verschiebung der Dynamik von bullisch zu bärisch hindeutet. Diese Indikatoren zusammen legen nahe, dass der Weg des geringsten Widerstands eine Konsolidierung oder eine leichte Korrektur sein könnte, bevor ein signifikanter neuer Aufwärtsimpuls etabliert werden kann.
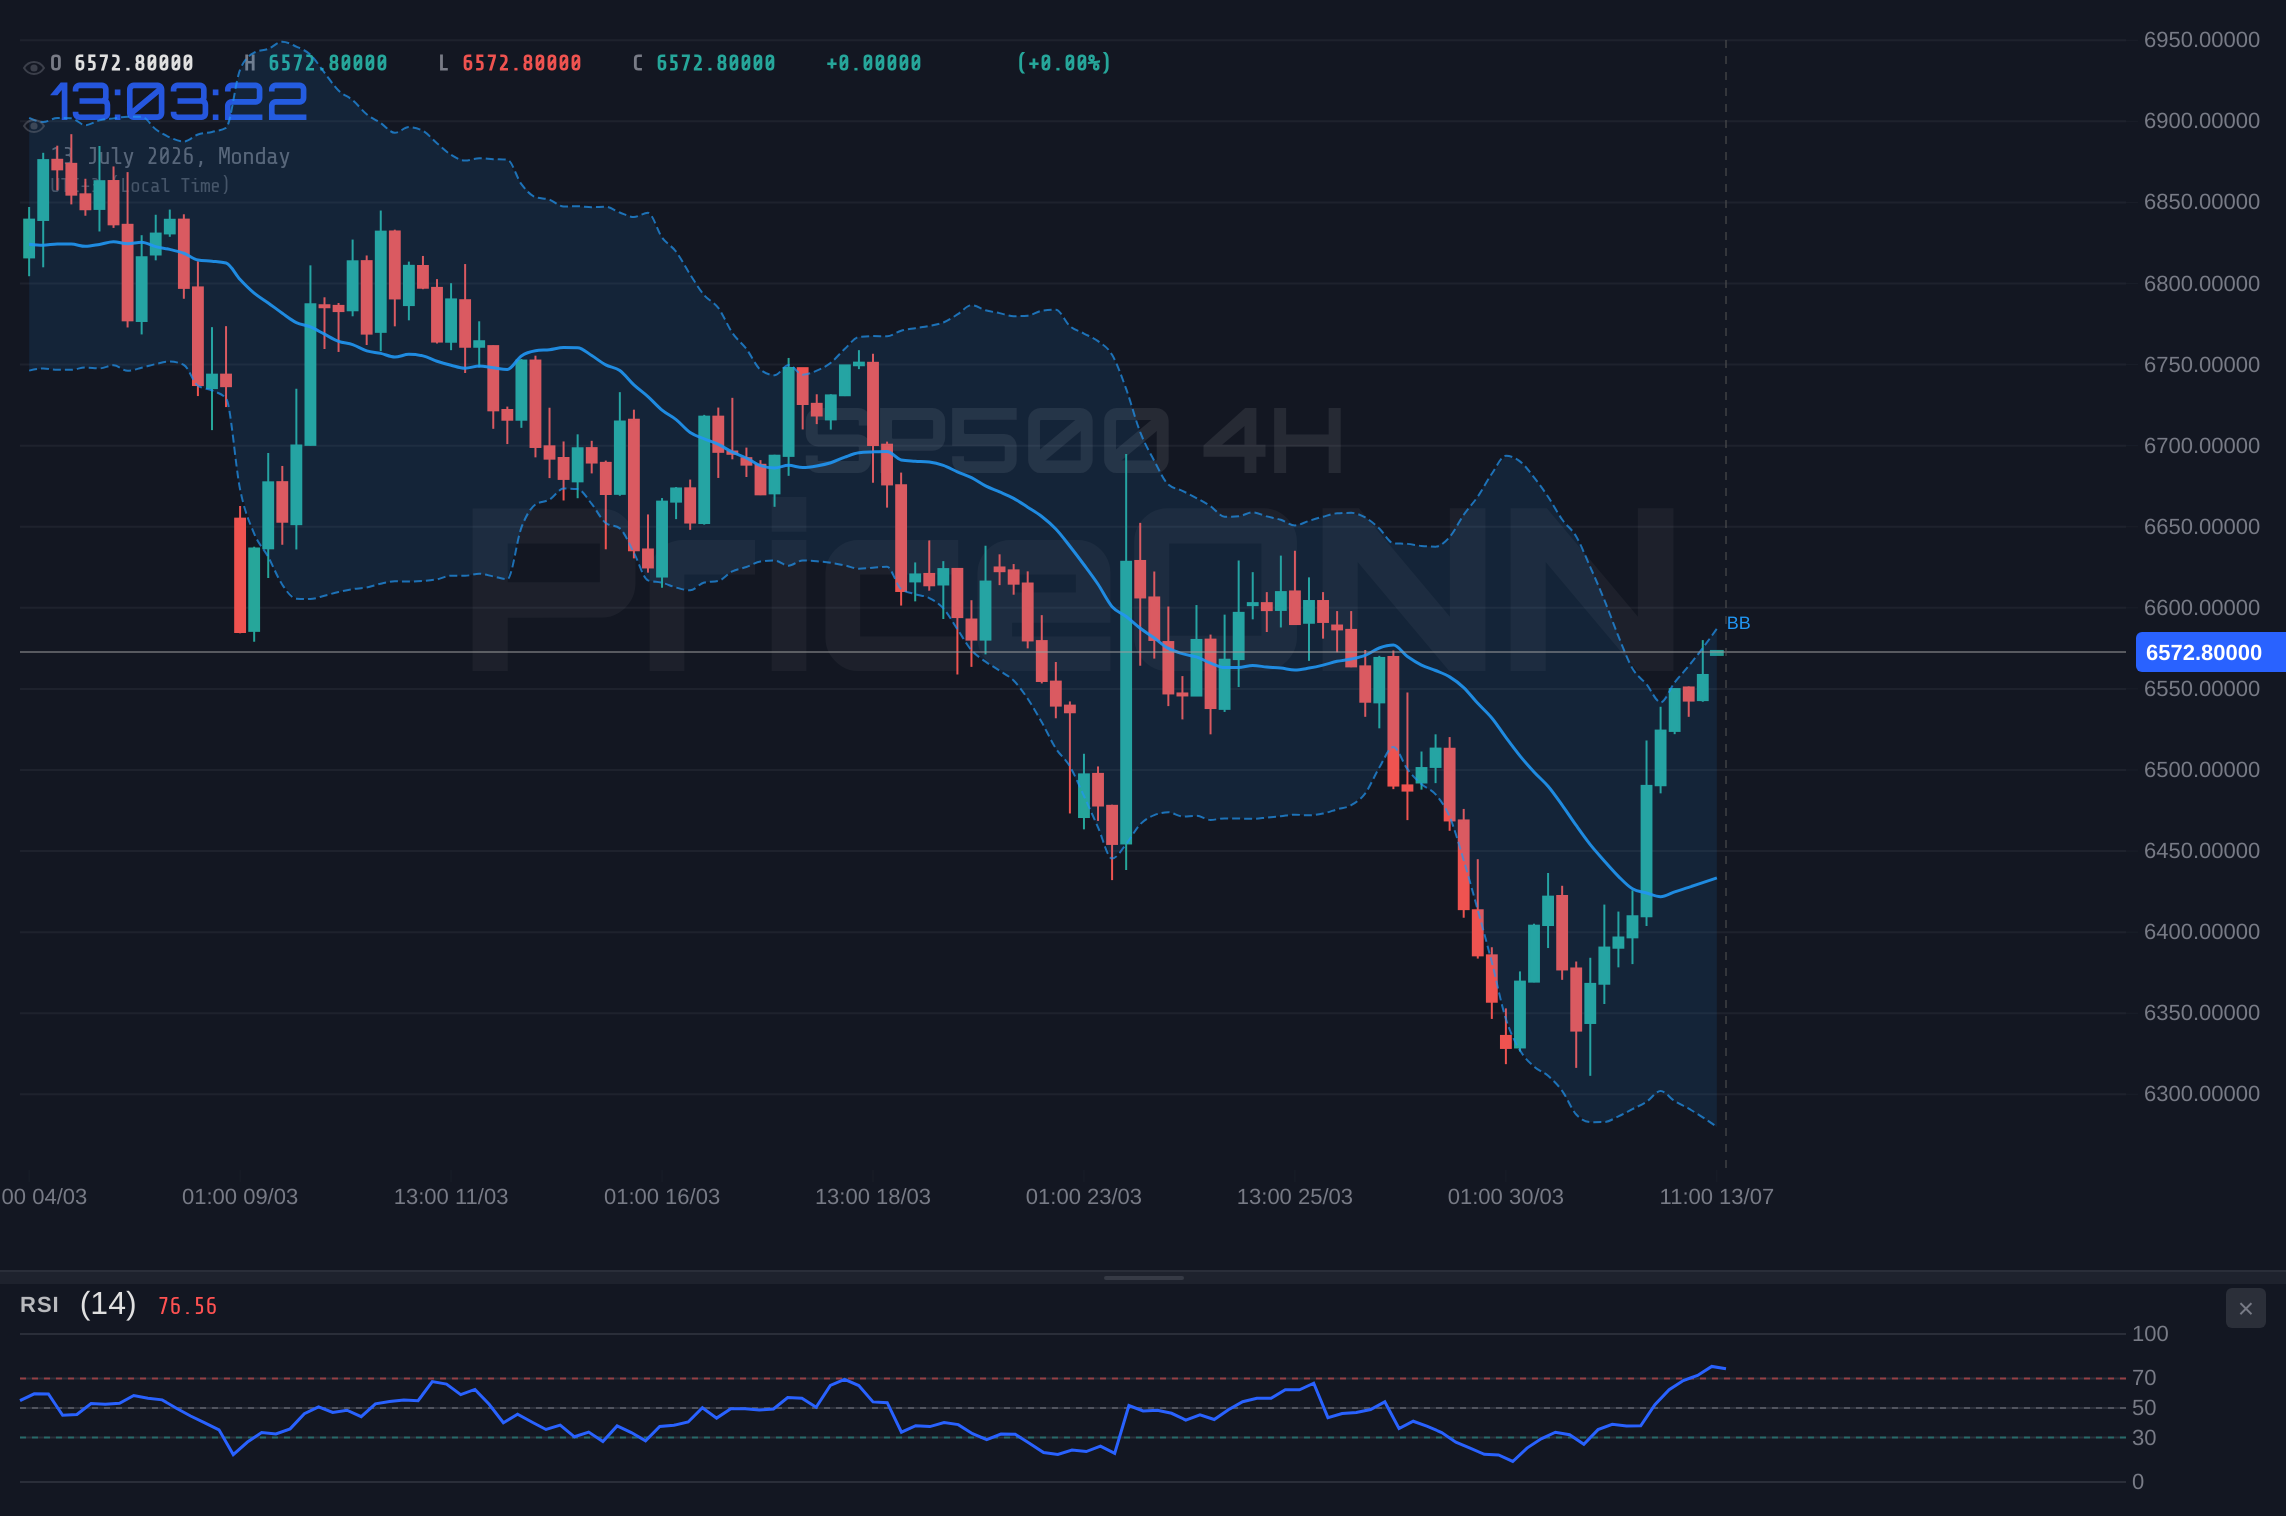
Die Konvergenz eines überkauften RSI (70,95) und eines bärischen Stochastik-Kreuzes auf dem 1-Stunden-Chart für den S&P 500 bei 6.572,87 Dollar erfordert Vorsicht. Obwohl der übergeordnete Trend möglicherweise weiterhin aufwärts gerichtet ist, wird eine kurzfristige Korrektur immer wahrscheinlicher. Aggressive Long-Positionen sollten mit engeren Stop-Loss-Orders abgesichert werden.
Die Moving Average Convergence Divergence (MACD) auf dem 1-Stunden-Zeitrahmen erfordert ebenfalls Aufmerksamkeit. Derzeit zeigt das MACD-Histogramm eine negative Dynamik, wobei die MACD-Linie unter ihrer Signallinie liegt. Diese Konfiguration signalisiert typischerweise eine Abschwächung des Aufwärtstrends und kann einem bärischen Kreuzen vorausgehen. Obwohl der MACD noch nicht bärisch gekreuzt hat, deuten die negativen Histogrammbalken darauf hin, dass Verkäufer beginnen, Fuß zu fassen. Dies stimmt mit den Signalen von RSI und Stochastik überein und verstärkt die Vorstellung, dass der unmittelbare Impuls eher eine Pause oder Umkehr als eine Fortsetzung der Rallye sein könnte. Die Stärke des Trends, angezeigt durch den ADX bei 49,72, ist unbestreitbar stark, aber solch hohe ADX-Werte können auch scharfen Umkehrungen vorausgehen, sobald sich die Dynamik verschiebt.
Auf dem 4-Stunden-Chart bieten die technischen Indikatoren des S&P 500 ein etwas konstruktiveres, wenn auch immer noch vorsichtiges Bild. Der RSI liegt bei 62,83, was gut im neutralen Bereich liegt und auf eine anhaltende bullische Stimmung hindeutet, ohne übermäßig überkauft zu sein. Dies deutet darauf hin, dass der längerfristige Aufwärtstrend noch Raum hat. Der MACD-Indikator ist hier positiv, mit der MACD-Linie über ihrer Signallinie, was die zugrundeliegende bullische Dynamik unterstützt. Der Stochastik-Oszillator präsentiert jedoch ein anderes Bild. Mit %K bei 97,85 und %D bei 86,96 ist er tief im überkauften Bereich, was darauf hindeutet, dass der Preis möglicherweise überdehnt ist und eine Korrektur ansteht. Diese Divergenz zwischen MACD und Stochastik auf dem 4-Stunden-Chart unterstreicht die widersprüchlichen Signale, mit denen Trader konfrontiert sind, und betont die Notwendigkeit eines sorgfältigen Risikomanagements.
Der Tages-Chart zeichnet ein anderes Narrativ, das eher auf eine bärische Aussicht hindeutet, was die kurzfristigen Handelsentscheidungen weiter verkompliziert. Der RSI bei 45,35 liegt unter 50, was auf eine bärische Tendenz hindeutet und darauf schließen lässt, dass Verkäufer auf lange Sicht mehr Kontrolle haben. Der MACD auf dem Tages-Chart ist ebenfalls negativ, mit der MACD-Linie unter ihrer Signallinie, was diese bärische Stimmung verstärkt. Darüber hinaus zeigen die Bollinger-Bänder, dass der Preis unterhalb des mittleren Bandes gehandelt wird, was historisch auf einen bärischen Trend hindeutet. Der ADX-Wert von 47,51 auf dem Tages-Chart signalisiert einen starken bärischen Trend, was den neutraleren bis bullischen Signalen auf kürzeren Zeitrahmen widerspricht. Diese Divergenz zwischen den Zeitrahmen ist entscheidend; während kurzfristige Charts auf Erholungen hindeuten könnten, deutet der längerfristige Trend auf zugrundeliegende Schwäche hin.
Navigieren der Widerstandszone: 6.577,27 Dollar im Fokus
Die unmittelbare Preisaktion für den S&P 500 konzentriert sich um die Marke von 6.572,87 Dollar, mit einem wichtigen Widerstand bei 6.577,27 Dollar auf dem 1-Stunden-Chart. Dieses Niveau stellt eine signifikante Hürde dar. Ein entschlossener Schlusskurs über 6.577,27 Dollar wäre ein bullisches Signal und könnte die Tür für eine Bewegung zum nächsten Widerstandsniveau bei 6.589,83 Dollar öffnen. Die Nähe des überkauften RSI und die widersprüchlichen Signale anderer Oszillatoren auf den kürzeren Zeitrahmen deuten jedoch darauf hin, dass ein Durchbrechen dieses Niveaus erhebliche Kaufkraft erfordern wird. Verkäufer werden in dieser Zone wahrscheinlich aktiv sein, um weitere Aufwärtsbewegungen zu begrenzen und möglicherweise eine Korrektur auszulösen.
Unterhalb des aktuellen Preises liegen Unterstützungsniveaus bei 6.568,73 Dollar auf dem 1-Stunden-Chart, gefolgt von 6.547,63 Dollar und dann 6.535,07 Dollar. Ein Bruch unter 6.568,73 Dollar könnte eine kurzfristige Umkehr signalisieren, wobei Trader 6.547,63 Dollar als nächste potenzielle Haltezone betrachten würden. Wenn diese Unterstützung versagt, wird das Niveau von 6.535,07 Dollar kritisch. Eine anhaltende Bewegung unter diesen Niveaus würde wahrscheinlich durch die auf dem Tages-Chart beobachtete bärische Stimmung verstärkt und könnte zu einem signifikanteren Rückgang führen. Das Zusammenspiel zwischen diesen Unterstützungs- und Widerstandsniveaus, gepaart mit den gemischten Indikatorsignalen, schafft ein Szenario, das reich an Volatilität ist und eine strikte Einhaltung von Risikomanagementprinzipien erfordert.
Die allgemeine Marktstimmung, beeinflusst durch geopolitische Entwicklungen und makroökonomische Daten, spielt eine entscheidende Rolle. Erneute Spannungen im Nahen Osten, wie von verschiedenen Quellen berichtet, haben oft zu einer erhöhten Nachfrage nach sicheren Häfen und einer risikoscheuen Haltung an den Aktienmärkten geführt. Während die Ölpreise aufgrund dieser Eskalationen gestiegen sind, kann dies auch Inflationssorgen schüren, was wiederum die Erwartungen an die Geldpolitik der Zentralbanken beeinflussen könnte. Wenn Inflationsängste zunehmen, könnte dies zu einer restriktiveren Haltung der Zentralbanken führen, was die Aussichten für Aktien dämpfen könnte. Dieses komplexe Netz miteinander verbundener Faktoren bedeutet, dass die reine Preisaktion möglicherweise nicht die ganze Geschichte erzählt; das Verständnis des Makroumfelds ist ebenso wichtig.
Geopolitische Spannungen, insbesondere die Eskalationen zwischen den USA und dem Iran, treiben derzeit die Ölpreise in die Höhe. Dies schafft zusammen mit dem aktuellen Niveau des DXY bei 100,91 ein komplexes Umfeld für den S&P 500. Steigende Ölpreise können auf Inflation hindeuten, was die Erwartungen an die Fed-Politik und die Risikobereitschaft beeinflussen könnte.
Angesichts der widersprüchlichen Signale über verschiedene Zeitrahmen hinweg erscheint ein neutrales Szenario oder zumindest eine Konsolidierungsphase kurzfristig plausibel. Der S&P 500 könnte Schwierigkeiten haben, den Widerstand von 6.577,27 Dollar ohne eine klarere Richtung durch makroökonomische Daten oder eine signifikante Verschiebung des geopolitischen Risikos entscheidend zu durchbrechen. Sollten diese Katalysatoren ausbleiben, könnte der Index innerhalb einer Spanne handeln und sowohl seine unmittelbaren Unterstützungs- als auch Widerstandsniveaus testen. Diese unruhige Preisentwicklung ist typisch, wenn Märkte gemischte Signale verdauen und auf einen eindeutigeren Katalysator warten. Die ADX-Werte über die Zeitrahmen hinweg spiegeln diese Mehrdeutigkeit ebenfalls wider, mit starken Trendindikatoren auf dem Tages-Chart, aber schwächeren auf kürzeren Zeitrahmen, was auf mangelnde klare Entschlossenheit der Marktteilnehmer hindeutet.
Die Divergenz zwischen den bullischen Signalen auf kürzeren Zeitrahmen (1H MACD positiv, 4H MACD positiv) und den bärischen Signalen auf dem Tages-Chart (RSI unter 50, MACD negativ, Preis unter mittlerem Bollinger-Band) ist ein wichtiger Fokusbereich. Diese Diskrepanz unterstreicht den kurzfristigen Optimismus, der möglicherweise gegen längerfristige Gegenwinde kämpft. Für eine anhaltende bullische Bewegung müssten die Tagesindikatoren positiv werden und den Trend bestätigen. Umgekehrt könnte ein Versagen, die kurzfristigen Unterstützungsniveaus zu halten, die auf dem Tages-Chart angedeutete bärische Stimmung beschleunigen. Trader müssen wachsam bleiben und erkennen, dass der aktuelle Preis von 6.572,87 Dollar ein Schlachtfeld ist, auf dem diese gegensätzlichen Kräfte aufeinanderprallen.
Handelsszenarien und Wahrscheinlichkeiten
Bärisches Szenario: Widerstand hält stand
65% WahrscheinlichkeitNeutrales Szenario: Konsolidierung um 6.572,87 Dollar
25% WahrscheinlichkeitBullisches Szenario: Ausbruchsbestätigung
10% WahrscheinlichkeitDas aktuelle technische Setup für den S&P 500 bei 6.572,87 Dollar präsentiert ein klassisches Risiko-Ertrags-Szenario. Die höhere Wahrscheinlichkeit liegt bei einer Fortsetzung des vorherrschenden bärischen Trends, der auf dem Tages-Chart beobachtet wird, oder zumindest bei einer Konsolidierungsphase, angesichts der überkauften Bedingungen auf kürzeren Zeitrahmen und des signifikanten Widerstands darüber. Ein Bruch unter die unmittelbare Unterstützung bei 6.568,73 Dollar würde die bärische Tendenz wahrscheinlich bestätigen und niedrigere Niveaus anvisieren. Umgekehrt würde ein starker, volumenunterstützter Ausbruch über 6.577,27 Dollar die längerfristige bärische Aussicht in Frage stellen, dies erscheint jedoch angesichts der aktuellen Indikatoren weniger wahrscheinlich. Trader sollten das Risikomanagement priorisieren, definierte Stop-Loss-Orders verwenden und die widersprüchlichen Signale über die Zeitrahmen hinweg bei der Formulierung ihrer Strategien berücksichtigen.
Häufig gestellte Fragen: S&P 500 Analyse
Was passiert, wenn der SP500 unter die Unterstützung bei 6.568,73 Dollar fällt?
Ein Bruch unter 6.568,73 Dollar beim S&P 500 würde kurzfristige bullische Versuche entkräften und wahrscheinlich weitere Verkäufe auslösen, mit Zielen bei 6.547,63 und 6.535,07 Dollar. Dies würde mit den bärischen Signalen auf dem Tages-Chart übereinstimmen.
Sollte ich SP500 auf dem aktuellen Niveau von 6.572,87 Dollar angesichts der gemischten Signale kaufen?
Ein Kauf bei 6.572,87 Dollar ist aufgrund des Widerstands bei 6.577,27 Dollar und der überkauften Bedingungen auf kürzeren Zeitrahmen ein hochriskantes Unterfangen. Ein umsichtigerer Ansatz wäre, auf einen bestätigten Ausbruch über den Widerstand oder eine klare Korrektur zu den Unterstützungsniveaus wie 6.547,63 Dollar zu warten.
Ist der RSI bei 70,95 ein Verkaufssignal für SP500 im Moment?
Ein RSI-Wert von 70,95 auf dem 1-Stunden-Chart zeigt überkaufte Bedingungen an, was auf eine mögliche kurzfristige Korrektur hindeutet, anstatt auf ein unmittelbares Verkaufssignal. Es signalisiert, dass die jüngste Rallye an Schwung verliert und Vorsicht bei neuen Long-Einstiegen geboten ist.
Wie wird sich die aktuelle Stärke des DXY bei 100,91 diese Woche auf den SP500 auswirken?
Der erstarkende Dollar-Index (DXY) bei 100,91 kann aufgrund seiner inversen Korrelation Druck auf den S&P 500 ausüben. Dies könnte das Aufwärtspotenzial begrenzen und die Wahrscheinlichkeit von Tests der Unterstützungsniveaus erhöhen, wenn der Dollar seinen Aufstieg fortsetzt.
| Indikator | Wert | Signal | Interpretation |
|---|---|---|---|
| RSI (1H) | 70.95 | Neutral | Überkauft, potenzielle Korrektur |
| MACD (1H) | - | Bärisch | Negative Dynamik, bärische Divergenz |
| Stochastik (1H) | K:65.73, D:73.50 | Bärisch | Bärisches Kreuzen, nachlassende Dynamik |
| ADX (1H) | 49.72 | Bullisch | Starker Trend, aber Signale für mögliche Umkehr |
| RSI (4H) | 62.83 | Neutral | Bullisch, Raum für weitere Bewegung nach oben |
| MACD (4H) | + | Bullisch | Unterstützung durch positive Dynamik |
| Stochastik (4H) | K:97.85, D:86.96 | Bärisch | Tief überkauft, Umkehrrisiko |
| ADX (4H) | 24.23 | Bullisch | Moderate Trendstärke |
| RSI (1D) | 45.35 | Neutral | Unter 50, bärische Tendenz |
| MACD (1D) | - | Bärisch | Negative Dynamik, starkes bärisches Signal |
| Bollinger (1D) | Unter Mitte | Bärisch | Bärischer Trend im Gange |
| ADX (1D) | 47.51 | Bärisch | Starker bärischer Trend |
Märkte in Echtzeit verfolgen
KI-gestützte Analyse und Echtzeit-Preisdaten.
Treten Sie unserem Telegram-Kanal bei
Aktuelle Marktnachrichten und KI-Analysen sofort.
Kanal beitreten