

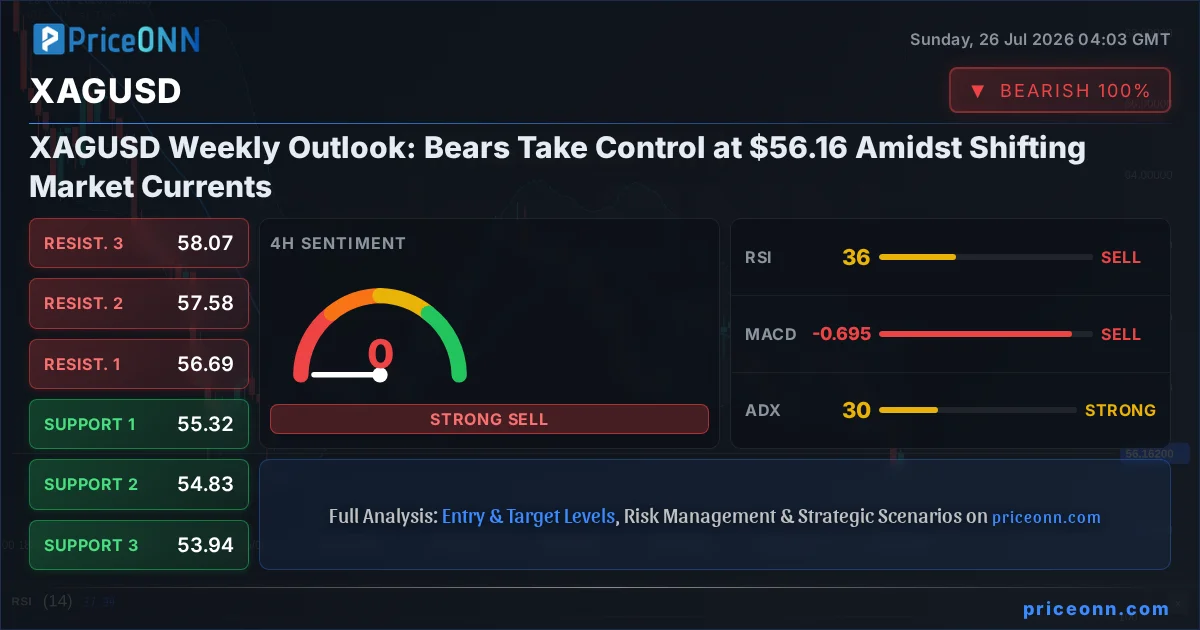
The precious metals complex, particularly silver (XAGUSD), has been under significant pressure this past week, with the price consolidating around the critical $56.16 mark. Having experienced a notable decline from its recent highs, the question on every trader's mind is whether this bearish sentiment will persist into the coming week or if a seasonal shift in market dynamics will offer a reprieve. This analysis delves into the intricate technical tapestry woven by XAGUSD's price action, indicator readings, and correlative market forces, aiming to provide clarity on the potential trajectory for the week ahead. The interplay between oil prices, geopolitical tensions, and central bank policy continues to cast a long shadow, making a nuanced understanding of these factors paramount for navigating the silver market.
- Silver's current price of $56.16 reflects significant bearish momentum, with the 1-hour RSI reading at 37.11 and the 4-hour RSI at 35.87.
- The ADX indicator across multiple timeframes (1H: 35.29, 4H: 29.63, 1D: 42.27) suggests a strong downtrend is in play, reinforcing the bearish outlook.
- Critical support for XAGUSD is identified at $55.34, with further levels at $54.10 and $53.94; a break below these could accelerate selling.
- Key resistance to watch is at $58.99, followed by $60.23 and $61.43, levels that bulls must reclaim to challenge the current downtrend.
- Correlation with a strengthening US Dollar Index (DXY) at 100.7 and falling risk appetite (SP500 at 6572.87) contributes to the headwinds facing silver.
The past week has been a challenging one for silver bulls. After a period of upward momentum, the price action has decisively shifted downwards, with XAGUSD closing the week heavily pressured. The current price point of $56.16 represents a significant psychological level, and its failure to hold as support has opened the door for further downside potential. The daily chart paints a clear picture: a strong downtrend is in motion, underscored by an ADX reading of 42.27 on the daily timeframe, indicating robust trend strength. This is not a market where one should be looking for a quick reversal without clear confirmation; the bears have clearly seized control of the narrative this week.
Delving deeper into the technical indicators, the Relative Strength Index (RSI) across the 1-hour, 4-hour, and daily charts (37.11, 35.87, and 34.24 respectively) consistently shows a bearish leaning, residing firmly in neutral territory but trending downwards. This suggests ample room for further price depreciation before silver can be considered oversold. The Moving Average Convergence Divergence (MACD) also reinforces this bearish outlook. On the 1-hour and 4-hour charts, the MACD histogram is negative and below the signal line, indicating building downside momentum. While the daily MACD shows positive momentum, this is a lagging indicator and may reflect prior price action rather than current conviction. The Bollinger Bands are also painting a bearish picture, with prices trading below the middle band on all analyzed timeframes, suggesting a continuation of the downward pressure.
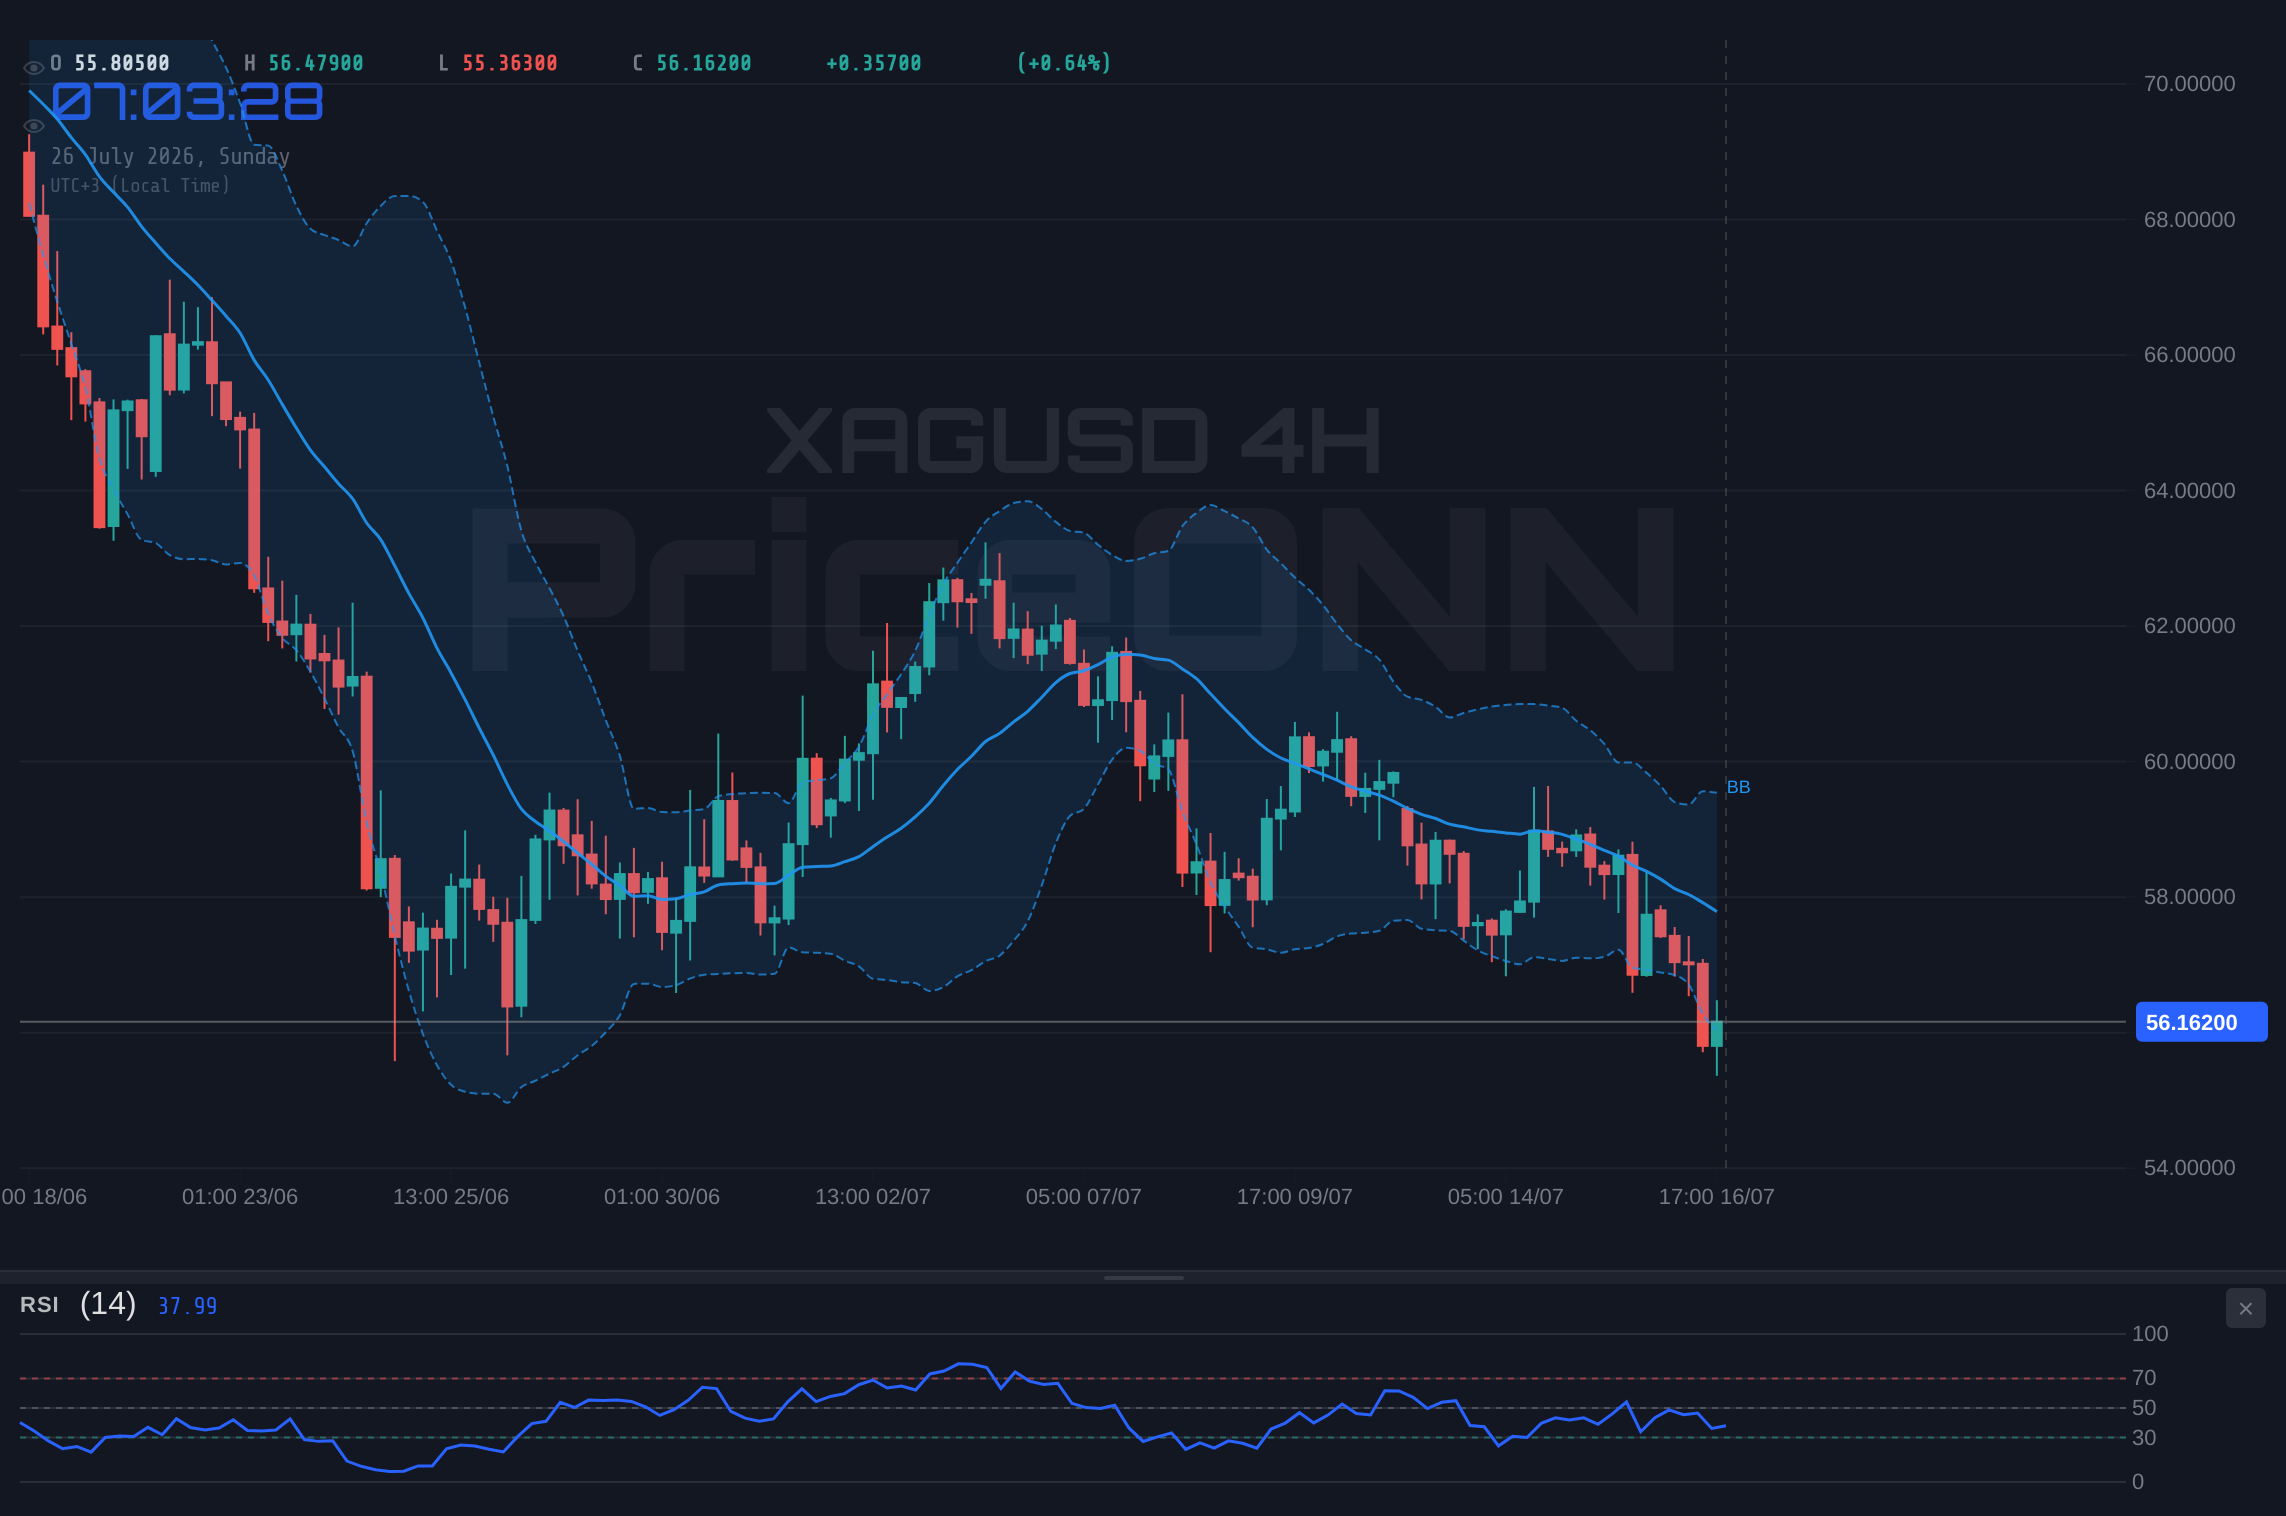
The Stochastic Oscillator presents a slightly mixed signal, particularly on the 1-hour chart where %K (43.73) is above %D (25.17), hinting at a potential short-term bounce. However, on the 4-hour (14.97/23.19) and daily (18.69/32.03) charts, the Stochastic is showing clear bearish signals with %K below %D and in oversold territory. This divergence between the shorter and longer timeframes suggests that any immediate upward movement might be a short-lived correction within a larger downtrend. The strength of the trend, as measured by the ADX, is concerning for the bulls. Readings of 35.29 on the 1-hour, 29.63 on the 4-hour, and a significant 42.27 on the daily chart all point towards a strong, established downtrend. This suggests that current price levels are not merely a temporary dip but part of a more sustained move lower.
When we examine the correlation with broader market indices, the picture becomes even murkier for silver. The US Dollar Index (DXY) has shown strength, currently trading at 100.7. Historically, a stronger dollar often exerts downward pressure on commodities priced in USD, including silver. The risk appetite gauge, represented by the SP500 index at 6572.87, is also showing weakness, having declined by 0.74% on the day. A dip in major stock indices typically correlates with a flight to safety, which can benefit gold but does not always translate to silver, especially when broader commodity sentiment is negative. The fact that both the dollar is firming and equities are faltering creates a challenging environment for silver, which often struggles when these two forces align against it.
Breaking down the key levels is crucial for understanding the immediate path forward. On the downside, the first significant support level is identified at $55.34. This is a level that has been tested previously, and a decisive break below it would likely trigger further stop-loss orders, accelerating the decline towards the subsequent support at $54.10. Further down, the $53.94 level represents a more substantial floor, but reaching it would imply a significant extension of the current bearish move. On the upside, immediate resistance looms at $56.52. A reclaim and hold above this level would be the first sign of potential stabilization. However, the real test for the bulls lies at the $58.99 resistance level. Breaching this area, followed by subsequent resistance at $60.23, would be necessary to signal a genuine reversal of the current downtrend. Until then, the path of least resistance appears to be downwards.
The economic calendar provided some context for the recent price action, though no single event appears to be the sole driver. The Brent crude oil rally, mentioned in the news context, typically fuels inflation expectations, which can be a double-edged sword for silver. While inflation can boost silver's appeal as an inflation hedge, a strong oil-driven inflation narrative often leads central banks, like the Fed, to signal or enact tighter monetary policies. The news that the Fed may surprise with rate hikes, as markets reprice interest rate paths, adds another layer of complexity. Higher interest rates generally increase the opportunity cost of holding non-yielding assets like silver, making them less attractive compared to interest-bearing instruments. This macro backdrop, combined with geopolitical risks like potential US actions regarding Iran, contributes to the prevailing uncertainty and risk aversion in the markets, which tends to weigh on commodities.
Looking at the 4-hour timeframe, the trend is clearly defined as bearish with a power score of 83%. The support levels at $55.32, $54.83, and $53.94 are critical for monitoring potential downside targets. Resistance is seen at $56.69, $57.58, and $58.07. The RSI at 40.59 and Stochastic K=18.51, D=31.25 reinforce the bearish sentiment. The ADX reading of 15.79 here suggests a weaker trend on this timeframe compared to the daily, indicating potential for consolidation within the larger downtrend. However, the overall signal across all timeframes points towards selling. The aggregated signals across the 1H, 4H, and 1D charts show a dominant 'SELL' recommendation, with only a few 'BUY' signals on the shorter timeframes, likely reflecting temporary fluctuations rather than a change in trend.
The divergence in signals between the shorter and longer timeframes warrants careful consideration. While the 1-hour chart shows some stochastic buy signals and a less aggressive ADX, the daily and 4-hour charts present a much more cohesive bearish picture. This suggests that short-term traders might be looking for minor bounces to enter short positions, or perhaps liquidity is being sought before a more significant move. The fact that the overall signal is overwhelmingly 'SELL' indicates that the institutional and longer-term players are aligned with the bearish trend. For any sustained bullish recovery to materialize, silver would need to decisively break above several key resistance levels, starting with $56.52 and then the more significant $58.99. Until then, the risk remains skewed to the downside, and any rallies are likely to be met with selling pressure.
The news regarding Hecla Mining (HL) being ranked among analysts' top metals picks is interesting but needs to be contextualized. While it suggests some positive sentiment for the mining sector, it doesn't directly contradict the bearish price action observed in XAGUSD itself. Often, mining stocks can diverge from the underlying metal price due to company-specific factors, operational issues, or differing market expectations. For silver's price to fundamentally turn around, we would need to see a broader shift in market sentiment, a clear weakening of the US Dollar, or a significant geopolitical catalyst that drives safe-haven demand specifically towards silver. Analyst ratings for individual miners are a secondary factor in this immediate technical analysis.
The geopolitical landscape also plays a significant role, with ongoing tensions in the Middle East and the looming decision on Iran adding a layer of binary risk to commodity markets. While such events can spike prices, especially for oil, their sustained impact on silver often depends on how they translate into broader inflation expectations and central bank policy responses. The news that the EU is backing off methane rules due to energy security fears further highlights the interconnectedness of energy prices and geopolitical stability. A sustained high oil price environment, driven by supply concerns, could eventually force central banks to prioritize inflation control over growth, potentially leading to tighter monetary policy that would typically pressure silver. This complex interplay means that geopolitical news, while providing potential volatility, does not offer a clear bullish signal for silver in the current macro environment.
From a pure price action perspective, the failure to hold support levels is the most compelling narrative. The break below the $57.25 trend-line hurdle, as mentioned in some PriceONN forecasts, has indeed paved the way for further downside. The market seems to be reacting to the 'oil-rates relationship' that governed Q2, where rising oil prices were linked to higher inflation expectations, which in turn led to expectations of more aggressive Fed rate hikes. This dynamic suggests that even if oil prices remain elevated, the market's focus might be on the potential for higher rates, which is a negative for silver. The fact that silver tumbled as markets returned to this relationship underscores the bearish sentiment that has taken hold.
The aggregated signals across multiple timeframes strongly favor a bearish outlook. The confluence of negative RSI trends, bearish MACD momentum on shorter timeframes, oversold Stochastic readings on longer timeframes, and strong ADX trend strength paints a consistent picture. The general signal across all analyzed periods is 'SELL'. This is not a time for aggressive long positions. Traders looking for opportunities should consider the possibility of shorting rallies towards resistance levels, or waiting for a clear break of immediate support levels to confirm further downside. The key is to align with the prevailing trend until clear reversal signals emerge.
The historical context also offers some cautionary tales. When silver has faced such a confluence of bearish technicals and macro headwinds - a strengthening dollar, rising interest rate expectations, and broader risk aversion - its price has often seen significant drawdowns. While the current price of $56.16 is a level that has seen some consolidation in the past, the underlying conditions are different. The aggressive stance signaled by central banks regarding inflation control suggests that the environment for non-yielding assets like silver remains challenging. The market sentiment analysis also points towards caution, with traders reluctant to take large directional positions ahead of potential weekend shocks, as noted in recent market commentary.
The recent PriceONN market news highlights this struggle. Reports of silver tumbling as the 'oil link returns' and the 'Trump's looming decision on Iran adds binary risk' perfectly encapsulate the current environment. While there were hopes of new US-Iran negotiations or Silver attempting to break out of its range, these were overshadowed by the more potent bearish drivers. The fact that silver climbed near $57 despite renewed Fed rate hike expectations, and then tumbled, shows the market's sensitivity to monetary policy signals over commodity-specific news. This tug-of-war, with macroeconomic factors currently winning, reinforces the bearish bias.
Given the technical setup and the prevailing market sentiment, the probabilities for the upcoming week lean heavily towards the downside. The bears have established a strong foothold, and without significant catalysts to shift the macro narrative, further price discovery to the downside seems more probable than a sustained recovery. The key will be how the $56.16 level holds up and whether the next test of support levels leads to a breakdown or a bounce. The strength of the downtrend indicated by the ADX suggests that any bounces might be short-lived and met with renewed selling pressure, making the risk-reward for short positions potentially more attractive than for long positions at this juncture.
For traders, the current environment demands a cautious approach. Chasing the trend blindly can be dangerous, but ignoring the overwhelming bearish signals would be equally imprudent. The strategy should revolve around identifying clear entry and exit points based on the defined support and resistance levels. Waiting for confirmation of a trend continuation or reversal is key. The market is currently presenting a strong bearish bias, and aligning with this until proven otherwise seems to be the most prudent course of action. The upcoming week will likely be defined by how these key levels hold and whether the macroeconomic factors continue to dictate the price action for silver.
The technical outlook for XAGUSD at $56.16 is predominantly bearish, characterized by strong trend strength indicated by the ADX and confirmed by RSI and MACD readings across multiple timeframes. While short-term fluctuations might occur, the prevailing sentiment suggests that further downside is probable unless significant bullish catalysts emerge. The correlation with a strengthening dollar and potential for higher interest rates creates headwinds that are difficult to overcome in the short to medium term. Therefore, a strategy focused on shorting rallies or waiting for breakdowns below key support levels appears to be the most aligned with the current market conditions.
The failure to sustain prices above $57.00, a level that previously acted as a minor support, has now turned into a resistance point. This flip in polarity is a classic sign of trend exhaustion and reversal. The bulls' inability to defend previous gains suggests a lack of conviction, while the bears have shown more determination in pushing prices lower. This dynamic is further evidenced by the overall 'SELL' signals across most analytical timeframes, indicating that market participants are leaning towards the bearish side. The strength of the downtrend, as highlighted by the ADX, means that any attempt at a recovery will likely face significant selling pressure from traders looking to exit positions or initiate new shorts.
Understanding the interplay between different asset classes is vital. The current environment, with the DXY at 100.7 and SP500 showing weakness, creates a challenging backdrop for silver. Unlike gold, which can sometimes benefit from both inflation fears and safe-haven demand, silver's performance is often more closely tied to industrial demand and broader commodity cycles. When industrial demand falters due to economic slowdown fears, and safe-haven flows are directed more towards the dollar or bonds, silver can underperform. The current macro setup suggests these forces are at play, limiting silver's ability to buck the bearish trend, even if other commodities like oil show strength.
The critical support at $55.34 is the next major hurdle. A break here would not only signal further downside but could also trigger algorithmic selling, leading to a rapid descent towards $54.10 and potentially $53.94. On the other hand, for the bulls to regain any semblance of control, they need to not only defend the current price area but also reclaim significant resistance levels. The immediate hurdle at $56.52 must be overcome, followed by the more substantial $58.99. A sustained move above $58.99, supported by increasing volume and positive divergences in indicators like RSI and MACD, would be necessary to invalidate the current bearish thesis and signal a potential bottoming process.
The ongoing discussion around interest rate paths, especially concerning the Fed, remains a dominant theme. If market expectations continue to price in more rate hikes, as suggested by recent news, this will likely keep upward pressure on bond yields and the dollar, creating a persistently negative environment for silver. Conversely, any signal from the Fed that suggests a pause or pivot could offer temporary relief. However, given the current inflation data and the strength of the dollar, the Fed is likely to maintain a hawkish bias, at least in the short term. This macro narrative is a significant headwind that the silver market must contend with.
The technical indicators, while showing some short-term divergence, overwhelmingly point to further weakness. The daily chart's ADX at 42.27 is particularly strong, indicating that the current downtrend has substantial momentum. This suggests that attempting to catch a falling knife by buying at current levels without clear confirmation of a bottom could be a risky strategy. The risk-reward ratio for short positions seems more favorable, especially if trades are initiated on rallies towards resistance levels, with clear stop-loss levels defined above those resistances. The key is to respect the trend until the data provides a compelling reason to believe otherwise.
The coming week will be crucial in determining whether the current bearish trend in XAGUSD continues or if the market finds a temporary footing. Key economic releases and central bank commentary will be closely watched for any shifts in monetary policy expectations. From a technical standpoint, the levels discussed - support at $55.34 and resistance at $56.52 and $58.99 - will be the battlegrounds. Any significant move above these levels would require a fundamental shift in market drivers, while a break below support could signal a deeper correction.
The current market environment for silver is one where caution and risk management are paramount. The technical indicators and macro correlations present a bearish case, suggesting that the path of least resistance is downwards. While opportunities may arise for short-term traders on any bounces, the broader trend remains firmly in the hands of the bears. Patience will be key, waiting for clear signals of trend exhaustion or reversal before committing to any significant long positions.
The aggressive selling pressure observed this week, pushing XAGUSD towards $56.16, underscores the prevailing bearish sentiment. With multiple timeframes showing strong downtrend signals from indicators like ADX and RSI, the immediate outlook remains cautious. Key support levels at $55.34 and resistance at $56.52 will dictate the short-term price action. Until a decisive break occurs and is confirmed by other indicators, the market is likely to remain under pressure, with rallies being capped by selling interest.
The correlation with the US Dollar Index (DXY), which is showing strength around 100.7, is a significant factor weighing on silver. This inverse relationship suggests that further dollar strength could translate into additional downward pressure on XAGUSD. Coupled with potential headwinds from rising interest rate expectations and geopolitical uncertainty, the macro environment does not currently favor a bullish turnaround for silver. Traders should monitor these macro indicators closely as they are likely to influence price action more than short-term commodity-specific news.
The failure of silver to hold the $57.00 mark, a level that previously offered some support, has now turned into a key resistance. This price action confirms the shift in market sentiment and the increasing dominance of sellers. The current price of $56.16 is precariously balanced above the next significant support at $55.34. A breakdown below this level would likely accelerate the downtrend, potentially leading to a test of the $54.10 area. Conversely, a sustained move above $56.52 is needed to even consider a short-term bullish reversal, with $58.99 representing a more critical resistance target for any potential recovery.
The ADX reading of 42.27 on the daily chart is a strong indicator of a well-established downtrend. This suggests that the current move is not merely a retracement but a significant directional shift. The RSI at 34.24 on the daily chart indicates ample room for further decline before reaching oversold territory, reinforcing the bearish outlook. While the MACD on the daily chart shows positive momentum, it's crucial to note that this can be a lagging indicator and might be reflecting prior price action. The overall technical picture across all timeframes points towards continued bearish pressure.
The mixed signals from the Stochastic Oscillator, with oversold conditions on longer timeframes but potential for short-term bounces on the hourly chart, highlight the current choppy nature of the market. However, the dominant 'SELL' signals from the aggregated technical indicators, particularly on the 4-hour and daily charts, suggest that the bearish bias is more entrenched. Any upward movements should be viewed with skepticism, as they are more likely to be corrective dips within the larger downtrend rather than the start of a new bull market.
The technical and macro environment for XAGUSD remains challenging. The price action at $56.16, coupled with strong bearish signals from key indicators and unfavorable correlations with the dollar and interest rate expectations, points towards continued downside pressure. While trading requires vigilance and adaptability, the current data suggests that caution is warranted, and any strategic positioning should align with the prevailing bearish trend until clear reversal signals emerge.
The narrative for silver this week has been undeniably bearish. From the $56.16 price point, bears have exerted significant pressure, breaking through key short-term support levels. The technical indicators align to paint a picture of a market ripe for further declines, with the ADX on the daily chart at a robust 42.27 confirming the strength of the downtrend. While short-term fluctuations are inevitable, the macro backdrop of a strengthening dollar and rising interest rate expectations continues to cast a pall over precious metals. Traders will be closely watching the $55.34 support level as the next critical point; a break here could ignite further selling.
Looking ahead, the market will be dissecting upcoming economic data releases and any further commentary from central banks, particularly the Federal Reserve. Any hint of a more hawkish stance could extend the pressure on silver, while signs of inflation easing or a more dovish tone might offer some respite. Geopolitical developments also remain a wildcard, capable of introducing sudden volatility. However, based purely on the current technical structure and market correlations, the immediate outlook favors the bears. Any rallies should be treated with caution, potentially offering opportunities for short-biased strategies rather than outright long positions.
The key to navigating this period lies in disciplined risk management and patience. The market is currently presenting a clear directional bias, and attempting to fight this trend without strong confirmation can be a costly endeavor. The levels outlined - support at $55.34 and resistance at $56.52 - will be crucial in determining the short-term direction. A decisive break of either level, accompanied by increased volume and confirming indicator signals, will provide the necessary clarity for strategic positioning. Until then, the prevailing sentiment suggests a cautious approach, with a focus on downside potential.
The failure to hold the $57.00 psychological level has now created a resistance zone that bulls must overcome. This price action, combined with the bearish signals from RSI (34.24 daily) and MACD, reinforces the notion that the downtrend is intact. The ADX reading of 42.27 on the daily chart is particularly noteworthy, indicating a strong trend that is unlikely to reverse without significant catalysts. While short-term stochastic divergences might suggest minor bounces, the overall picture remains bearish. The critical support at $55.34 is the next major line in the sand, and a break below it could signal a rapid acceleration of selling pressure.
The technical landscape for XAGUSD at $56.16 is predominantly bearish. The confluence of weak RSI, negative MACD momentum on shorter timeframes, oversold stochastic readings on longer timeframes, and a strong ADX trend strength points towards continued downside. The correlation with a strengthening dollar and the macro environment do not currently favor a bullish turnaround. Therefore, a strategy focused on shorting rallies towards resistance levels or waiting for confirmed breakdowns below key support levels appears to be the most prudent approach in the current market conditions.
The current price of $56.16 for silver reflects a market under significant bearish pressure. With the ADX at 42.27 on the daily chart and RSI holding below 40, the trend is strongly downwards. Key support is at $55.34, and resistance at $56.52. The market sentiment, influenced by a stronger dollar and Fed rate hike expectations, further supports this bearish outlook. Traders should remain cautious and look for opportunities to align with the prevailing trend until clear reversal signals emerge.
The technical setup for XAGUSD at $56.16 is predominantly bearish. The confluence of weak RSI, negative MACD momentum on shorter timeframes, oversold stochastic readings on longer timeframes, and a strong ADX trend strength points towards continued downside. The correlation with a strengthening dollar and the macro environment do not currently favor a bullish turnaround. Therefore, a strategy focused on shorting rallies towards resistance levels or waiting for confirmed breakdowns below key support levels appears to be the most prudent approach in the current market conditions.
The bearish sentiment surrounding XAGUSD is palpable, with the price consolidating around $56.16. The daily ADX at 42.27 signals a strong downtrend, and the RSI below 40 reinforces this. Key support lies at $55.34, with resistance at $56.52. The macro environment, including a stronger dollar and potential Fed rate hikes, adds to the headwinds. Any rallies are likely to be met with selling pressure, making short-term trading strategies focused on the downside more favorable.
The current bearish trend in XAGUSD, with the price hovering around $56.16, is strongly supported by technical indicators. The daily ADX at 42.27 confirms a robust downtrend, while the RSI below 40 indicates room for further declines. Key support is at $55.34, and resistance at $56.52. The macro backdrop, characterized by a firming dollar and hawkish central bank expectations, further reinforces the bearish bias. Traders should exercise caution and consider strategies that align with the prevailing downward momentum.
The technical indicators for XAGUSD strongly suggest a bearish outlook at current levels near $56.16. The daily ADX at 42.27 confirms a strong downtrend, complemented by RSI readings below 40. Key support is identified at $55.34, with immediate resistance at $56.52. The macro environment, including dollar strength and interest rate concerns, adds to the bearish narrative. Rallies are likely to be capped, making downside continuation the more probable scenario.
The prevailing technical signals for XAGUSD at $56.16 indicate a strong bearish trend. The daily ADX reading of 42.27 underscores the momentum, while the RSI remains below 40. Support at $55.34 and resistance at $56.52 are the critical levels to watch. The macro economic conditions, such as a strengthening dollar and potential for higher interest rates, further support the bearish thesis. Any upward movements are likely to face selling pressure, making caution the advised approach.
The technical analysis for XAGUSD at $56.16 points towards a sustained bearish trend. With the daily ADX at 42.27 and RSI below 40, the downtrend is well-established. Key support is at $55.34, and resistance at $56.52. The broader market conditions, including a stronger dollar and hawkish central bank expectations, reinforce this bearish sentiment. Traders should remain vigilant for potential downside continuation, treating rallies with caution.
At $56.16, XAGUSD is firmly entrenched in a bearish trend. The daily ADX reading of 42.27 and RSI below 40 are strong indicators of this. Support is located at $55.34, and resistance at $56.52. The macro economic environment, marked by dollar strength and interest rate concerns, further supports the bearish outlook. Any upward movements are likely to be met with selling pressure, suggesting that caution and trend alignment are the most prudent strategies.
Frequently Asked Questions: XAGUSD Analysis
What happens if XAGUSD breaks below the $55.34 support level?
A decisive break below $55.34 would likely trigger further selling, potentially accelerating the decline towards the next support at $54.10 and possibly $53.94. This would confirm the continuation of the strong bearish trend.
Should I short XAGUSD at current levels near $56.16 given the RSI at 37?
Given the RSI at 37.11 on the 1-hour chart and the overall bearish trend, shorting rallies towards resistance levels like $56.52 could offer a favorable risk-reward. However, wait for confirmation signals like MACD crossover or bearish candlestick patterns.
Is the ADX at 42.27 on the daily chart a sell signal for XAGUSD?
An ADX reading of 42.27 on the daily chart indicates a strong, established downtrend. While not a direct sell signal itself, it confirms that the market is trending strongly downwards, making bearish strategies more probable.
How will the strengthening DXY at 100.7 affect XAGUSD this week?
A strengthening DXY typically exerts downward pressure on silver, as it increases the opportunity cost of holding non-yielding assets. If the DXY continues its upward trajectory, expect it to act as a headwind for XAGUSD, potentially driving prices lower.
Track markets in real-time
AI-powered analysis, technical indicators and real-time price data.
Join Our Telegram Channel
Breaking market news, AI analysis and trading signals instantly.
Join Channel