

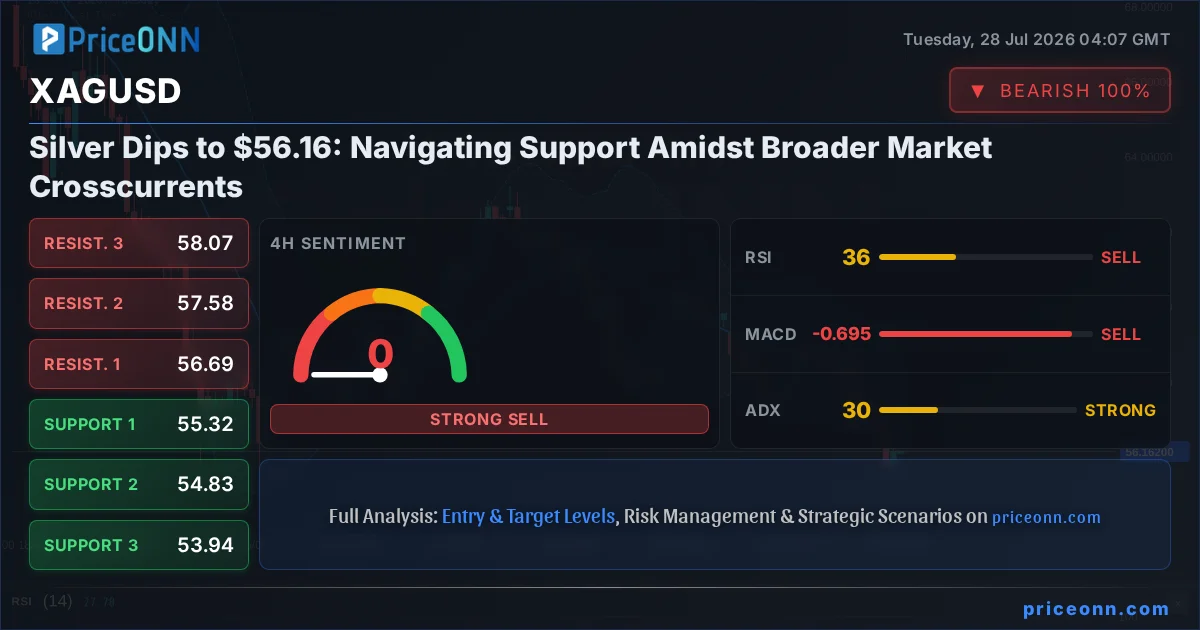
Silver's recent descent has brought it to a critical juncture, trading at $56.16. This pullback, part of a broader market recalibration, sees the precious metal testing established support zones while global financial currents shift. The question on every trader's mind is whether this dip represents a temporary pause in an uptrend or the harbinger of deeper declines. Understanding the intricate dance between the dollar's strength, inflation expectations, and geopolitical undercurrents is paramount for navigating silver's immediate future.
- XAGUSD is currently trading at $56.16, with key support identified at $55.97 and $55.68.
- The Dollar Index (DXY) is showing strength, currently at 100.7, putting pressure on precious metals.
- RSI at 37.11 on the 1H chart indicates room for further downside before becoming oversold, while the ADX at 35.29 signals a strong trend.
- Geopolitical tensions and inflation concerns remain elevated, potentially providing a floor for silver prices despite short-term headwinds.
The narrative surrounding silver is complex, woven from threads of industrial demand, safe-haven appeal, and currency fluctuations. Currently, the prevailing sentiment leans bearish in the short term, as evidenced by the -2.73% daily change and the 1H and 4H overall signal leaning towards 'SELL'. However, the longer-term picture, particularly on the daily chart, presents a more nuanced view, with a mixed signal and strong trend indicators suggesting that while the immediate path may be challenging, significant underlying support could come into play.
The immediate focus for XAGUSD traders is the price action around the $55.97 and $55.68 support levels. These are not arbitrary lines drawn in the sand; they represent areas where buying interest has historically emerged, preventing steeper declines. The 1H chart shows the ADX at 35.29, indicating a robust trend is in play, and with the RSI hovering at 37.11, there's still some room for this trend to extend downwards before hitting oversold territory. The stochastic indicator, however, offers a glimmer of hope, showing %K at 43.73 crossing above %D at 25.17, hinting at a potential, albeit weak, bullish divergence that could precede a bounce.
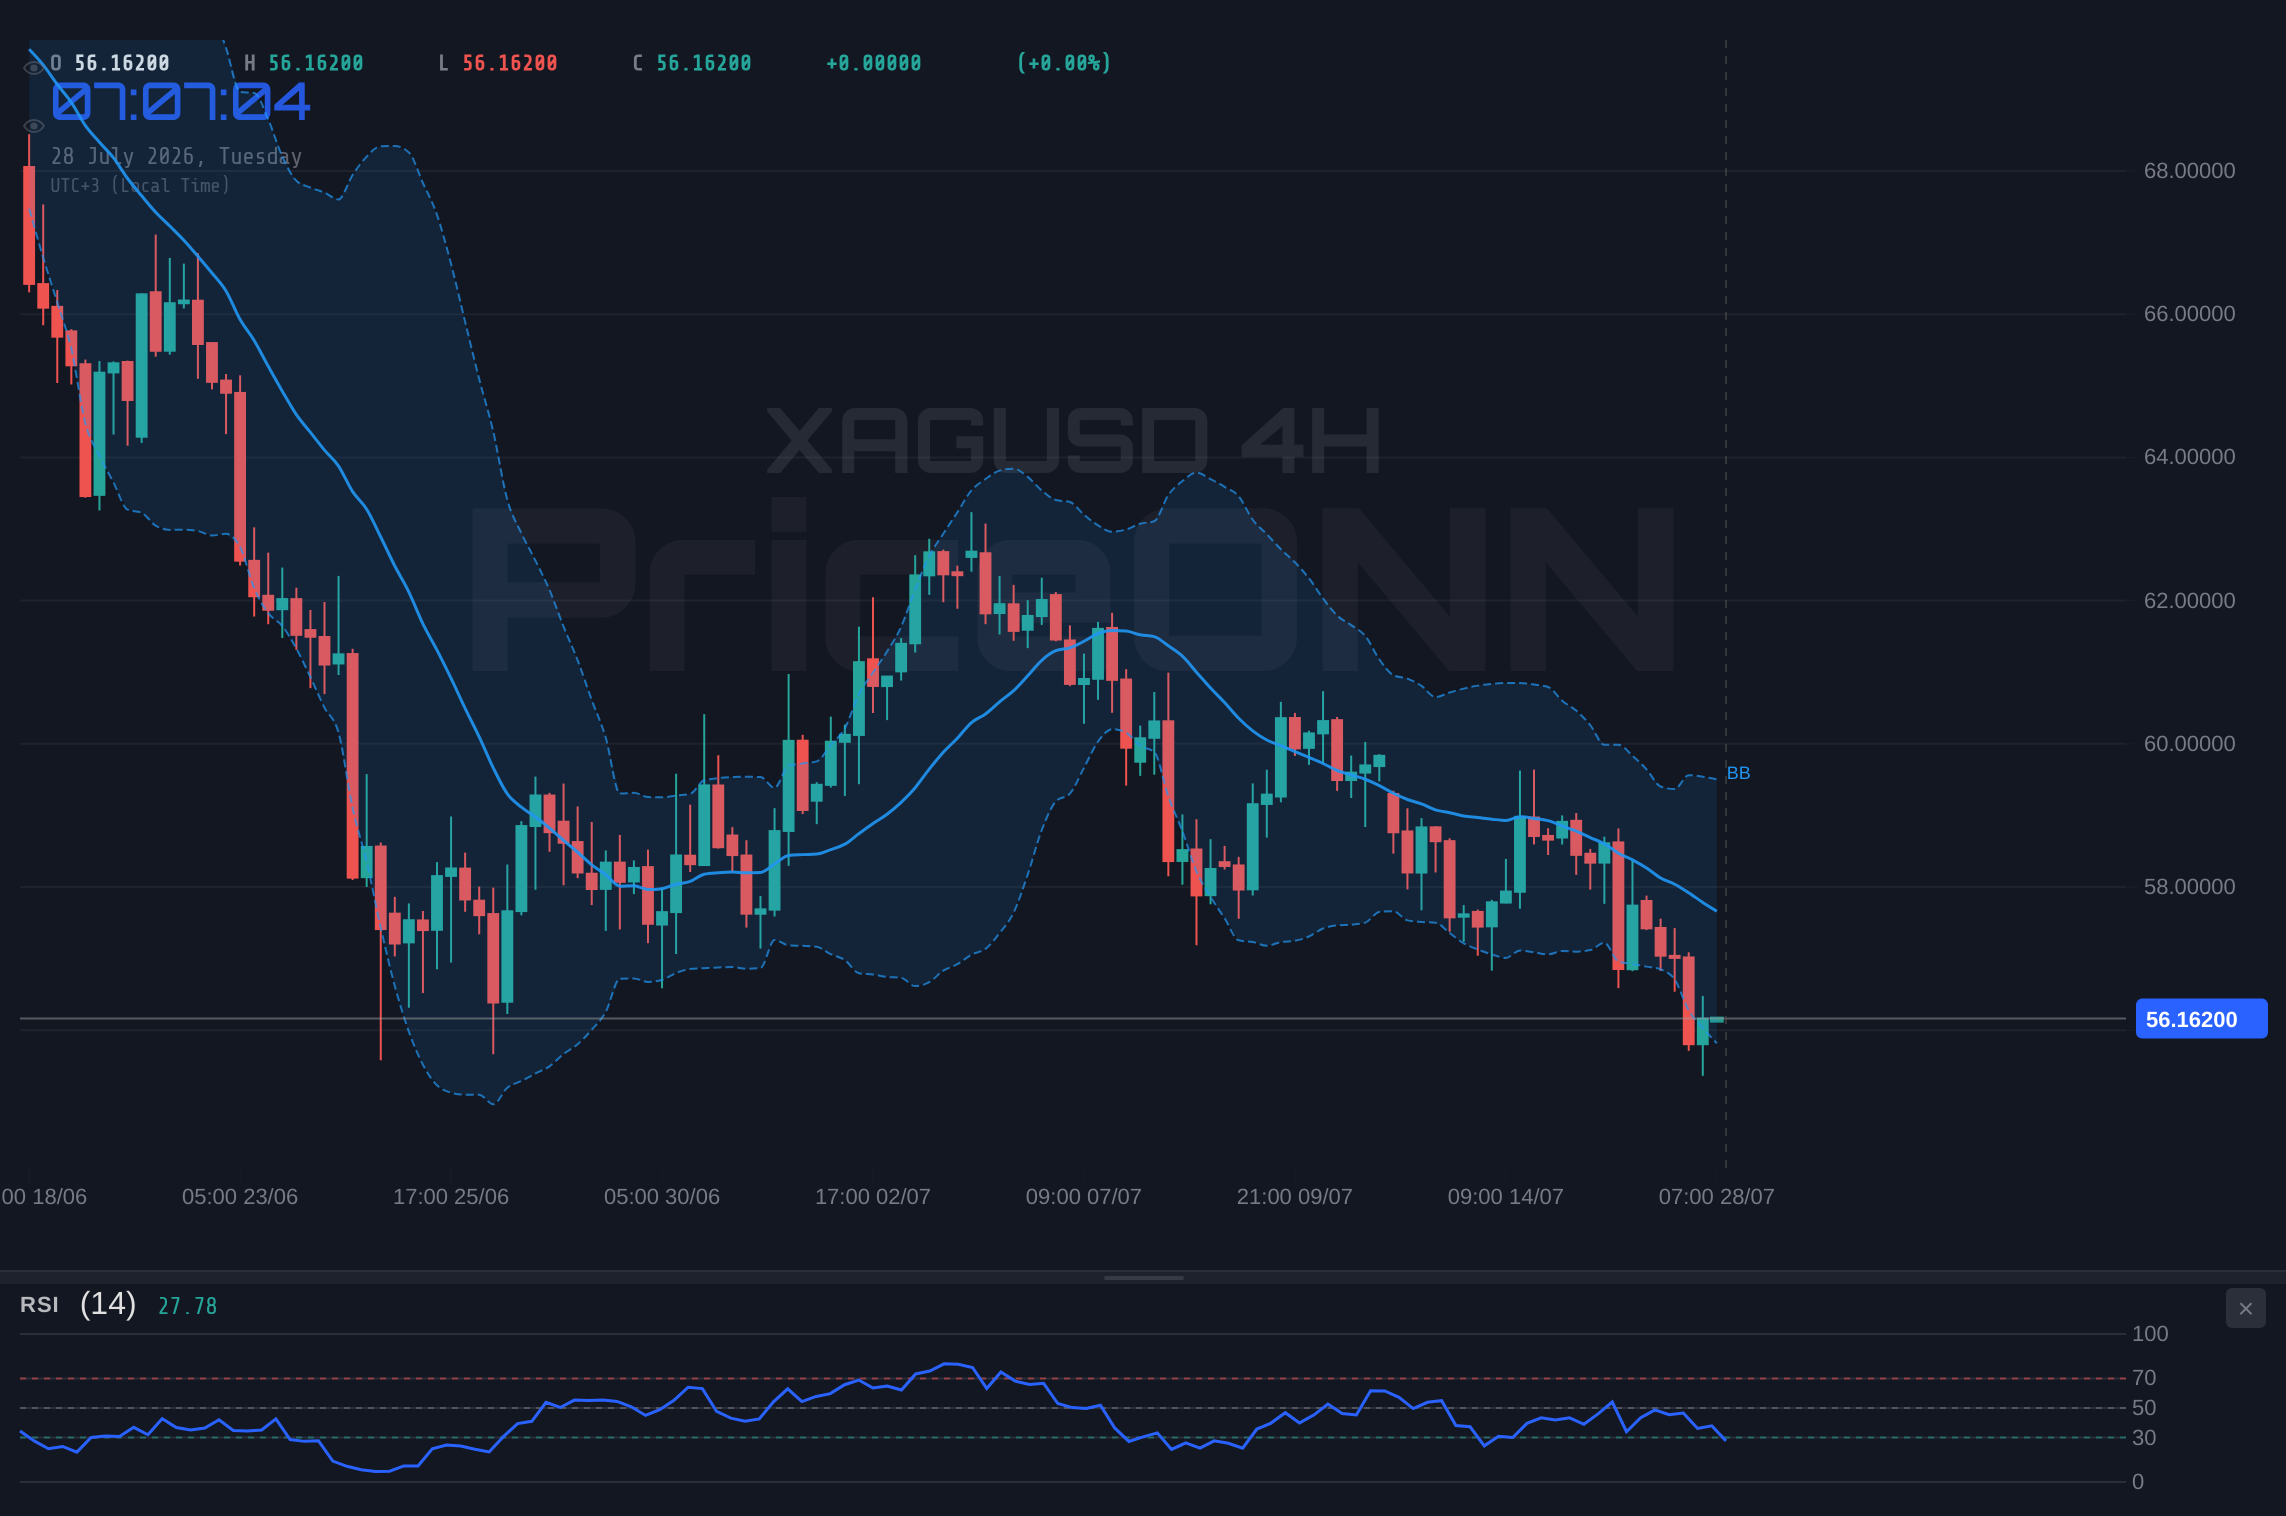
While short-term indicators suggest further downside potential, the strong daily trend ADX of 42.27 indicates that any retracement could be met with significant buying pressure. Traders should exercise caution and look for confirmation before initiating short positions, as the market could be setting up for a reversal.
To truly understand silver's current predicament, we must broaden our lens to include its key correlative assets. The Dollar Index (DXY) is currently trading at 100.7, exhibiting a strengthening trend on the 1H and 1D charts. This inverse relationship is classic: a stronger dollar typically makes dollar-denominated commodities like silver more expensive for holders of other currencies, thus dampening demand. The DXY's upward momentum, particularly the 0.21% daily gain, acts as a headwind for XAGUSD. This correlation is a cornerstone of precious metal analysis; as the dollar strengthens, the purchasing power of other currencies wanes, impacting demand for commodities priced in USD.
The equity markets also paint a picture of cautious sentiment. The S&P 500 is up 0.74% to 6572.87, while the Nasdaq 100 has seen a notable dip of -1.16% to 29164.86. This divergence suggests a sector rotation or a broader uncertainty creeping into riskier assets. In an environment where risk appetite is mixed, safe-haven assets like gold and, by extension, silver, can sometimes find a bid. However, silver's industrial component means it's more sensitive to global growth expectations than gold. The current mixed signals from the indices suggest that institutional money flow might be hedging bets, creating volatility but not necessarily a clear directional bias for silver based on risk sentiment alone.
Geopolitical factors continue to add a layer of complexity. Recent news indicates that oil prices are extending losses as U.S.-Iran calm holds, with reports of Pakistan brokering a return to nuclear deal talks. This easing of Middle East tensions, while reducing immediate inflation fears tied to energy supply disruptions, can also diminish the safe-haven appeal that often benefits precious metals. Historically, periods of heightened geopolitical uncertainty have seen gold and silver rally as investors sought refuge. The current de-escalation, therefore, removes a significant bullish catalyst, contributing to the downward pressure on XAGUSD. However, the oil markets themselves are sensitive, and any resurgence in tensions could quickly reignite safe-haven demand.
The technical indicators on the daily timeframe for XAGUSD present a compelling case for a potential floor, despite the short-term weakness. The ADX stands at a robust 42.27, confirming a strong downward trend, yet the RSI at 38.86 is still comfortably in neutral territory, suggesting that the trend has not yet reached exhaustion. The MACD on the daily chart is showing positive momentum with its histogram above the signal line, which can sometimes precede a bullish reversal even within a downtrend. This divergence between the strong trend signal (ADX) and the potential for momentum shift (MACD, RSI) highlights the conflicting forces at play.
Looking at the broader Forex market, EUR/USD is trading at 1.14436 and showing signs of renewed downside pressure, while USD/JPY is climbing towards 162.429. The weakening Euro against a strengthening dollar adds to the bearish narrative for dollar-priced commodities. Conversely, the strength in USD/JPY, driven by yield differentials and potential central bank divergence, reinforces the dollar's overall strength. This reinforces the headwind for silver, as a stronger dollar typically correlates with lower silver prices. The 1.14357 low on EUR/USD is a key level to watch; a break below it could signal further dollar strength across the board.
The $56.52 resistance level on the 1H chart is the immediate hurdle for any potential silver rebound. A decisive break and hold above this level, supported by increasing volume and a positive shift in short-term indicators like the stochastic, would be the first sign of a bullish shift. However, given the prevailing bearish signals across multiple timeframes and the strong trend indicated by the ADX, such a move would require significant conviction. The confluence of resistance at $56.52 and $56.77 presents a formidable barrier for bulls in the near term.
The daily chart for XAGUSD, despite the current price action, still holds potential for a longer-term recovery, contingent on external factors. If inflation data continues to surprise to the upside globally, or if geopolitical tensions flare up unexpectedly, silver could find renewed safe-haven demand. The $58.99 level on the daily chart represents a significant psychological and technical resistance. A sustained move above this point would signal a more substantial trend change, potentially targeting higher levels. However, this scenario seems less probable in the immediate short term given the current market setup.
Bearish Scenario: Silver's Slide Continues
65% ProbabilityConsolidation Scenario: Range-Bound Trading
25% ProbabilityBullish Scenario: Rebound from Support
10% ProbabilityMarket Outlook & Key Levels Summary
The current market environment for XAGUSD is defined by short-term bearish pressure, reinforced by a strong dollar and easing geopolitical tensions, but underpinned by potential longer-term inflation and safe-haven demand. The $56.16 level is a critical pivot. A break below the $55.68 support could trigger a cascade towards $55.32, aligning with the dominant bearish signals on shorter timeframes. Conversely, a sustained move above the $56.52 resistance is needed to invalidate the immediate downside risk and could open the door for a test of $57.06.
| Indicator | Value | Signal | Interpretation |
|---|---|---|---|
| RSI (14) | 37.11 | Bearish | Room to fall before oversold, reinforcing downside risk. |
| MACD Histogram | -0.25 | Bearish | Negative momentum persists, indicating selling pressure. |
| Stochastic (%K > %D) | 43.73 / 25.17 | Bullish | Potential early sign of reversal or bounce, but trend is key. |
| ADX | 35.29 | Strong Trend | Confirms a strong trend is in play, favouring directional moves. |
| Bollinger Bands | Below Mid Band | Bearish | Price action below the middle band suggests downward pressure. |
Frequently Asked Questions: XAGUSD Analysis
What happens if XAGUSD breaks below the $55.68 support level?
A break below the $55.68 support on XAGUSD would invalidate the potential for a short-term bounce and likely trigger further selling pressure. This could lead to price action testing the next significant support at $55.42, as indicated by the 1H chart, potentially extending the current bearish trend.
Should I consider buying XAGUSD at current levels around $56.16 given the mixed signals?
Buying at current levels around $56.16 carries significant risk due to the prevailing bearish short-term trend and the RSI at 37.11. While the daily chart shows potential for a longer-term floor, confirmation of a bullish reversal, such as a sustained break above $56.52 resistance, is needed. A more prudent approach might be to wait for price to test lower support levels or show clearer signs of a bottoming pattern.
Is the Stochastic crossover at 43.73 a reliable buy signal for XAGUSD?
The Stochastic crossover, with %K at 43.73 above %D at 25.17, does offer a potential early bullish signal. However, it must be viewed in context with the strong ADX reading of 35.29, which indicates a powerful trend is in play. This crossover might signal a brief pause or minor bounce within the larger downtrend, rather than a sustained reversal, requiring further confirmation from price action and other indicators.
How might the current DXY strength at 100.7 affect XAGUSD's price action this week?
The strength of the Dollar Index (DXY) at 100.7 poses a significant headwind for XAGUSD. A stronger dollar typically makes silver more expensive for non-dollar buyers, potentially reducing demand and contributing to price declines. If the DXY continues its upward trend, it will likely reinforce the bearish sentiment for silver, making it harder for the metal to find sustainable upside momentum.
Track markets in real-time
AI-powered analysis, technical indicators and real-time price data.
Join Our Telegram Channel
Breaking market news, AI analysis and trading signals instantly.
Join Channel