

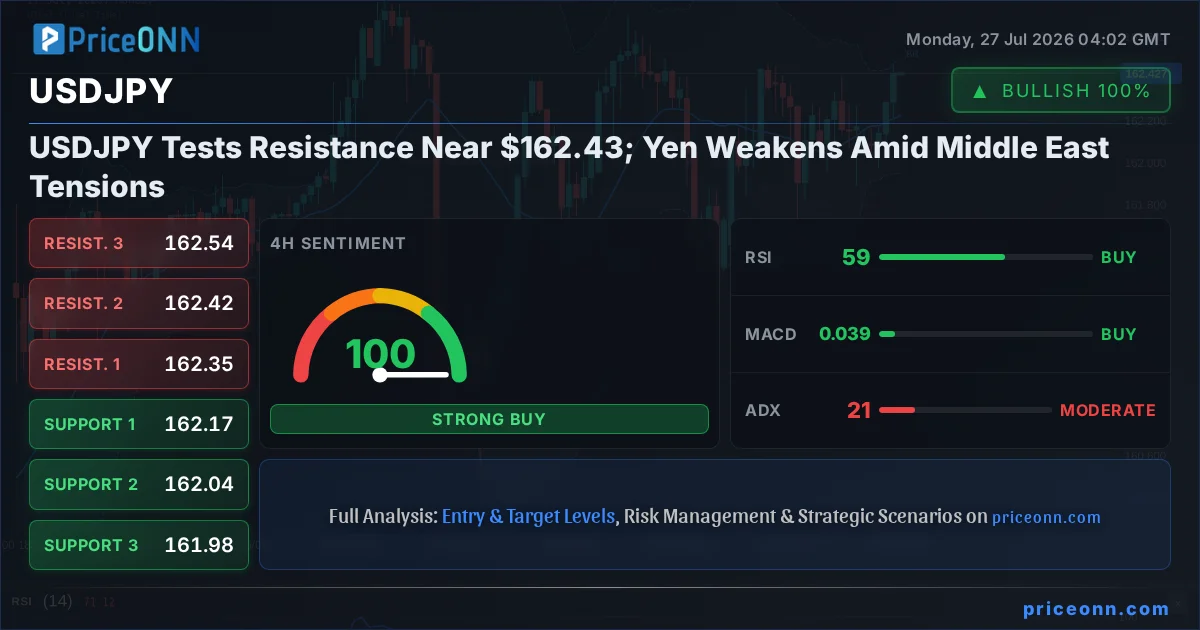
The relentless march of USDJPY towards historic highs continues, with the pair now testing critical resistance levels near the $162.43 mark. This ascent is fueled by a potent cocktail of a strengthening US dollar, persistent weakness in the Japanese yen, and a geopolitical backdrop that keeps safe-haven demand in flux. As global markets brace for upcoming central bank decisions and navigate escalating Middle East tensions, the trajectory of USDJPY warrants a deep dive into the underlying currents shaping its path.
- USDJPY is currently testing resistance around $162.43, with the yen reaching multi-decade lows against the dollar.
- The Dollar Index (DXY) is showing strength, currently at 100.7, correlating with USDJPY's upward move.
- Technical indicators on the 1-hour chart suggest caution, with RSI at 66.56 and Stochastic in the overbought zone, but longer timeframes show a persistent bullish trend.
- Geopolitical risks stemming from the Middle East and upcoming central bank meetings add layers of uncertainty to the outlook.
Navigating the Cross-Currents: Dollar Strength Meets Yen Weakness
The narrative driving USDJPY higher is multifaceted, beginning with the robust performance of the US dollar itself. The Dollar Index (DXY), a key barometer of its strength against a basket of major currencies, is currently trading around 100.7. This upward momentum in the dollar is not an isolated event; it's a significant factor that often puts pressure on currencies like the Japanese yen, which historically exhibits an inverse correlation. When the dollar gains, particularly against a low-yield currency like the yen, USDJPY tends to climb. This dynamic is currently playing out with significant force, pushing the pair into territory not seen in decades.
The yen's weakness, however, is not solely a function of dollar strength. The Bank of Japan's (BOJ) persistently dovish monetary policy stands in stark contrast to the tightening cycles or hawkish undertones from other major central banks. While the Federal Reserve and other institutions have been navigating inflation concerns, the BOJ has maintained an ultra-accommodative stance, keeping interest rates exceptionally low. This policy divergence creates a natural headwind for the yen, making it less attractive to investors seeking yield. The widening interest rate differential between the US and Japan is a fundamental driver that continues to weigh heavily on the yen, contributing significantly to the USDJPY's upward trajectory.
Recent news highlighting Singapore's move to tighten monetary policy, aiming to curb inflation fueled by rising oil prices, further underscores the global divergence in central bank approaches. While some nations are actively seeking to manage inflationary pressures, the BOJ's continued commitment to its accommodative policy leaves the yen vulnerable. This stark contrast in monetary policy frameworks is a critical element in understanding the current strength of USDJPY, as it provides a fundamental reason for the yen's depreciation relative to currencies backed by more hawkish central banks.
The divergence in central bank policy is the bedrock of this move. Until the BOJ signals a significant shift away from its ultra-loose stance, expect the yen to remain under pressure, supporting USDJPY's climb. The $162.43 resistance is a key battleground, but the fundamental picture suggests potential for further upside if this level is breached decisively.
Geopolitical Storm Clouds Gathering: Middle East Tensions and Their Ripple Effects
Adding another layer of complexity to the global financial landscape are the escalating tensions in the Middle East. Reports of halted attacks between the U.S. and Iran, following weeks of heightened conflict, have temporarily eased immediate fears of a broader escalation. However, the underlying fragility of the region remains a significant risk factor. Oil prices, a key indicator of geopolitical stability, have seen volatility. While prices plunged by over 5% in early Asian trade on Monday after the U.S. and Iran halted attacks, as reported by Reuters, the market is acutely aware of how quickly situations can change. Brent crude, for instance, is trading around $83.79, and WTI is near $79.59, reflecting this uncertainty.
The impact of Middle East tensions on global markets is far-reaching. Higher oil prices, a potential consequence of regional instability, can reignite inflation concerns. This was seen recently with soaring jet fuel costs affecting airlines, as reported by CNBC, a direct consequence of hostilities in the Middle East. Such inflationary pressures could complicate the decision-making process for central banks, particularly the Federal Reserve, as they weigh the need to control inflation against the risk of stifling economic growth. For USDJPY, this translates into increased volatility and a potential flight to perceived safe-haven assets, though the yen's status as a safe haven is currently being tested by its own fundamental weaknesses.
The complex interplay between oil prices, inflation, and central bank policy creates a challenging environment for traders. While a de-escalation in the Middle East might offer temporary relief, the underlying risks persist. This geopolitical uncertainty often leads to increased demand for the US dollar as a safe haven, further bolstering USDJPY. However, it also introduces a degree of caution into market sentiment, potentially limiting aggressive risk-on trades and keeping volatility elevated across all asset classes. The market's reaction to these developments will be closely watched, as any renewed flare-up could swiftly alter risk appetite and currency valuations.
The situation in the Middle East remains a critical wildcard. While recent reports suggest a de-escalation, the potential for renewed conflict poses a significant risk to global energy markets and inflation expectations. Any escalation could trigger a flight to safety, potentially boosting the dollar and impacting USDJPY, but also introducing broader market instability.
Technical Landscape: USDJPY at the Crossroads
Turning to the charts, USDJPY presents a compelling technical picture, albeit one with conflicting signals across different timeframes. On the 1-hour chart, the pair is consolidating near resistance at $162.43. The RSI(14) at 66.56 indicates a neutral but rising momentum, while the Stochastic oscillator, with K at 92.72 and D at 88.92, is firmly in overbought territory, flashing a potential warning of a short-term pullback. The MACD is positive, suggesting upward momentum, but the ADX at 19.33 points to a weak trend, indicating that the current move might lack strong conviction.
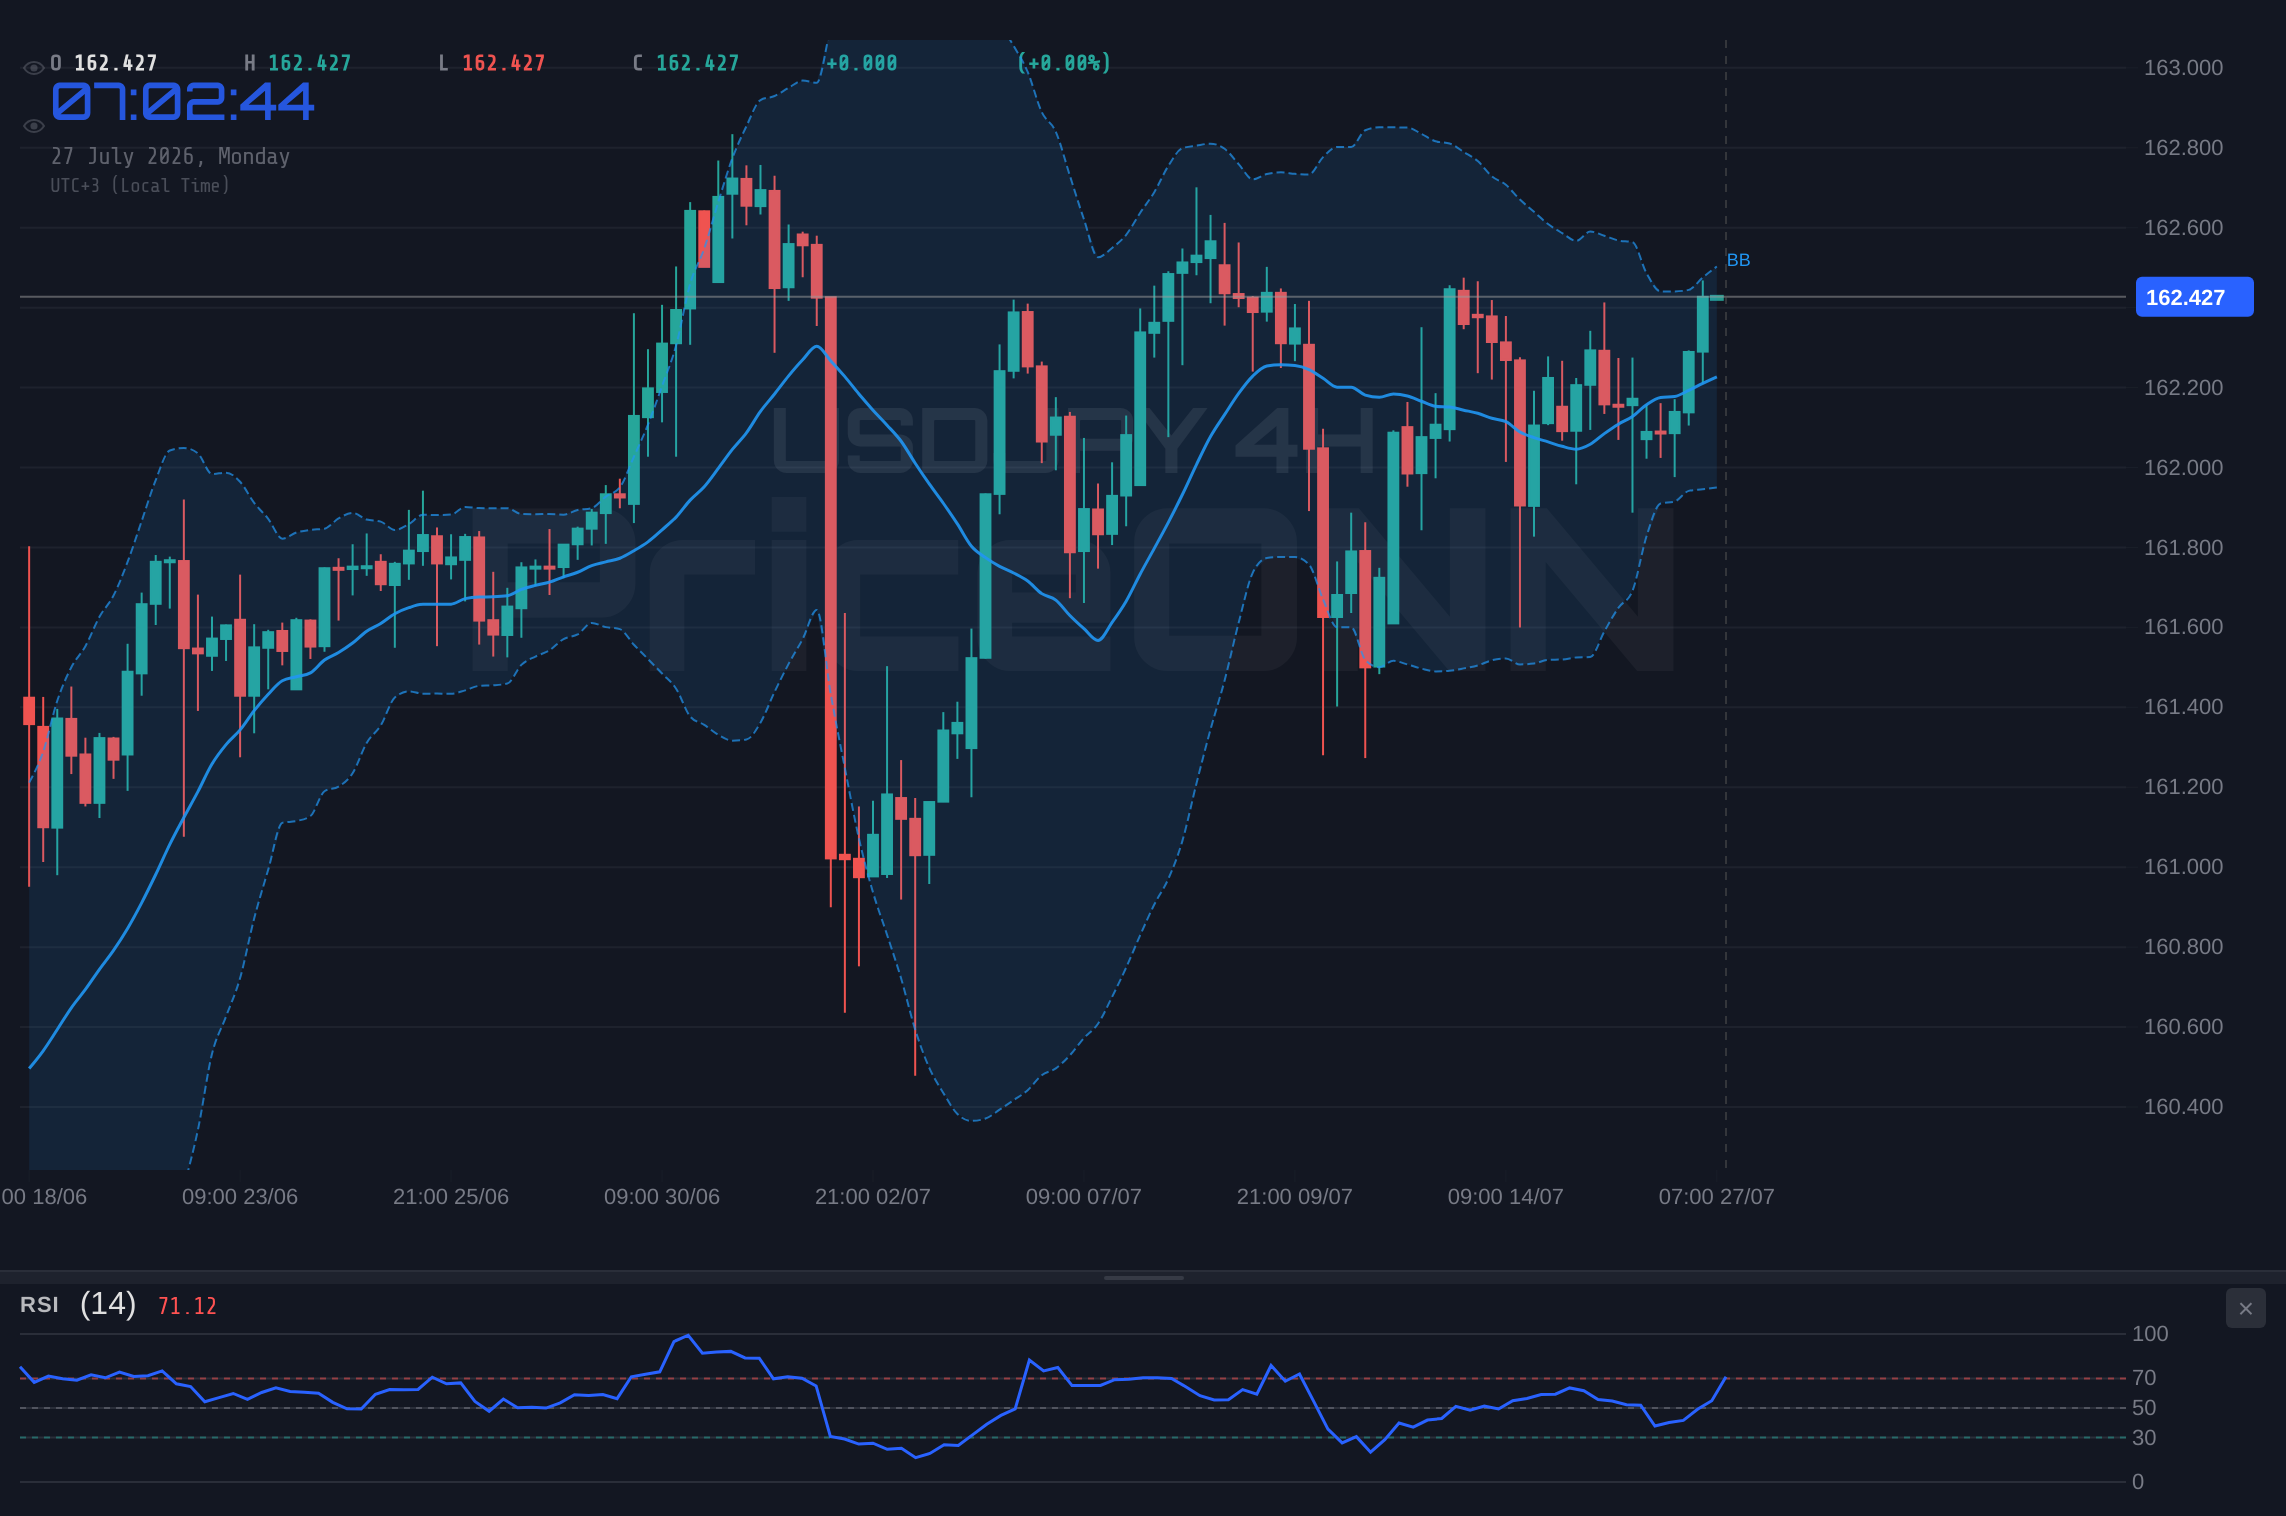
However, delving into the 4-hour timeframe paints a more bullish picture. The trend is clearly defined as bullish with a strength of 95%. The RSI(14) at 58.89 sits comfortably in neutral territory, showing room for further upside, and the MACD is positive with its signal line below. The Stochastic shows a bullish signal (%K > %D), reinforcing the upward bias. While the ADX at 20.71 still suggests a moderate trend strength, it's indicative of a sustained move. The support levels at 162.165 and 162.041 are crucial for maintaining this bullish posture.
The daily chart reinforces the long-term bullish trend, with a strength of 79%. The RSI(14) at 60.52 is in the upper neutral zone, and the Stochastic (K=78.93, D=75.09) shows a bullish signal, indicating potential for further appreciation. The MACD is positive, though its histogram is slightly below the signal line, suggesting a possible moderation in momentum. Crucially, the ADX at 18.76, while indicating a weak trend, is in an environment where prices have been consistently rising. The key resistance levels on the daily chart are $162.428, $162.683, and $162.954. A decisive break above $162.43 could open the door for a test of these higher levels.
The interplay between these timeframes highlights a current consolidation phase near resistance, but the underlying trend on medium to longer timeframes remains bullish. The divergence in signals, particularly the overbought Stochastic on the 1-hour chart versus the bullish undertones on the 4-hour and daily charts, suggests that a short-term pullback is possible before the next leg higher. Traders are watching closely to see if the $162.43 resistance can be decisively broken, which would likely confirm the continuation of the bullish trend.
"The charts are telling a story of persistent dollar strength against a structurally weak yen. While short-term overbought conditions might lead to a pause, the macro picture and longer-term technicals favor further upside as long as key support levels hold."
Market Correlations and Sentiment: A Broader View
Understanding USDJPY's movements requires looking beyond the pair itself and examining its correlations with other major markets. The DXY's current strength around 100.7 is a primary driver. As the dollar index rises, it typically exerts downward pressure on assets like gold (XAUUSD) and silver (XAGUSD), which are currently trading lower, reflecting this risk-off sentiment in certain asset classes. Gold, for instance, is down 1.46% at $4001.21, and silver has fallen 2.73% to $56.16. This inverse relationship between the dollar and precious metals often indicates a shift in risk appetite, where investors favor the perceived safety of the dollar over commodities.
Conversely, major stock indices like the S&P 500 (SP500) and Nasdaq 100 (Nasdaq100) are showing mixed signals. The SP500 is up 0.74% at 6572.87, suggesting some resilience in risk appetite, while the Nasdaq 100 has fallen 1.16% to 29164.86, indicating a more cautious sentiment in the tech sector. This divergence within equities can create a complex risk environment. Generally, a falling Nasdaq might suggest a move away from riskier assets, which could theoretically benefit safe havens like the yen. However, the yen's fundamental weakness is currently overriding this correlation, demonstrating the power of monetary policy divergence.
The energy markets, particularly oil, are also playing a crucial role. With Brent crude around $83.79 and WTI at $79.59, prices have seen some pullback after recent geopolitical escalations. However, the underlying supply-demand dynamics, coupled with the potential for further Middle East disruptions, keep oil prices elevated and a source of inflationary concern. This persistent inflation risk keeps the Federal Reserve in a hawkish stance, indirectly supporting the dollar and, by extension, USDJPY. The market is keenly watching how these correlated markets react to upcoming economic data and geopolitical developments, as they provide vital clues about overall risk sentiment and potential shifts in currency valuations.
The current market environment is characterized by a strong dollar driven by Fed policy expectations and geopolitical risk premiums affecting oil. While the Nasdaq shows some weakness, the S&P 500 remains resilient, creating a mixed risk sentiment. This complexity means that USDJPY's upward trend is primarily driven by fundamental currency dynamics rather than broad risk-on or risk-off sentiment alone.
Upcoming Events and Their Potential Impact
The coming week is pivotal, with several key economic events and central bank meetings on the horizon that could significantly influence USDJPY. The Federal Reserve's upcoming meeting, even if it's expected to hold rates steady, will be scrutinized for any hints of future policy direction. Market participants will be dissecting statements for clues about inflation outlooks and potential shifts in tightening or easing bias. As noted in economic forecasts, any indication of a more hawkish stance from the Fed could further bolster the dollar, potentially pushing USDJPY above its current resistance levels. Conversely, any dovish rhetoric, however unlikely, could provide temporary relief for the yen.
Similarly, the market will be closely watching any signals from the Bank of Japan. While a policy shift is not widely anticipated in the immediate term, any subtle change in language or forward guidance could have a profound impact on the yen. Given the yen's historical weakness and the current geopolitical backdrop, any indication of a less accommodative stance would be a significant development. However, the prevailing view remains that the BOJ will continue its ultra-loose policy for the foreseeable future, which underpins the bearish outlook for the yen against the dollar.
Beyond central banks, other economic data releases will also play a crucial role. Inflation reports, employment figures, and manufacturing data from both the US and Japan will provide a clearer picture of economic health and inform monetary policy expectations. For instance, stronger-than-expected US inflation data could reinforce the Fed's hawkish stance, while weak Japanese economic data might further pressure the yen. The volatility in oil prices, directly linked to Middle East tensions, also remains a significant factor, potentially influencing inflation expectations and central bank responses. Traders must remain vigilant, as these events can trigger sharp moves in USDJPY, especially around key technical levels like the $162.43 resistance.
The upcoming week is packed with potential market movers. Key events to monitor include the Federal Reserve's policy decision and any commentary on inflation, as well as any subtle shifts from the Bank of Japan. Stronger US economic data or persistent Middle East tensions could further support USDJPY, while any sign of a BOJ policy pivot would be a game-changer for the yen.
Trade Scenarios for USDJPY
Bearish Scenario: Yen Rebound or Resistance Hold
35% ProbabilityNeutral Scenario: Consolidation Near Resistance
10% ProbabilityBullish Scenario: Breakout Above Resistance
55% ProbabilityFrequently Asked Questions: USDJPY Analysis
What happens if USDJPY breaks decisively above the $162.43 resistance level?
A sustained break above $162.43, particularly with strong volume, would likely confirm the continuation of the bullish trend. This could open the door for further upside, targeting resistance levels at $162.683 and potentially $162.954 in the short to medium term.
Is the RSI at 66.56 a sell signal for USDJPY right now?
An RSI of 66.56 on the 1-hour chart suggests rising momentum but is not yet in overbought territory that would typically signal an immediate sell. However, it warrants caution for short-term traders and could indicate a potential for a brief pullback or consolidation before any further upside, especially if other indicators also show overbought conditions.
How will upcoming Fed and BOJ meetings affect USDJPY this week?
The Fed's stance on inflation and potential future policy adjustments will be closely watched. A hawkish tone could further strengthen the dollar and push USDJPY higher. Any unexpected dovish shift from the BOJ, though unlikely, could cause significant yen weakness. The market is primed for volatility around these events, especially near key resistance levels.
Should I consider the bearish scenario if USDJPY fails to break $162.43 resistance?
If USDJPY fails to break above $162.43 and subsequently closes below the 4-hour support at $162.165, the bearish scenario becomes more probable. This would indicate a short-term pullback, with potential targets around $162.041 and $161.977, especially if broader market sentiment turns risk-averse.
Technical Outlook Summary
| Indicator | Value | Signal | Interpretation |
|---|---|---|---|
| RSI (14) | 66.56 | Neutral | Rising momentum, not yet overbought. |
| MACD Histogram | Positive | Bullish | Positive momentum building. |
| Stochastic | K=92.72, D=88.92 | Bearish (Overbought) | Overbought conditions on 1H chart may signal pullback. |
| ADX | 19.33 | Neutral | Weak trend strength on 1H, stronger on longer timeframes. |
| Bollinger | Upper Band | Watch | Price near upper band on 1H, above middle on 4H/1D. |
Key Levels
Track markets in real-time
AI-powered analysis, technical indicators and real-time price data.
Join Our Telegram Channel
Breaking market news, AI analysis and trading signals instantly.
Join Channel