

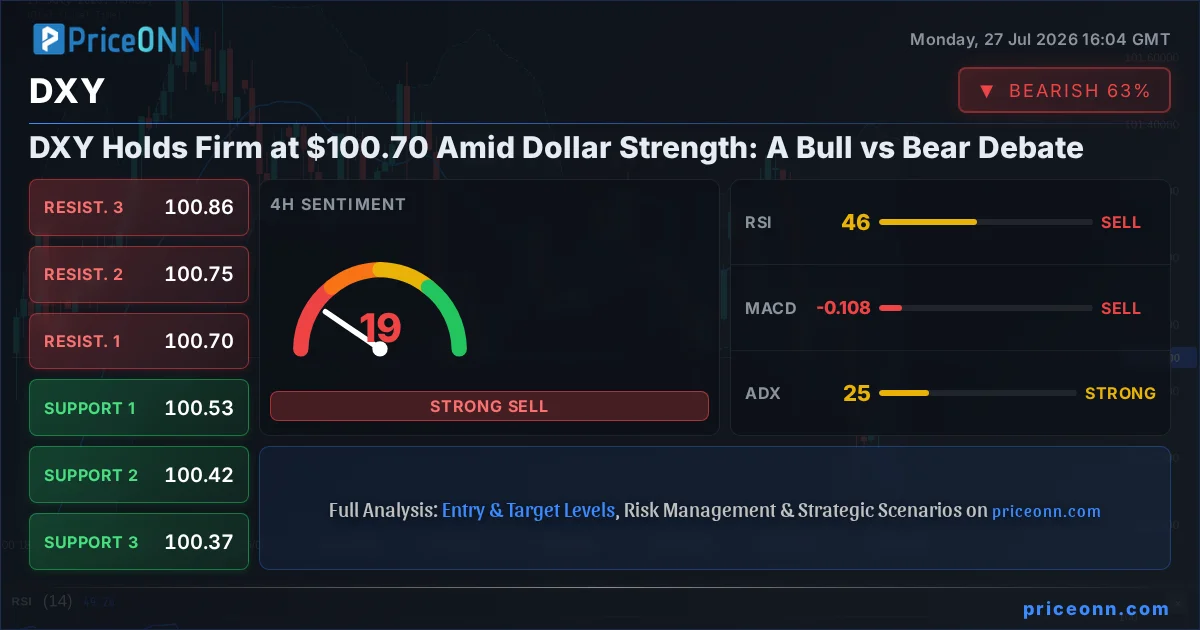
The DXY Dollar Index is currently hovering around the critical $100.70 mark, a level that has become a battleground for bulls and bears alike. As the dollar finds itself at a pivotal juncture, market participants are dissecting every nuance to gauge its immediate future. This analysis delves into the competing forces at play, dissecting the technical indicators, macroeconomic undercurrents, and geopolitical winds that are shaping the narrative around the world's reserve currency.
- The DXY is trading at $100.70, with support at $100.64 and resistance at $100.73 on the 1H chart, indicating tight consolidation.
- RSI at 56.6 signals upward momentum on the 1H, but the 4H RSI at 46.15 suggests a cooling of bullish sentiment, creating a divergence.
- The ADX at 27.71 on the 1H indicates a strong trend, yet the 4H ADX at 25.26 points to a less committed trend, highlighting market indecision.
- With the Fed's July 29 meeting anticipated, upcoming economic data releases and central bank commentary will be crucial in determining the DXY's direction.
The Bull Case: Dollar's Resilience in a Risk-Off World
The argument for continued dollar strength hinges on its traditional role as a safe-haven asset, particularly in an environment where geopolitical tensions and economic uncertainties persist. Recent news reports, such as the acceleration in New Zealand's inflation and potential for further rate hikes by the ECB, even amidst easing Middle East tensions, paint a picture of a global economy grappling with inflationary pressures and divergent monetary policies. In this context, the dollar's inherent stability and liquidity make it an attractive proposition for investors seeking to preserve capital. The DXY's ability to hold the $100.70 level, despite some conflicting signals across different timeframes, underscores this underlying demand. On the 1-hour chart, the RSI reading of 56.6 suggests a positive momentum, and the ADX at 27.71 indicates a reasonably strong trend is in play. This environment often sees capital flow into dollar-denominated assets, providing a foundational support for the index.
Furthermore, the comparative strength of the US economy, even with its own challenges, often stands out against other major economies. While European natural gas prices have plunged, signaling some easing of energy shocks, the underlying inflationary concerns remain. The ECB's hawkish stance, as reinforced by Peter Kazimir, suggests a commitment to taming inflation, which could lead to higher interest rates in the Eurozone. However, the US Federal Reserve's own monetary policy stance, while potentially nearing a pause or pivot, still offers attractive yields relative to many other developed nations. The narrative of higher-for-longer interest rates in the US, even if debated, continues to underpin the dollar's appeal. The DXY's upward movement towards 100.70, supported by positive momentum on shorter timeframes, reflects this ongoing investor preference for dollar assets amidst a complex global economic landscape.
Momentum and Trend Alignment
Looking at the shorter-term technicals, the 1-hour timeframe for the DXY presents a picture of upward momentum. The MACD is positive and above its signal line, suggesting that buying pressure is currently in the ascendancy. The Stochastic Oscillator, with K at 86.15 and D at 82.01, is in overbought territory but shows a rising K% over D%, which can sometimes precede further upward movement before a reversal. While this might signal a short-term overextension, it doesn't immediately negate the bullish sentiment. The Bollinger Bands are also showing the price trading above the middle band, reinforcing the short-term bullish inclination. The ADX at 27.71 on this timeframe indicates a trend of moderate to strong conviction, suggesting that the recent move towards $100.70 is not merely a fleeting fluctuation but part of a more sustained directional push.
This short-term bullish bias is further bolstered by the overall market context. The Nasdaq 100 and S&P 500 indices are showing signs of weakness, with the Nasdaq 100's 1-hour chart indicating a strong downtrend (ADX 33.23) and the S&P 500's 1-day chart also in a downtrend (ADX 47.51). This risk-off sentiment typically drives capital towards safe-haven assets like the US dollar, providing a fundamental tailwind for the DXY. The correlation between risk assets and the dollar is a well-observed phenomenon, and as equities falter, the dollar often benefits. Therefore, the confluence of positive short-term technical signals on the DXY and a broader decline in risk appetite creates a compelling case for dollar bulls.
The Bear Case: Lingering Doubts and Divergent Signals
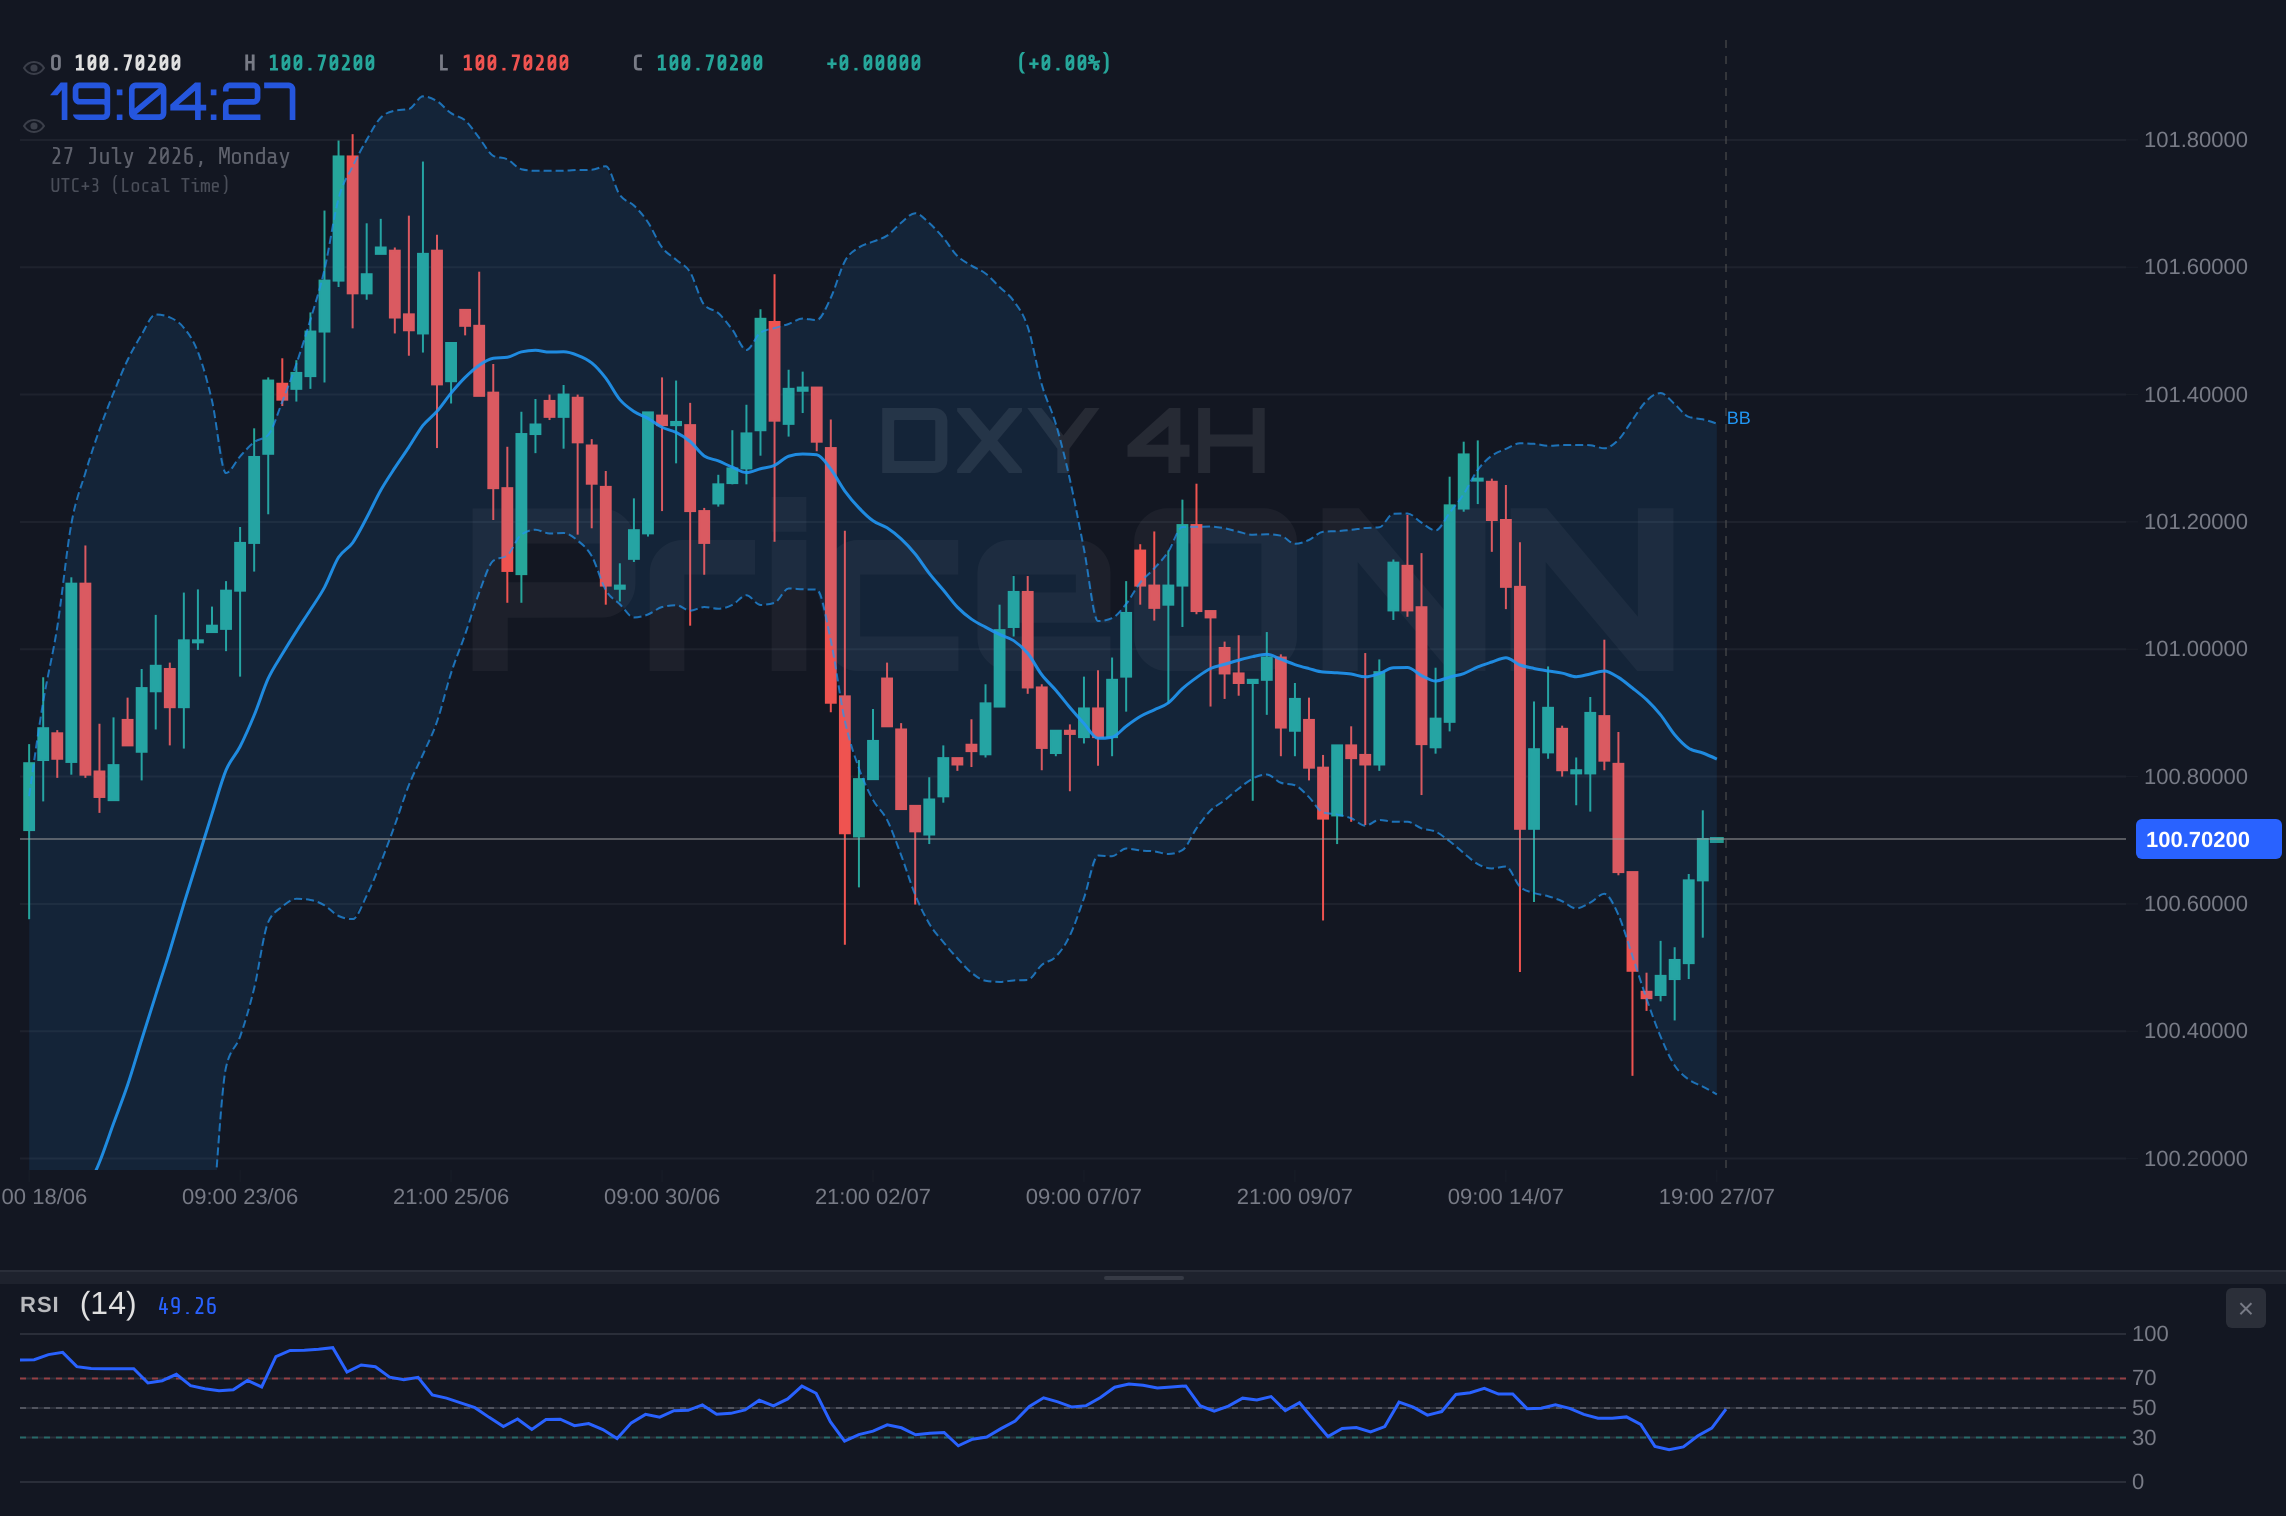
Despite the bullish arguments, a closer inspection reveals significant counter-arguments and conflicting signals that suggest the dollar's current strength might be fragile. The divergence between the 1-hour and 4-hour technical indicators is particularly noteworthy. While the 1-hour chart shows bullish momentum, the 4-hour chart paints a less optimistic picture. The 4-hour RSI stands at 46.15, which is below the neutral 50 level and indicates a bearish trend is developing, contradicting the 1-hour reading. Similarly, the MACD on the 4-hour timeframe is negative and below its signal line, signaling bearish momentum. The Stochastic Oscillator on the 4-hour chart is also in oversold territory with %K below %D, further reinforcing a bearish outlook for this timeframe.
The ADX indicator also presents a mixed bag. While the 1-hour ADX at 27.71 suggests a strong trend, the 4-hour ADX at 25.26 indicates a trend of moderate strength, and the 1-day ADX at 27.03 points to a strong trend but within a broader neutral timeframe. This inconsistency across timeframes suggests that the market is not yet in full agreement on the dollar's direction. The fact that the DXY is trading at $100.70, a level that has seen significant price action, implies a struggle between buyers and sellers. The presence of resistance at $100.73 on the 1-hour chart and $100.75 on the 4-hour chart indicates that breaking above this level will require significant conviction, which the mixed signals may not yet provide.
Macroeconomic Headwinds and Central Bank Watch
From a macroeconomic perspective, the narrative is far from unilaterally bullish for the dollar. While the US economy may appear relatively robust, inflationary pressures remain a concern, and the Federal Reserve's next move is far from certain. The upcoming Fed meeting on July 29 looms large, and any hint of a dovish pivot or a pause in rate hikes could quickly shift market sentiment against the dollar. Traders are keenly awaiting any signals from Fed officials, and the market's reaction to inflation data, such as the recent surge in New Zealand's CPI, highlights the sensitivity to price stability concerns globally. The ECB's hawkish rhetoric, while potentially supportive of the Euro in the long run, also signals ongoing inflation battles in Europe, which could lead to a more volatile environment for all major currencies.
Moreover, the geopolitical landscape, while showing signs of easing tensions in the Middle East with reports of a US-Iran truce, remains a source of underlying uncertainty. Any resurgence of conflict could quickly reignite safe-haven demand for the dollar, but conversely, a sustained period of de-escalation could reduce this demand. The recent plunge in European natural gas prices, while positive for European inflation outlooks, also reflects a shifting energy market dynamic that could have broader implications. The Singapore dollar's monetary policy tightening, managing exchange rates to combat inflation, is another example of how diverse global economic responses can create complex cross-currency movements. The dollar's strength is not solely a function of US domestic policy but also a reflection of relative global economic health and perceived risks.
Conflicting Technical Indicators and Range-Bound Uncertainty
The technical indicators on the DXY present a clear picture of divergence and potential range-bound trading. On the 1-hour chart, the Stochastic Oscillator shows a bullish signal (%K > %D), but it's deep in overbought territory (K=86.15, D=82.01). This suggests that the upward momentum might be exhausted, and a pullback is likely. The Bollinger Bands on the 1-hour chart are also showing the price hugging the upper band, indicating potential for a reversal. On the 4-hour chart, the Stochastic is giving a bearish signal (%K
The ADX values across different timeframes also tell a story of conflicting trends. While the 1-hour ADX suggests a strong trend, the 4-hour and daily ADX values (25.26 and 27.03 respectively) indicate a more moderate trend strength, or even a sideways market. This means that while there might be short-term directional moves, the longer-term trend is not decisively established. The DXY's trading range, with support at $100.64 and resistance at $100.73 on the 1-hour, and similar tight ranges on the 4-hour and daily charts, points towards consolidation. This lack of clear directional conviction from the indicators suggests that the DXY might be stuck in a range until a significant catalyst emerges, such as the upcoming Fed meeting or a major geopolitical development.
Market Correlations and Intermarket Dynamics
Understanding the DXY's movements requires looking beyond its own charts and examining its relationship with other major markets. The inverse correlation between the DXY and gold prices (XAUUSD) is a classic example. With XAUUSD currently trading at $4001.21 and showing a bearish trend on multiple timeframes (1D ADX at 39.16), a strengthening dollar typically exerts downward pressure. However, recent news suggesting gold shining amid eased Middle East tensions and falling oil prices indicates that safe-haven demand for gold can sometimes decouple from dollar strength, especially if inflation fears resurface. The current data shows XAUUSD in a bearish trend across timeframes, with RSI readings below 40, suggesting that dollar strength is indeed a contributing factor to gold's decline.
The relationship with equity indices like the S&P 500 (currently at 6572.87) and Nasdaq 100 (at 29164.86) is also crucial. Both indices exhibit mixed signals, but the 1-day charts show a downtrend for the S&P 500 and Nasdaq 100, with ADX values of 47.51 and 47.51 respectively, indicating strong downtrends. This risk-off environment generally favors the dollar as a safe haven. However, the short-term bullishness in the S&P 500 (1-hour ADX 49.72) and Dow Jones 30 (1-hour ADX 8.29) suggests localized buying interest or short-covering rallies within broader downtrends. These fluctuations in risk appetite create volatility for the dollar, as it can benefit from broad risk aversion but also face headwinds if specific equity sectors show resilience.
Forex pairs also provide critical context. The EUR/USD is trading at 1.14436, with mixed signals across timeframes, suggesting consolidation. The DXY's strength, if sustained, would naturally exert downward pressure on EUR/USD. Similarly, USD/JPY at 162.429 shows a strong bullish trend on the 4-hour (ADX 20.71) and 1-hour (ADX 19.33) charts, indicating that the dollar's strength is also being reflected against the Japanese Yen, despite potential interventions or policy shifts from the Bank of Japan. GBP/USD at 1.34773 and AUD/USD at 0.69991 are also showing bearish tendencies on shorter timeframes, aligning with a stronger dollar narrative, although their longer-term trends are mixed. The interplay between these currency pairs and the DXY highlights the dollar's pervasive influence across global financial markets.
The Verdict: A Tightrope Walk at $100.70
The DXY's current position at $100.70 is a testament to the opposing forces at play in the currency markets. While the dollar benefits from its safe-haven status amidst global uncertainties and shows positive momentum on shorter timeframes, conflicting signals across different timeframes and macroeconomic headwinds introduce significant doubt about its sustained strength. The divergence in RSI and MACD readings between the 1-hour and 4-hour charts, coupled with the moderate ADX values on longer timeframes, suggests that the market is currently indecisive. The tight trading ranges observed, with resistance at $100.73 and $100.75, indicate that a clear breakout requires substantial conviction.
The upcoming Fed meeting on July 29 is the most significant near-term catalyst. Any indication of a shift in monetary policy, whether dovish or hawkish, could decisively break the current stalemate. Until then, the DXY may continue to trade within a range, with significant support at $100.64 and resistance at $100.73 on the 1-hour chart. The broader risk sentiment, influenced by equity market performance and geopolitical developments, will also play a crucial role. For traders, this environment calls for caution and a focus on risk management. Waiting for clearer signals from the Fed or a decisive break of key technical levels is likely the prudent approach.
Bearish Scenario: Dollar Loses Steam
60% ProbabilityNeutral Scenario: Consolidation Around $100.70
25% ProbabilityBullish Scenario: Dollar Breaks Higher
15% ProbabilityFrequently Asked Questions: DXY Analysis
What happens if DXY breaks below $100.64 support?
A break below the 1-hour support at $100.64 would likely trigger further selling, potentially targeting the $100.54 level. This scenario is supported by the bearish divergence seen on the 4-hour RSI and MACD.
Should I buy DXY at current levels of $100.70 given the mixed signals?
Buying at $100.70 presents a risk due to conflicting indicators. The 1-hour chart shows bullish momentum (RSI 56.6), but the 4-hour chart indicates weakness (RSI 46.15). A prudent approach would be to wait for confirmation above $100.75 resistance or a clear break below $100.64 support, with a 60% probability favoring a bearish move.
Is the RSI at 56.6 a buy signal for DXY on the 1-hour chart?
An RSI of 56.6 on the 1-hour chart indicates upward momentum, which is generally considered bullish in the short term. However, it's crucial to consider the context of other indicators and timeframes; the 4-hour RSI at 46.15 suggests underlying weakness that tempers this bullish signal.
How will the upcoming Fed meeting affect DXY this week?
The Federal Reserve's meeting on July 29 is a critical event. Hawkish commentary could push DXY above $100.75 towards $100.86, while dovish signals might lead to a break below $100.64, targeting $100.54. Market participants will be scrutinizing any statements for clues on future interest rate policy.
Technical Outlook Summary
| Indicator | Value | Signal | Interpretation |
|---|---|---|---|
| RSI (14) | 56.6 | Bullish | Positive momentum on 1H, but neutral on 4H. |
| MACD Histogram | Positive | Bullish | Short-term buying pressure. |
| Stochastic | K: 86.15, D: 82.01 | Bearish | Overbought on 1H, suggesting pullbacks. |
| ADX | 27.71 | Bullish | Strong trend on 1H, moderate on 4H. |
| Bollinger Bands | Upper Band | Watch | Price near upper band on 1H, potential reversal. |
Key Levels
Track markets in real-time
AI-powered analysis, technical indicators and real-time price data.
Join Our Telegram Channel
Breaking market news, AI analysis and trading signals instantly.
Join Channel