

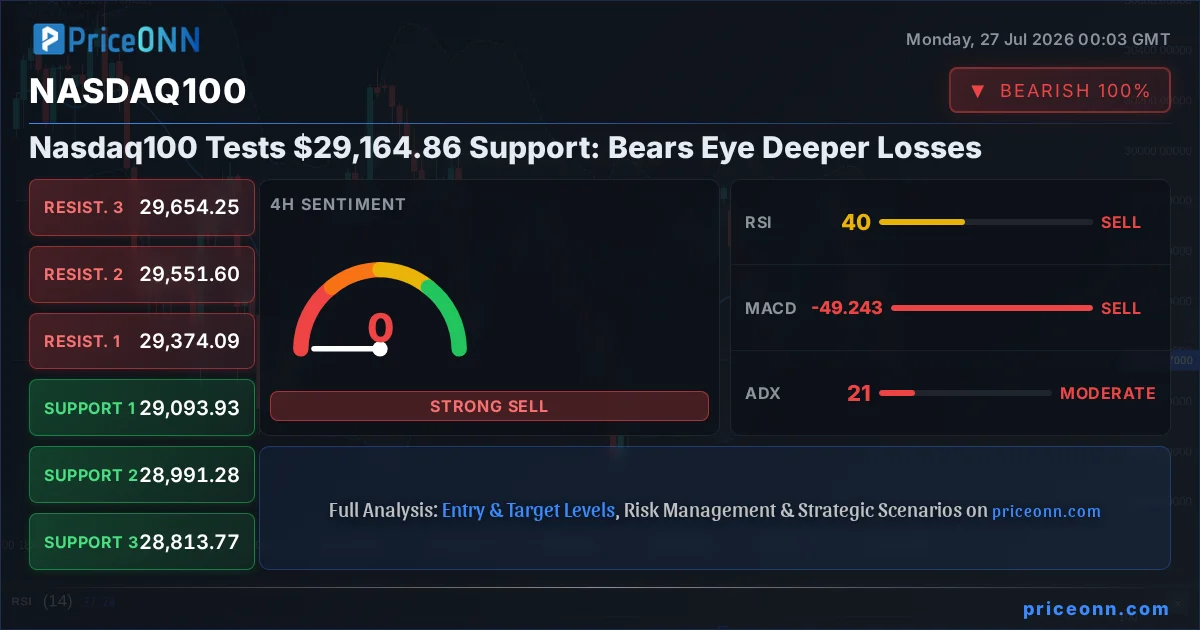
The Nasdaq100 index is currently teetering at a crucial juncture, hovering around the $29,164.86 mark. This level represents a significant test of support, and the prevailing technical indicators paint a decidedly bearish picture. As traders and investors digest the latest market data, the question on everyone's mind is whether this support will hold, or if the index is poised for further declines. The interplay between various technical signals across multiple timeframes offers a complex, yet potentially revealing, outlook.
- RSI at 32.77 signals increasing bearish momentum, approaching oversold territory but still trending down.
- Critical support sits at $29,135.55 (S1), tested multiple times in the 1H timeframe.
- MACD histogram shows negative momentum on the 1H and 4H charts, indicating selling pressure.
- The correlation with a strengthening dollar (DXY at 100.7) adds to the headwinds for risk assets like the Nasdaq100.
Navigating the Sell-Off: A Technical Deep Dive
The current trading environment for the Nasdaq100 is undeniably challenging. The index has shed considerable ground, and the pressure is palpable across multiple timeframes. On the 1-hour chart, the trend is firmly entrenched in bearish territory, with a strength of 92%. This suggests that short-term dynamics are heavily skewed towards sellers. The ADX, a measure of trend strength, stands at 33.23, confirming a robust downward move. This isn't just a minor pullback; it's a significant bearish trend that demands attention from all market participants. The proximity to the first support level at $29,135.55 is a key focal point. A break below this level could accelerate the selling pressure, potentially triggering further downside towards the $29,076.62 mark.
Digging deeper into the indicators, the RSI(14) on the 1-hour chart sits at 32.77. While this is approaching oversold conditions, the overall trend is still downwards, indicating that further weakness is possible before any meaningful bounce. The MACD reinforces this bearish sentiment, with its histogram firmly in negative territory and the MACD line below the signal line. This confluence of negative signals suggests that momentum is firmly with the bears in the immediate term. The Stochastic Oscillator, while showing a K > D crossover (30.97 vs 20.52), is still within a zone that could precede further declines, rather than signaling an imminent reversal. This mixed signal from the Stochastic adds a layer of complexity, suggesting that while a short-term bounce might be on the cards, the overarching trend remains bearish.
The 4-Hour Chart: Confirming the Downtrend
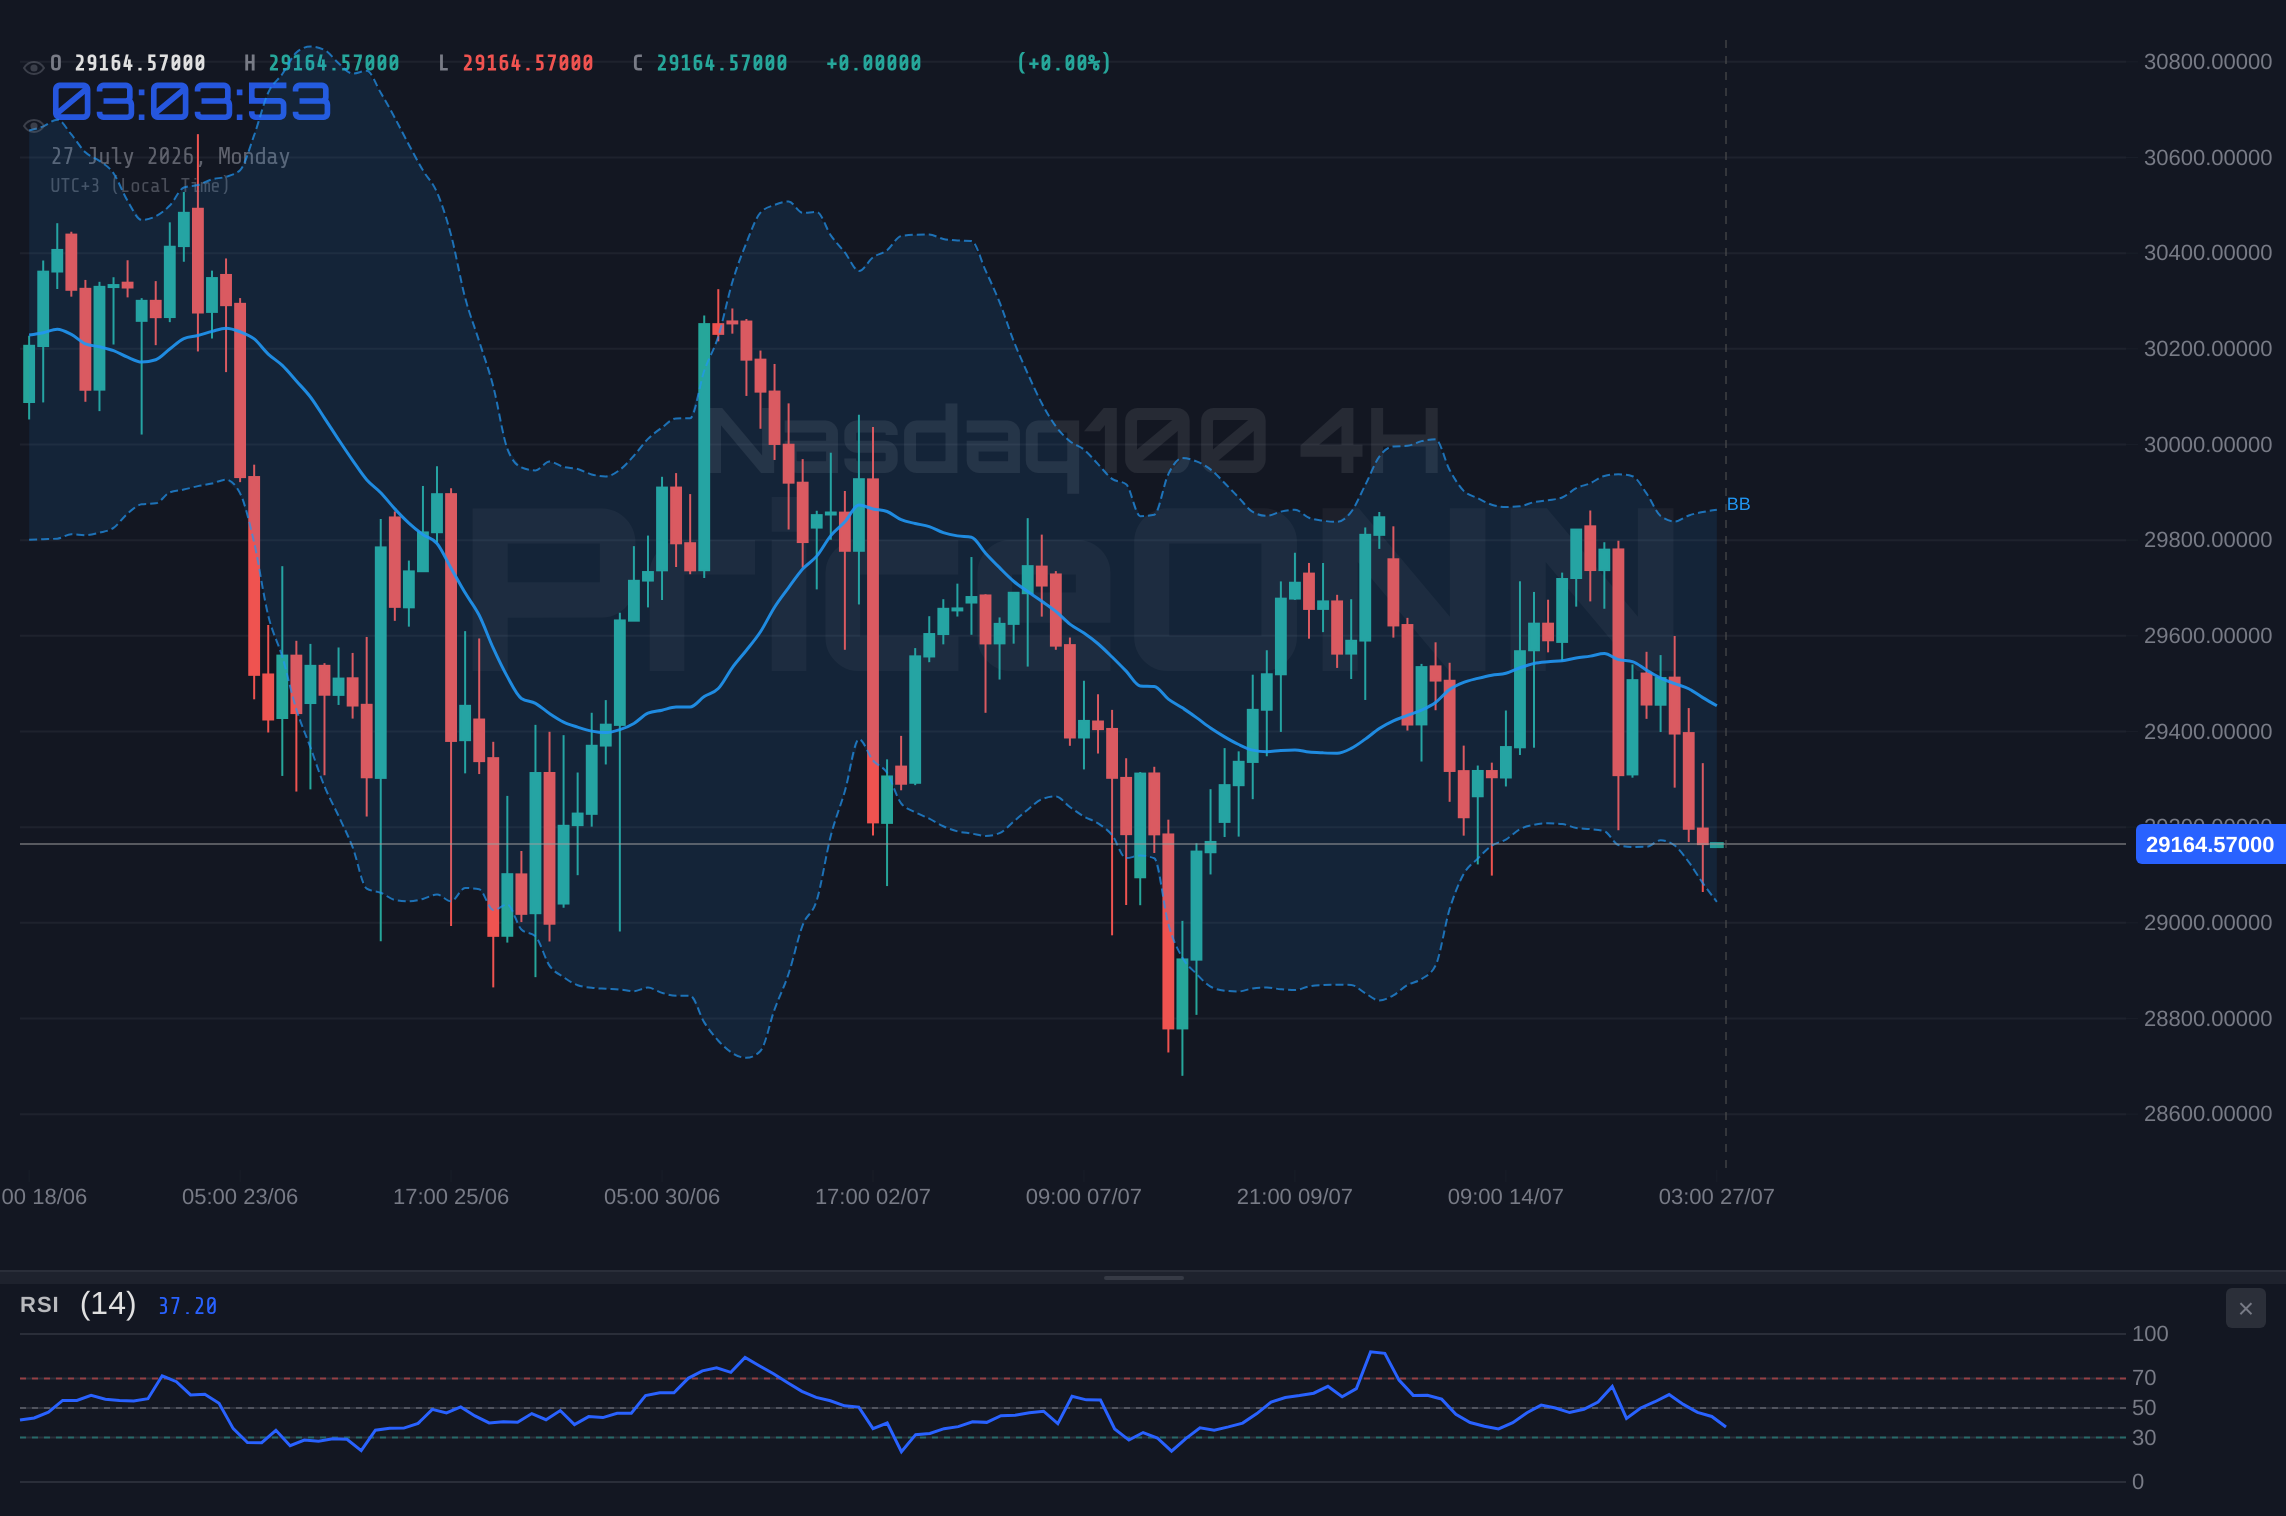
Shifting our focus to the 4-hour timeframe, the picture solidifies the bearish narrative. While the trend is currently classified as 'Neutral' with 50% strength, the underlying signals are predominantly negative. The ADX here is at 21.06, indicating a moderately strong trend, but the overall market sentiment is leaning towards caution. The MACD histogram is negative, and the MACD line remains below its signal line, a classic indication of bearish momentum. This aligns with the bearish sentiment seen on the shorter timeframe and suggests that the pressure is not just a fleeting 1-hour phenomenon.
The RSI(14) on the 4-hour chart reads 39.92, reinforcing the idea that the index is in a downtrend and has room to fall before hitting oversold territory. The Stochastic Oscillator is showing a clear bearish signal, with K (15.62) below D (35.37), suggesting further downside potential. Bollinger Bands are also positioned below the middle band, indicating downward pressure. The key support levels on this timeframe are $29,093.93, $28,991.28, and $28,813.77. A decisive break below $29,093.93 would be a significant bearish confirmation, opening the door for a test of the lower support levels. The general signal for the 4-hour chart is 'SELL', underscoring the prevailing bearish sentiment.
Daily Perspective: A Wider Bearish Trend
On the daily chart, the Nasdaq100 exhibits a strong bearish trend, with a trend strength of 83%. This longer-term perspective is crucial for understanding the potential depth and duration of any current decline. The ADX at 15.12 suggests a weaker trend on this timeframe, which might imply that the current momentum could be part of a larger consolidation phase rather than a full-blown bear market. However, the RSI(14) at 46.36 indicates that the index is moving away from neutral territory and is under pressure, but still has significant room to fall before reaching oversold conditions. This suggests that any potential for a bounce is still some way off.
The MACD on the daily chart presents a confusing picture, showing negative momentum with the MACD line below the signal line, yet it is above the zero line. This divergence between the histogram and the zero line could indicate weakening bearish momentum, or it might simply reflect the current price action. The Stochastic Oscillator, however, provides a bullish signal with K (58.96) above D (53.46), suggesting that a potential upward correction might be brewing on the daily timeframe. Yet, this is counteracted by the Bollinger Bands, which are positioned below the middle band, signaling a bearish bias. The predominant 'SELL' signal on this timeframe, despite some conflicting indicators, highlights the overall bearish sentiment that currently grips the index. The daily support levels are identified at $29,179.85, $28,852.38, and $28,511.31. A close below $29,179.85 would confirm the bearish trend on this timeframe.
The Dollar's Grip and Equity Correlation
The performance of the Nasdaq100 is intrinsically linked to broader market forces, and the current strength of the US Dollar Index (DXY) cannot be ignored. With the DXY currently trading at 100.70, its upward trajectory is placing significant headwinds on riskier assets. A stronger dollar typically makes US equities, including the Nasdaq100, more expensive for foreign investors, potentially dampening demand. Furthermore, the inverse correlation between the dollar and commodities like gold is well-established, and this often extends to a broader risk-off sentiment that can impact equities. As the DXY shows positive momentum on the 1-hour and neutral on the daily, it reinforces the bearish outlook for the Nasdaq100.
The correlation between the Nasdaq100 and its tech-heavy components is also a critical factor. While specific news regarding individual tech stocks or sectors isn't provided, the general trend in major indices like the SP500 and Nasdaq100 itself provides context. The SP500 is showing a mixed picture, with a strong 1H trend but a bearish daily outlook. This suggests a broader market reticence towards risk assets. The Nasdaq100's own decline, with its 1H and 1D charts showing strong bearish trends, indicates that the tech sector is a significant contributor to the current market weakness. This interconnectedness means that any improvement in broader market sentiment or a shift in the dollar's trajectory could have a magnified impact on the Nasdaq100.
Geopolitical Tensions and Fed Speculation: While not explicitly detailed in the provided data, ongoing geopolitical uncertainties and speculation surrounding future Federal Reserve monetary policy continue to be significant macro drivers. Any unexpected shifts in inflation data or central bank communications could rapidly alter the risk appetite and impact indices like the Nasdaq100. Traders should remain vigilant to global news flow.
Trade Scenarios: Mapping the Path Forward
Bearish Scenario: The Descent Continues
65% ProbabilityNeutral Scenario: Consolidation Around Support
25% ProbabilityBullish Scenario: A Bounce from Support
10% ProbabilityThe Road Ahead: What to Watch
Looking ahead, the Nasdaq100 remains at a critical juncture. The prevailing bearish technical signals across multiple timeframes suggest that the path of least resistance is to the downside. The key support level at $29,135.55 on the 1-hour chart is the immediate focus. A failure to hold this level could trigger a cascade of selling, targeting lower levels as outlined in the bearish scenario. The strength of the Dollar Index at 100.7 also adds to the pressure, creating a challenging environment for risk assets.
However, markets are rarely linear. The presence of conflicting signals, such as the Stochastic's potential for a bounce on the 1-hour chart and the daily Stochastic showing a bullish divergence, means that a sharp reversal cannot be entirely ruled out, albeit with lower probability. Traders should pay close attention to the volume accompanying any price movements. A significant increase in volume on a breakdown below support would confirm the bears' control, while a surge in volume on a bounce from current levels could signal a potential short-covering rally.
Frequently Asked Questions: Nasdaq100 Analysis
What happens if Nasdaq100 breaks below the $29,135.55 support level?
If the Nasdaq100 closes decisively below $29,135.55 on the 1-hour chart, it would confirm the bearish trend. This could lead to a rapid decline, with the next significant support target at $29,076.62, followed by $28,991.28.
Is the current RSI reading of 32.77 a buy signal for Nasdaq100 at $29,164.86?
While an RSI of 32.77 is approaching oversold territory, it is not a direct buy signal in this context. The overall trend remains bearish, and the RSI is still trending downwards. A sustained hold above critical support and confirmation from other indicators would be needed before considering a long position.
How does the MACD signal at negative momentum affect the Nasdaq100 trend analysis?
A negative MACD histogram and the MACD line below the signal line on the 1-hour and 4-hour charts indicate bearish momentum. This suggests that selling pressure is dominant, reinforcing the downward trend and making a bullish reversal less likely in the short term.
How will the current DXY strength at 100.7 impact Nasdaq100's price action this week?
The strengthening US Dollar Index (DXY) at 100.7 typically exerts downward pressure on risk assets like the Nasdaq100. This is due to increased costs for foreign investors and a general risk-off sentiment. A sustained DXY rally could exacerbate the bearish trend in the Nasdaq100.
Track markets in real-time
AI-powered analysis, technical indicators and real-time price data.
Join Our Telegram Channel
Breaking market news, AI analysis and trading signals instantly.
Join Channel