

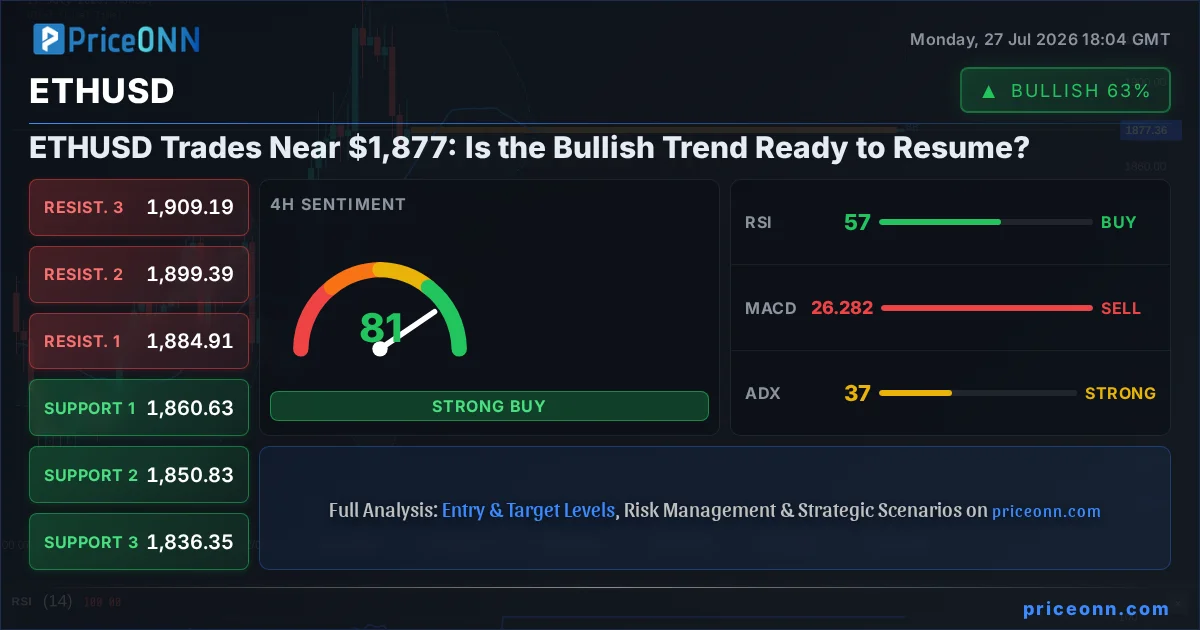
ETHUSD is currently navigating choppy waters, trading precariously near the $1,877.38 mark. This level represents a crucial pivot point, where the prevailing bullish sentiment faces increasing headwinds from mixed technical indicators and broader market correlations. As traders eye potential shifts, understanding the nuanced signals from RSI, MACD, and ADX across various timeframes becomes paramount to deciphering ETHUSD's next significant move. The question on everyone's mind is whether the recent consolidation is a prelude to a renewed upward push or a precursor to a deeper correction.
- ETHUSD is currently trading at $1,877.38, a critical level for the ongoing bullish trend.
- The 4-hour chart shows a strong bullish trend (94% strength) with ADX at 37.06, but the 1-hour chart signals caution with a neutral trend and ADX at 29.09.
- RSI across timeframes is mostly above 50, suggesting underlying bullish momentum, but the 1-hour RSI at 39.48 indicates selling pressure.
- Key support for ETHUSD is identified at $1,868.34, while resistance looms at $1,891.84 on the 1-hour timeframe.
- The strengthening DXY (currently at 100.7) and a mixed S&P 500 performance (up 0.74% to 6572.87) add external pressure, potentially impacting ETHUSD's trajectory.
Navigating the ETHUSD Price Action at $1,877
The $1,877.38 price point for ETHUSD is more than just a number; it's a battleground where bulls and bears are currently locked in a tense standoff. While the daily chart still paints a picture of a dominant bullish trend, with an ADX reading of 22.66 indicating a moderately strong upward move, the shorter timeframes are flashing warning signs. The 1-hour chart, in particular, presents a mixed bag. Its neutral trend status (50% strength) and a relatively weaker ADX of 29.09 suggest that the immediate momentum might be waning. This divergence between the longer-term bullish conviction and the short-term indecision is precisely where astute traders focus their attention, looking for confirmation before committing to a direction.
The immediate support zone on the 1-hour chart is clustered around $1,868.34, followed by $1,856.83. A decisive break below these levels could signal a short-term bearish reversal, potentially testing the psychological $1,800 handle. Conversely, resistance is firmly placed at $1,891.84, with further hurdles at $1,903.83 and $1,915.34. A sustained push above these resistance levels would be necessary to reignite broader bullish confidence and target higher price points. The current price action around $1,877.38 highlights the critical nature of this consolidation phase.
Technical Indicators: A Symphony of Mixed Signals
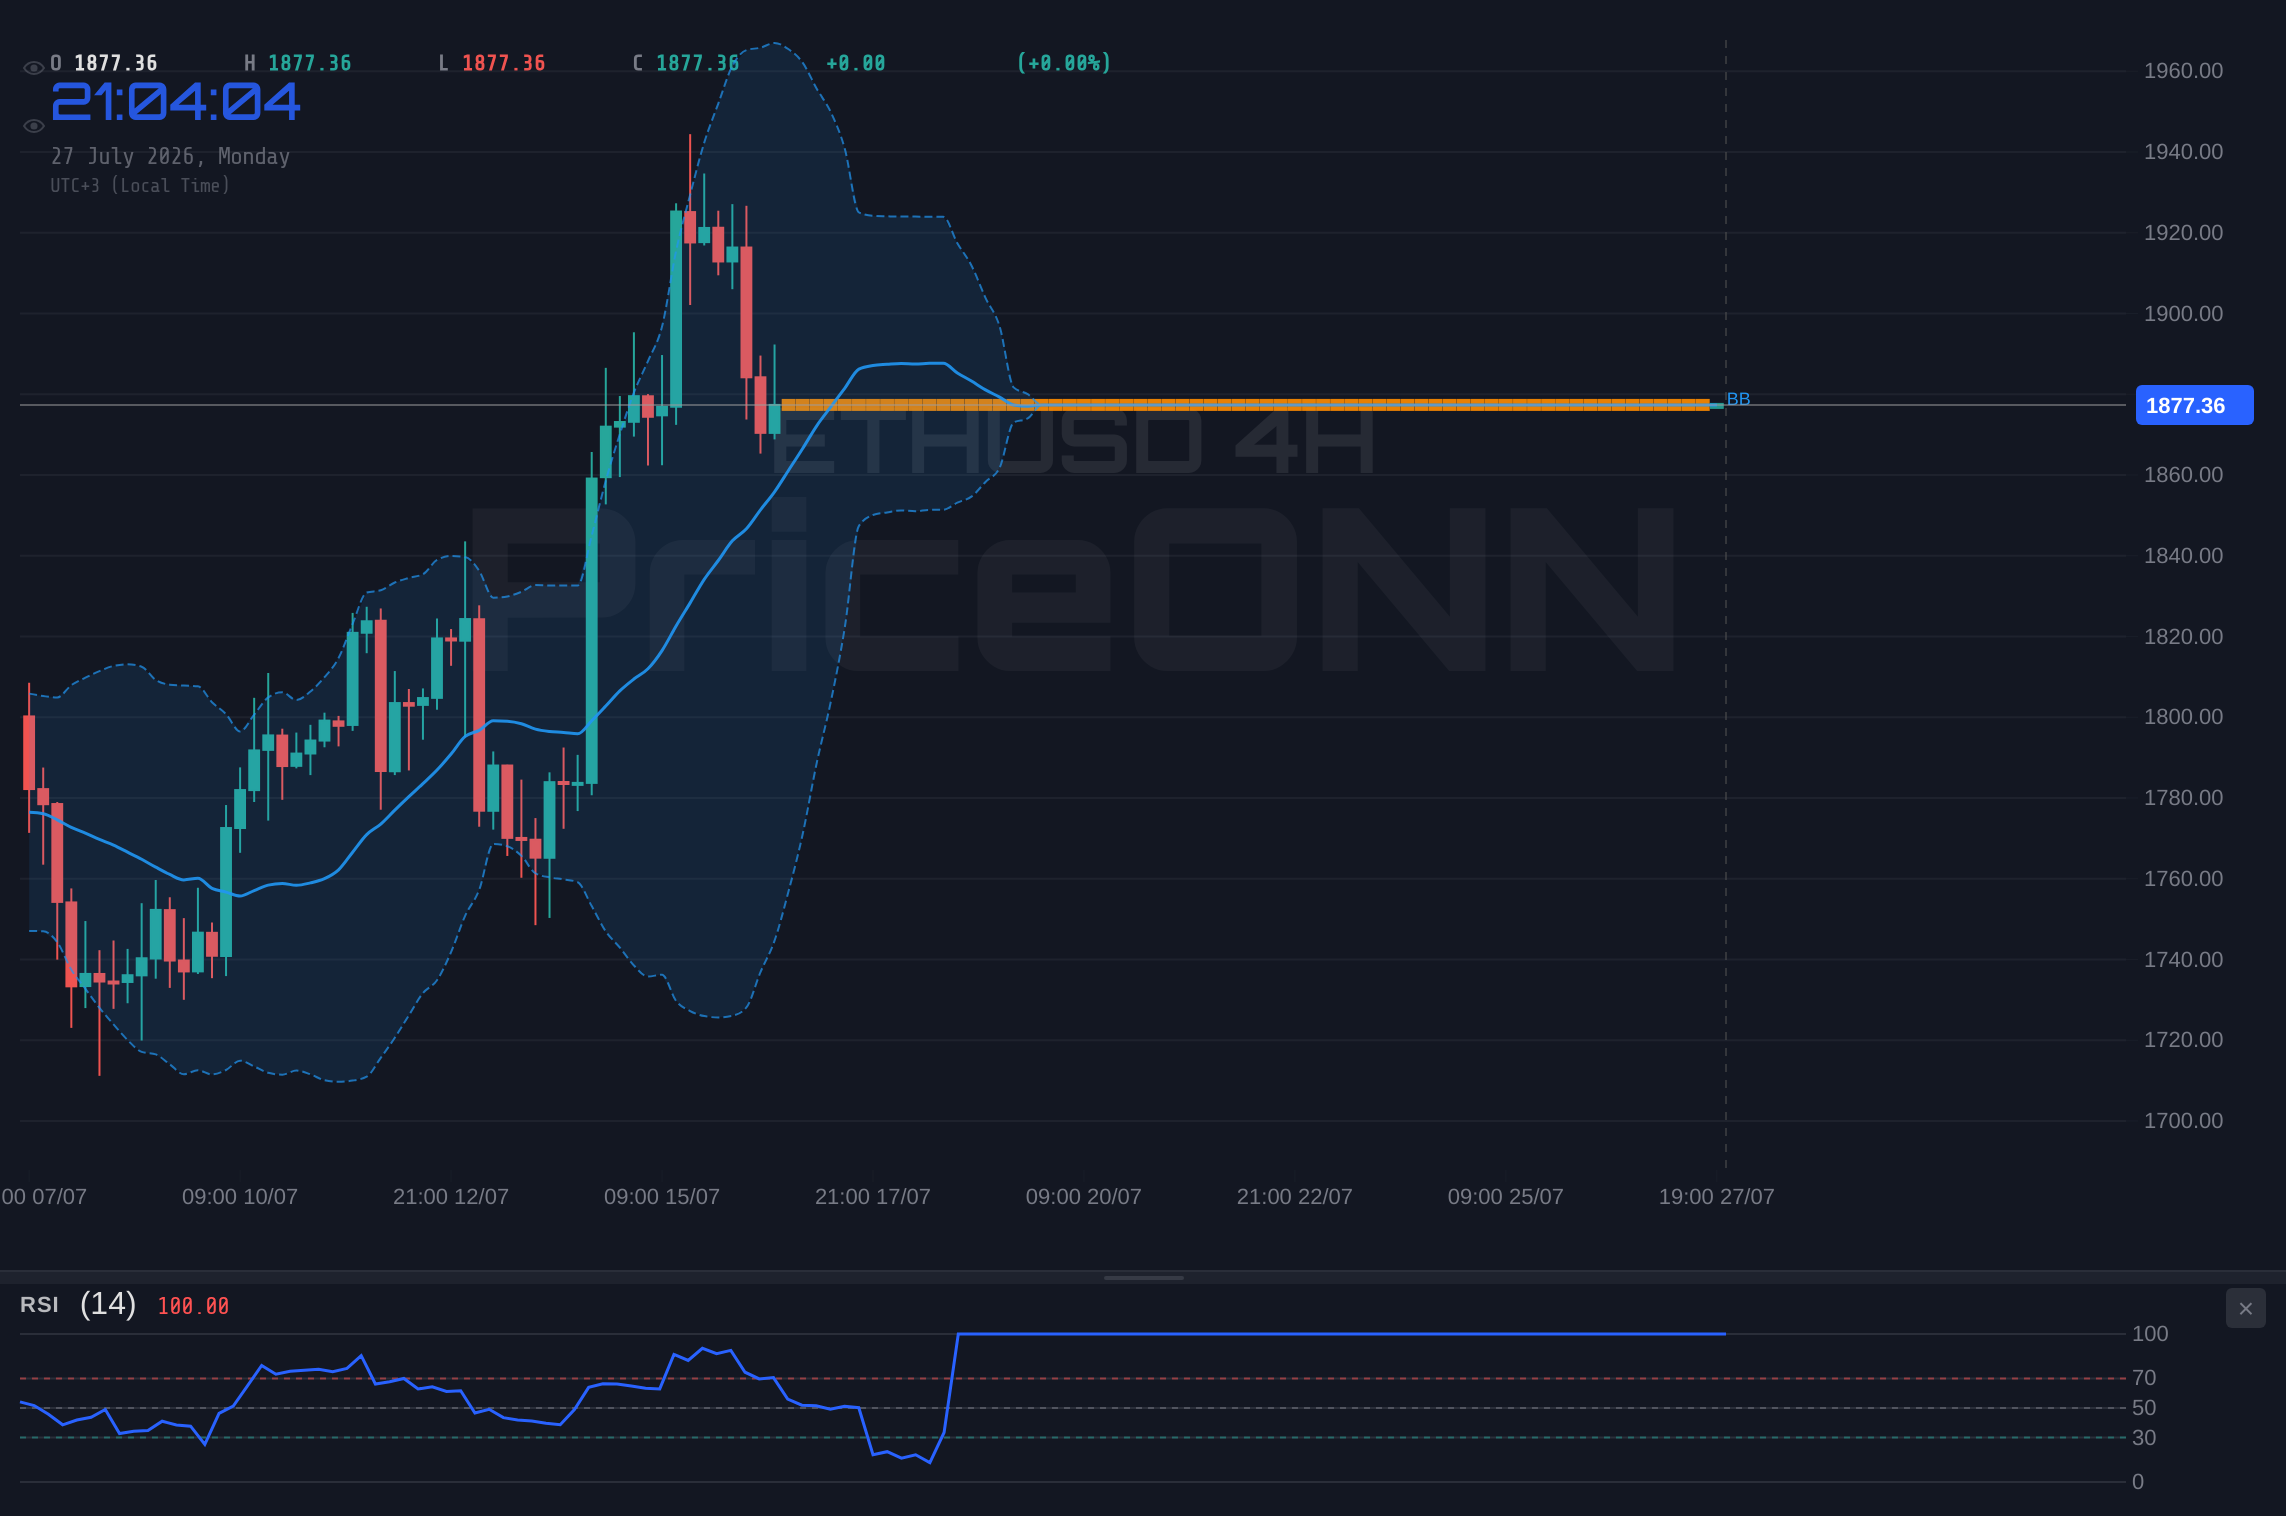
Delving into the technical indicators provides a clearer, albeit complex, picture of ETHUSD's current standing. On the 1-hour chart, the Relative Strength Index (RSI) sits at 39.48. While this is technically in the neutral zone, it leans towards oversold territory, suggesting that selling pressure might be exhausting. However, this is juxtaposed with negative momentum on the MACD, which remains below its signal line, indicating that sellers are currently dictating the short-term pace. The Stochastic oscillator offers a glimmer of hope for bulls, with its K line at 26.28 crossing above the D line at 20.63, hinting at a potential upward reversal from oversold conditions. Yet, the ADX at 29.09 confirms a strong downtrend on this timeframe, implying that any upward moves might be mere retracements within a larger downward correction.
Shifting to the 4-hour timeframe, the narrative becomes more bullish. The RSI stands at a healthier 56.88, firmly in neutral territory and pointing upwards, indicating room for further upside. MACD here is also showing negative momentum, but it’s less pronounced, and Bollinger Bands are positioned above the middle band, suggesting an upward bias. The Stochastic, however, presents a conflicting signal, with K at 18.24 and D at 57.76, clearly indicating a bearish divergence and potential downside. Despite these short-term divergences, the ADX at 37.06 on this timeframe is robust, confirming a strong bullish trend. This suggests that while minor pullbacks are possible, the overarching trend on the 4-hour chart remains firmly to the upside.
The daily chart offers further support for the bullish case, albeit with some caveats. The RSI is at 59.95, comfortably in neutral territory and trending upwards, signalling healthy upward momentum. The MACD is positive and above its signal line, a classic bullish indicator. Bollinger Bands are also above the middle band, reinforcing the upward bias. Stochastic is in overbought territory, with K at 84.55 and D at 79.73, indicating that ETHUSD might be approaching overbought conditions and could be due for a pause or minor pullback. However, the ADX at 22.66 confirms a moderately strong uptrend. The discrepancy between the Stochastic's overbought reading and the ADX's trend confirmation highlights the current tug-of-war in the market.
| Indicator | Value | Signal (1H) | Signal (4H) | Signal (1D) | Interpretation |
|---|---|---|---|---|---|
| RSI (14) | 39.48 / 56.88 / 59.95 | Neutral/Oversold | Neutral | Neutral | Mixed: 1H shows potential for bounce, 4H/1D lean bullish. |
| MACD | Negative / Negative / Positive | Bearish | Bearish | Bullish | Conflicting momentum across timeframes. |
| Stochastic | K=26.28, D=20.63 / K=18.24, D=57.76 / K=84.55, D=79.73 | Bullish Crossover | Bearish Divergence | Bullish Crossover | Short-term bullish crossover, 4H bearish divergence, 1D bullish. |
| ADX | 29.09 / 37.06 / 22.66 | Strong Trend | Strong Trend | Moderate Trend | Strong trend on 4H, moderate on 1D, but 1H suggests weakening momentum. |
Correlations and External Pressures: DXY and Equities
Understanding ETHUSD's price action requires looking beyond its own chart. The Dollar Index (DXY) is currently at 100.7, showing a slight upward bias on the 1-hour chart but mixed signals across other timeframes. Historically, a strengthening DXY often puts downward pressure on risk assets like ETHUSD. The current DXY reading of 100.7, coupled with its positive momentum on the 1H chart and a strong trend signal, suggests that the dollar might be finding some footing. This could act as a headwind for ETHUSD, especially if the dollar continues to strengthen. If DXY breaks above its 1H resistance of 100.73 and continues its ascent, expect further pressure on ETHUSD.
Equity markets present another layer of complexity. The S&P 500 is trading at 6572.87, up 0.74% on the day, indicating a generally positive risk appetite. However, the Nasdaq 100 is down 1.16% at 29164.86, showing a clear divergence. This mixed performance in major US indices suggests underlying uncertainty. While the S&P 500's strength might offer some support to ETHUSD, the Nasdaq's weakness, particularly in tech-heavy assets, could be a drag. The ADX on the S&P 500’s 1D chart (47.51) indicates a strong downtrend, contradicting its intraday gains, while the Nasdaq's 1D ADX (15.12) points to a weak trend, adding to the confusion. This conflicting data from correlated markets means ETHUSD's direction may not be solely dictated by broad market sentiment but by its own internal technical structure.
Oil prices, specifically Brent crude at $83.79, are down 0.83%. This slight pullback in oil might ease some inflation concerns, which could be indirectly beneficial for risk assets by reducing the perceived need for aggressive central bank tightening. However, the underlying geopolitical tensions, as hinted by the USD/JPY's rise towards 164 due to Middle East tensions, remain a background risk. Any escalation could quickly shift market sentiment back to risk-off, benefiting safe havens like gold (currently at $4,001.21, down 1.46%) and potentially pressuring ETHUSD.
Trade Scenarios: Mapping the Path Forward for ETHUSD
Bearish Scenario: The Consolidation Breaks Down
40% ProbabilityNeutral Scenario: Range-Bound Trading Continues
30% ProbabilityBullish Scenario: Momentum Resumes
30% ProbabilityThe current technical setup suggests a high degree of uncertainty, making probability assessments crucial. The 40% weight given to the bearish scenario stems from the weaker short-term indicators and the strong ADX on the 1-hour chart. However, the underlying bullish structure on the daily and 4-hour charts, supported by the RSI readings, prevents the bullish scenario from being completely dismissed, hence the 30% allocation. The neutral scenario acknowledges the possibility of continued indecision around the $1,877.38 level, especially if external market drivers remain ambiguous.
For traders, the immediate focus should be on how ETHUSD behaves around the $1,868.34 support. A failure to hold this level could quickly invalidate any remaining bullish conviction and open the door for a more significant pullback. Conversely, a strong reclaim and hold above $1,891.84, ideally accompanied by rising volume and positive MACD crossover on the 1-hour chart, would signal a resumption of the prior uptrend. The Stochastic's overbought reading on the daily chart suggests that even a bullish breakout might face immediate resistance and consolidation before potentially reaching higher targets.
The Road Ahead: Key Levels and What to Watch
Looking forward, the ETHUSD price action at $1,877.38 is a critical inflection point. The confluence of technical signals suggests that the market is at a crossroads. While the longer-term trend indicators on the 4-hour and daily charts remain bullish, the immediate 1-hour timeframe is exhibiting signs of weakness and consolidation. This divergence necessitates a cautious approach, emphasizing risk management and waiting for clear directional confirmation.
Traders should pay close attention to the $1,868.34 support level. A decisive break below this could trigger stop-loss orders and accelerate downward price movement, potentially targeting $1,856.83 and even $1,844.84. On the upside, the $1,891.84 resistance needs to be convincingly breached. A failure to do so, especially if coupled with negative news or a strengthening DXY, could lead to a rejection and a return to the lower end of the current range.
The market sentiment, as reflected by the DXY and equity indices, will also play a crucial role. Any significant moves in these correlated assets could influence ETHUSD's direction. Specifically, a continued rise in the DXY above 100.7 or a sharp decline in the Nasdaq 100 could signal a shift towards risk aversion, negatively impacting ETHUSD. Conversely, a stabilization or reversal in these external factors could provide the catalyst needed for ETHUSD to reclaim higher ground.
Frequently Asked Questions: ETHUSD Analysis
What happens if ETHUSD breaks below the $1,868.34 support level?
If ETHUSD closes decisively below the $1,868.34 support on the 1-hour chart, it could trigger further downside momentum. This scenario, carrying a 40% probability, might lead to ETHUSD testing the $1,856.83 level, and potentially accelerating towards $1,844.84 if selling pressure intensifies.
Should I buy ETHUSD at current levels near $1,877.38 given the mixed signals?
Given the conflicting signals between short-term weakness and longer-term bullish trends, buying at current levels carries risk. A more prudent approach, with a 30% probability for a bullish continuation, would be to wait for a confirmed break above the $1,891.84 resistance. Alternatively, a confirmed break below $1,868.34 could present a shorting opportunity if risk management is strictly applied.
Is the RSI at 39.48 on the 1-hour chart a sell signal for ETHUSD?
An RSI of 39.48 on the 1-hour chart technically falls within the neutral zone but leans towards oversold conditions, suggesting potential for a short-term bounce rather than a strong sell signal. However, when viewed alongside negative MACD momentum and a strong ADX trend on the same timeframe, it indicates that while buyers might step in, the underlying trend is still bearish on this specific chart.
How might the DXY at 100.7 affect ETHUSD's price action this week?
With the DXY currently at 100.7 and showing upward momentum on shorter timeframes, it presents a potential headwind for ETHUSD. A continued rise in the dollar could put pressure on risk assets like ETHUSD, potentially hindering any bullish attempts and increasing the probability of the bearish scenario playing out, especially if key support levels fail.
| Indicator | Value | Signal | Interpretation |
|---|---|---|---|
| RSI (14) | 39.48 (1H) / 56.88 (4H) / 59.95 (1D) | Neutral/Oversold | Mixed signals across timeframes, leaning bullish on higher timeframes. |
| MACD | Negative (1H) / Negative (4H) / Positive (1D) | Bearish | Momentum is conflicting; short-term bearish, but daily shows positive signs. |
| Stochastic | K=26.28, D=20.63 (1H) / K=18.24, D=57.76 (4H) / K=84.55, D=79.73 (1D) | Bullish Crossover | Short-term bullish crossover, but 4H shows bearish divergence while 1D is bullish. |
| ADX | 29.09 (1H) / 37.06 (4H) / 22.66 (1D) | Strong Trend | Strong trend on 4H, moderate on 1D, suggesting underlying strength despite 1H weakness. |
Track markets in real-time
AI-powered analysis, technical indicators and real-time price data.
Join Our Telegram Channel
Breaking market news, AI analysis and trading signals instantly.
Join Channel