

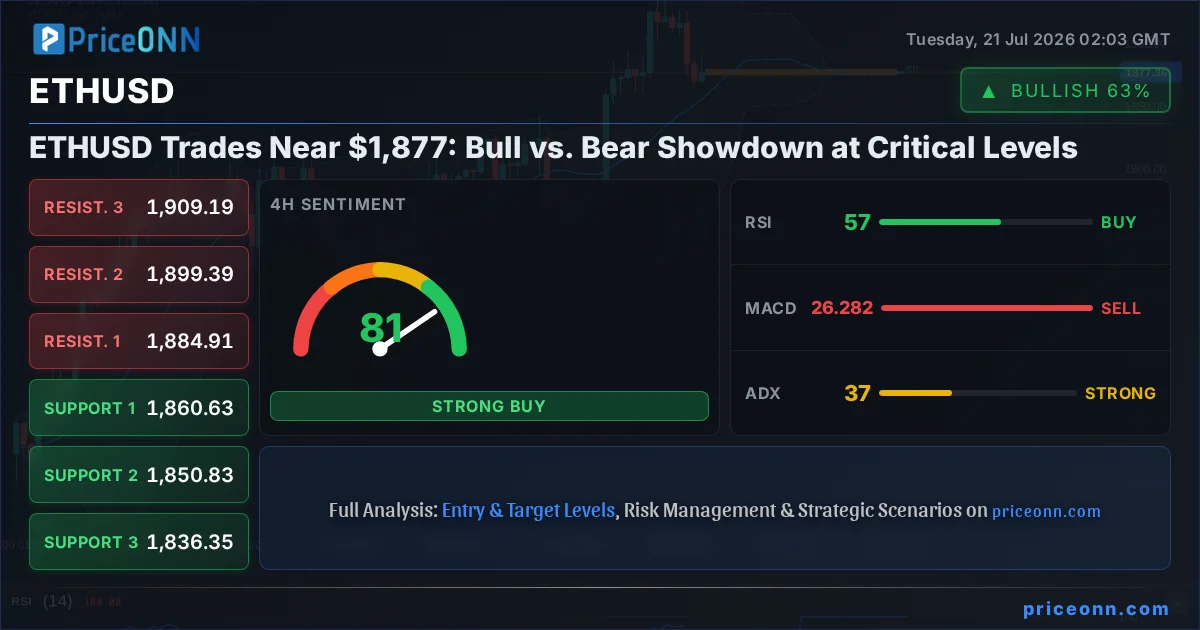
Is ETHUSD poised for a breakout above $1,877.38, or are bears ready to drag it lower? The cryptocurrency market is at a pivotal moment, with Ether’s price action around the $1,877.38 mark serving as a microcosm of the broader tension between bullish optimism and bearish caution. While recent price action has seen ETHUSD fluctuate, the underlying market structure and indicator readings present a complex picture, demanding a closer look at both the potential upside and downside scenarios. This analysis delves into the current technical and fundamental landscape, dissecting the arguments for and against a sustained move, and identifying the key levels that traders and investors must watch.
- ETHUSD is trading near $1,877.38, with conflicting signals from technical indicators.
- RSI at 39.48 on the 1H chart indicates bearish momentum, while the 1D chart shows RSI at 59.95, suggesting underlying bullishness.
- Key support is identified at $1,868.34, with resistance looming at $1,891.84 on the hourly timeframe.
- The DXY at 100.70 is showing strength, potentially pressuring risk assets like ETHUSD.
The Bullish Case: Can ETHUSD Hold the Line?
Rallying on Shifting Sands: The Argument for Upside
The daily chart for ETHUSD presents a more optimistic outlook, despite the short-term choppiness. With the price currently hovering around $1,877.38, the Relative Strength Index (RSI) on the daily timeframe stands at a solid 59.95. This reading, comfortably within the neutral-to-bullish territory, suggests that while the market isn't excessively overbought, there's enough underlying momentum to support further gains. The MACD indicator on the daily chart also shows positive momentum, with the MACD line above its signal line, reinforcing the idea that the larger trend might still favor buyers. Furthermore, the Bollinger Bands on the daily chart are positioned above the middle band, indicating an upward bias. The Stochastic Oscillator, with K at 84.55 and D at 79.73, is in overbought territory, which typically signals a potential reversal, but in a strong uptrend, it can stay elevated for extended periods, suggesting sustained buying pressure.The ADX on the daily chart sits at 22.66, indicating a moderately strong trend. While not indicative of a runaway bull market, it suggests that the current price action isn't purely speculative noise but is supported by a developing trend. This trend strength, combined with the bullish signals from the RSI and MACD, paints a picture of an asset that could potentially consolidate or even resume its upward trajectory. The 4-hour chart also offers some encouragement, showing an RSI of 56.15 and Bollinger Bands above the middle band, though the MACD is currently showing negative momentum. This divergence between timeframes suggests that while the longer-term trend might be bullish, short-term traders might face headwinds. The key for the bulls will be to defend the immediate support levels, particularly around $1,868.34, and to build upward momentum to challenge the $1,891.84 resistance.
Macroeconomic Tailwinds and Crypto Ecosystem Growth
Beyond the immediate technicals, the broader macroeconomic environment and the inherent growth of the Ethereum ecosystem provide a foundational case for ETHUSD’s long-term appreciation. While the US Dollar Index (DXY) is showing strength at 100.70, which historically can be a headwind for risk assets, the narrative around potential Federal Reserve rate pauses or even cuts in the future could eventually shift capital back into growth-oriented assets like cryptocurrencies. If inflation continues to moderate and the Fed signals a less hawkish stance, speculative capital may flow back into assets like ETH. On-chain metrics, though not explicitly provided in the market data, are crucial for understanding ETH's ecosystem health. A growing number of active addresses, increasing transaction volumes, and a rising Total Value Locked (TVL) in DeFi protocols built on Ethereum would all serve as fundamental tailwinds. Furthermore, developments in the Ethereum network itself, such as successful upgrades or increasing adoption of Layer-2 scaling solutions, contribute to its fundamental value proposition. The ongoing institutional interest, evidenced by flows into Bitcoin ETFs, often has a spillover effect on Ethereum, suggesting that broader market acceptance and infrastructure development continue to build a solid base for ETHUSD.The narrative around Ethereum's utility as a platform for decentralized applications (dApps), NFTs, and increasingly sophisticated DeFi protocols cannot be overstated. As developers continue to innovate and user adoption grows, the demand for ETH as a network asset - for gas fees, staking, and collateral - is expected to rise. While short-term price action can be volatile, the fundamental utility and ongoing development of the Ethereum ecosystem provide a strong undercurrent of demand that could support prices above the $1,877.38 level, especially if broader market sentiment turns more risk-on.
The Bearish Case: Cracks in the Foundation?
Short-Term Weakness and Technical Red Flags
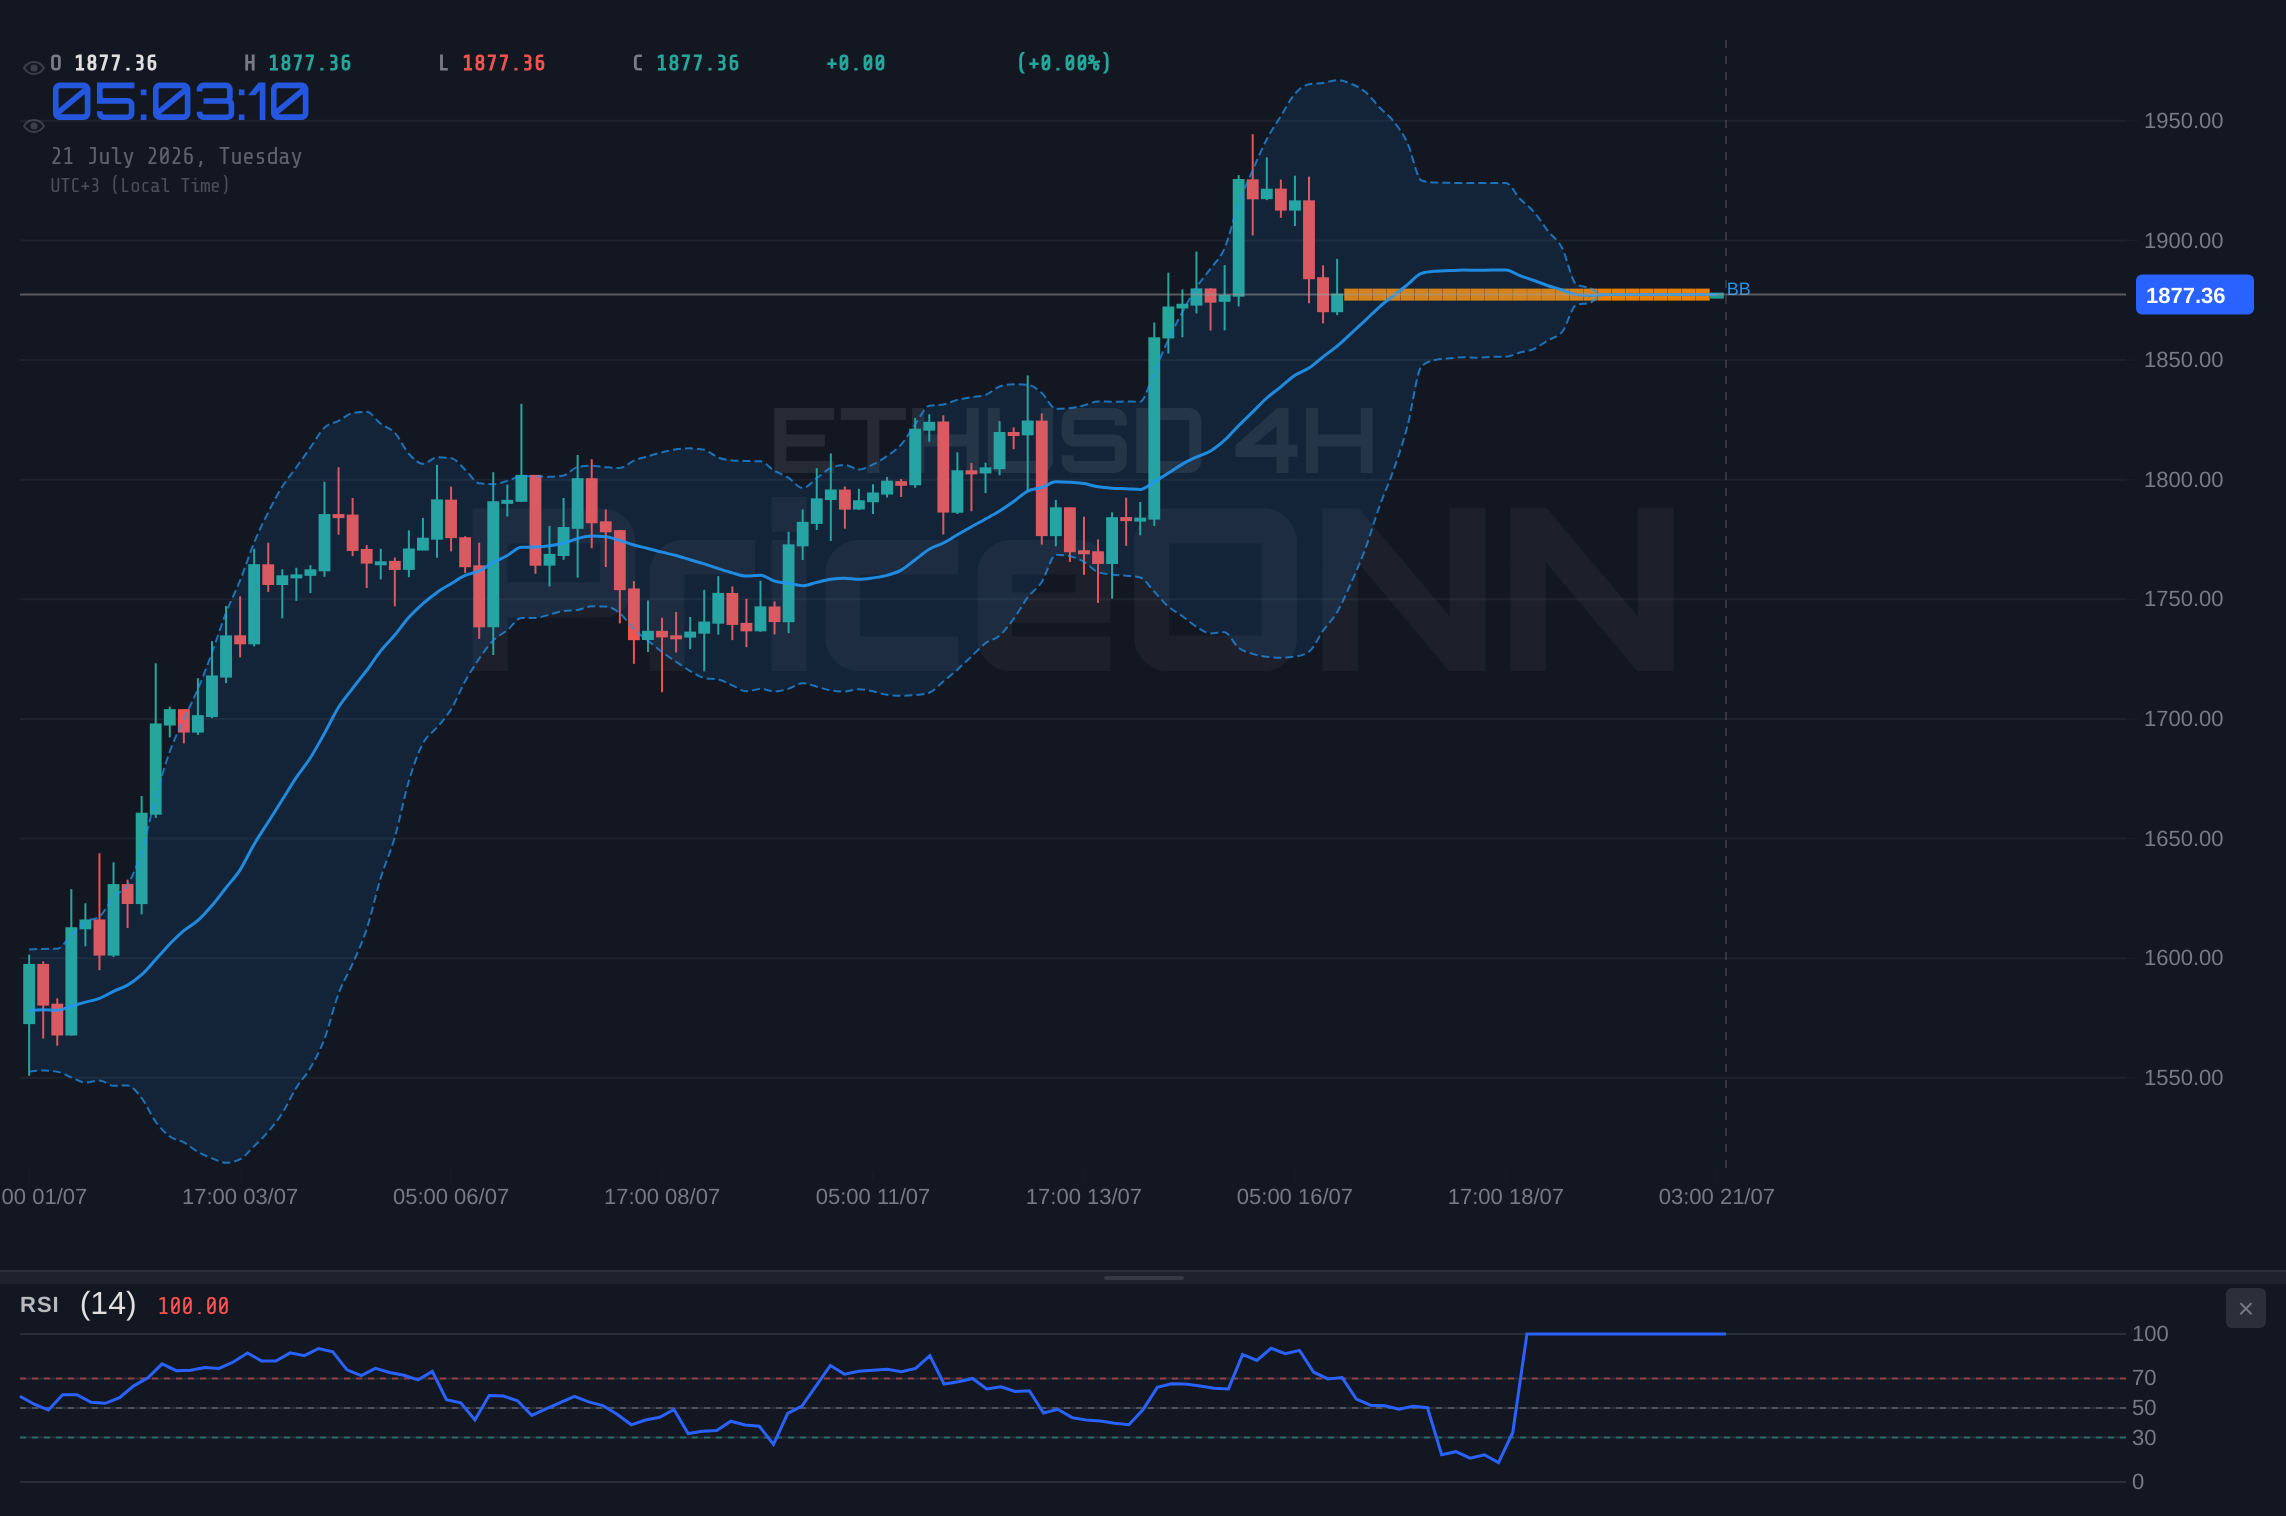
The immediate 1-hour chart for ETHUSD paints a decidedly more bearish picture than its daily counterpart. The RSI at 39.48 is firmly in the lower half of the neutral zone, indicating bearish momentum is currently in play. The MACD is also showing negative momentum, with the MACD line below its signal line, suggesting that sellers are in control on this shorter timeframe. The Bollinger Bands are trading below the middle band, confirming the downward pressure. Adding to the bearish sentiment, the Stochastic Oscillator shows a K-line at 26.28 and a D-line at 20.63, indicating a potential for further downside, although the K-line crossing above the D-line offers a slight bullish divergence signal within the oversold territory. The ADX on the 1-hour chart is at 29.09, signaling a strong downward trend, which contradicts the bullish interpretation from the daily ADX. This conflict between timeframes is crucial; it suggests that while the long-term trend might hold, the immediate path forward could be fraught with selling pressure. The overall signal on the 1H chart is 'SELL', with 6 out of 8 indicators pointing downwards.The 4-hour chart also presents some concerning signs. While the RSI is at 56.15, which is neutral, the MACD is exhibiting negative momentum. The Stochastic Oscillator is showing a bearish signal with K at 21.63 and D at 46.51, reinforcing the idea of selling pressure. The ADX at 25.63 indicates a strong upward trend, which seems contradictory to the negative MACD and bearish Stochastic. This technical dissonance across different timeframes highlights the uncertainty. Bears will be looking to capitalize on any weakness, aiming to push ETHUSD below the immediate support at $1,868.34. A decisive break below this level could trigger further selling, potentially targeting the next support at $1,856.83, and even $1,844.84 if momentum accelerates.
Macroeconomic Headwinds and Regulatory Uncertainty
The strength in the US Dollar Index (DXY), currently at 100.70, presents a significant macroeconomic headwind for ETHUSD. A stronger dollar typically makes dollar-denominated assets, including cryptocurrencies, more expensive for holders of other currencies, potentially dampening demand. Furthermore, the persistent inflation concerns, even if showing signs of cooling, mean that central banks, particularly the Federal Reserve, may maintain a hawkish bias for longer than markets anticipate. This can lead to higher interest rates, which increases the opportunity cost of holding non-yielding assets like cryptocurrencies and can also put pressure on risk appetite. The recent news flow, while not directly mentioning ETHUSD, highlights broader market movements. For instance, the struggle of EUR/USD below 1.1500 and the fall in S&P 500 suggest a general risk-off sentiment might be creeping back into global markets. Renewed tensions between the US and Iran pushing oil prices higher also contribute to inflation fears, which could prompt tighter monetary policy. This complex interplay of global economic factors creates an environment where speculative assets like ETHUSD could face increased selling pressure.Regulatory uncertainty remains a perennial overhang for the cryptocurrency market. While specific news impacting ETHUSD directly isn't provided, ongoing discussions and potential actions by regulators globally can create apprehension among investors. Any perceived negative regulatory development, whether related to stablecoins, DeFi, or exchange operations, could trigger sell-offs. The market is sensitive to news regarding potential crackdowns or new compliance requirements, which can lead to sharp price corrections. Bears will be watching for any such developments or shifts in macroeconomic sentiment that could justify a move lower from the current $1,877.38 level.
The Verdict: A Watchful Stance Amidst Conflicting Signals
The current technical picture for ETHUSD around $1,877.38 is a classic tug-of-war between short-term bearish signals and longer-term bullish undertones. The daily timeframe suggests resilience and potential for upside, with RSI and MACD holding constructive positions. However, the hourly and 4-hour charts flash warning signs, with bearish momentum and indicators pointing towards immediate downside risk. The ADX readings are also conflicting, with daily suggesting a strong trend and shorter timeframes indicating weaker or even opposing trends. This divergence means that a clear directional trade is difficult to establish without further confirmation.The trade recommendation is **WATCH_ZONE**. The score of 1/8 reflects the high degree of uncertainty. A valid setup would require clearer signals. For bulls, a decisive close above the hourly resistance at $1,891.84, ideally with increasing volume, would be the first sign of strength. This would need to be sustained, breaking through subsequent resistance levels and ideally pushing the hourly RSI above 50 and MACD into positive territory. For bears, a break below the immediate hourly support at $1,868.34, followed by a close below the 4-hour support at $1,860.63, would signal a more significant downtrend. Confirmation would come from the daily indicators turning bearish, with the daily RSI falling below 50 and the MACD crossing below its signal line. Until one of these scenarios gains clear technical traction, caution is the prudent approach. Traders should wait for a confirmed breakout or breakdown, or for conflicting signals to resolve, before committing to a significant position.
Navigating the $1,877.38 Crossroads
If ETHUSD manages to hold the current levels and push higher, the immediate target would be the hourly resistance at $1,891.84. A sustained break above this level, supported by strong volume and positive momentum across multiple timeframes, could pave the way for a test of the next resistance around $1,915.34. On the flip side, if the bearish signals on the shorter timeframes prevail, the critical support to watch is $1,868.34. A break below this level could lead to a retest of the $1,856.83 area, and potentially lower towards $1,844.84 if the selling pressure intensches. The daily trend strength at 86% suggests that any move, whether up or down, could be significant once a direction is established. The market is currently in a state of flux, and the $1,877.38 price point represents a delicate balance. Patience will be rewarded as the market reveals its hand.Scenario Analysis: Mapping Potential ETHUSD Paths
Bearish Scenario: The Slide Below $1,868
65% ProbabilityBullish Scenario: Breaking the $1,891 Barrier
25% ProbabilityNeutral Scenario: Consolidation Around $1,877
10% ProbabilityFrequently Asked Questions: ETHUSD Analysis
What happens if ETHUSD breaks below the $1,868.34 support level?
A break below $1,868.34 on the hourly chart would invalidate the immediate bullish outlook and could trigger a move towards $1,856.83. This scenario gains probability if the DXY continues to strengthen or if broader market sentiment turns risk-off.
Should I buy ETHUSD at current levels around $1,877.38, given the conflicting indicators?
Buying at current levels carries significant risk due to the conflicting signals across timeframes. A more prudent approach would be to wait for a confirmed break above $1,891.84 with strong volume, or a clear breakdown below $1,868.34, to establish a directional bias.
Is the RSI at 39.48 on the 1H chart a sell signal for ETHUSD?
An RSI of 39.48 on the 1-hour chart indicates bearish momentum is present in the short term. While not necessarily a direct sell signal on its own, it aligns with the bearish scenario and suggests that upside potential may be limited until this indicator shows signs of recovery above 50.
How will continued DXY strength around 100.70 affect ETHUSD this week?
Continued strength in the DXY at 100.70 generally exerts downward pressure on risk assets like ETHUSD. This macro headwind could make it harder for ETHUSD to break through resistance levels, increasing the probability of the bearish scenario playing out if other risk factors align.
| Indicator | Value | Signal | Interpretation |
|---|---|---|---|
| RSI (14) | 39.48 | Bearish | Weak momentum on 1H, but bullish divergence on 1D. |
| MACD | Negative | Bearish | Negative momentum on 1H & 4H, positive on 1D. |
| Stochastic | K:26.28, D:20.63 | Bullish Divergence | Oversold conditions on 1H, but K>D suggests short-term uptick. |
| ADX | 29.09 | Strong Trend | Indicates a strong downward trend on 1H, conflicting with daily trend strength. |
| Bollinger Bands | Below Mid | Bearish Pressure | Price is below the middle band on 1H & 4H, indicating selling pressure. |
Track markets in real-time
AI-powered analysis, technical indicators and real-time price data.
Join Our Telegram Channel
Breaking market news, AI analysis and trading signals instantly.
Join Channel