

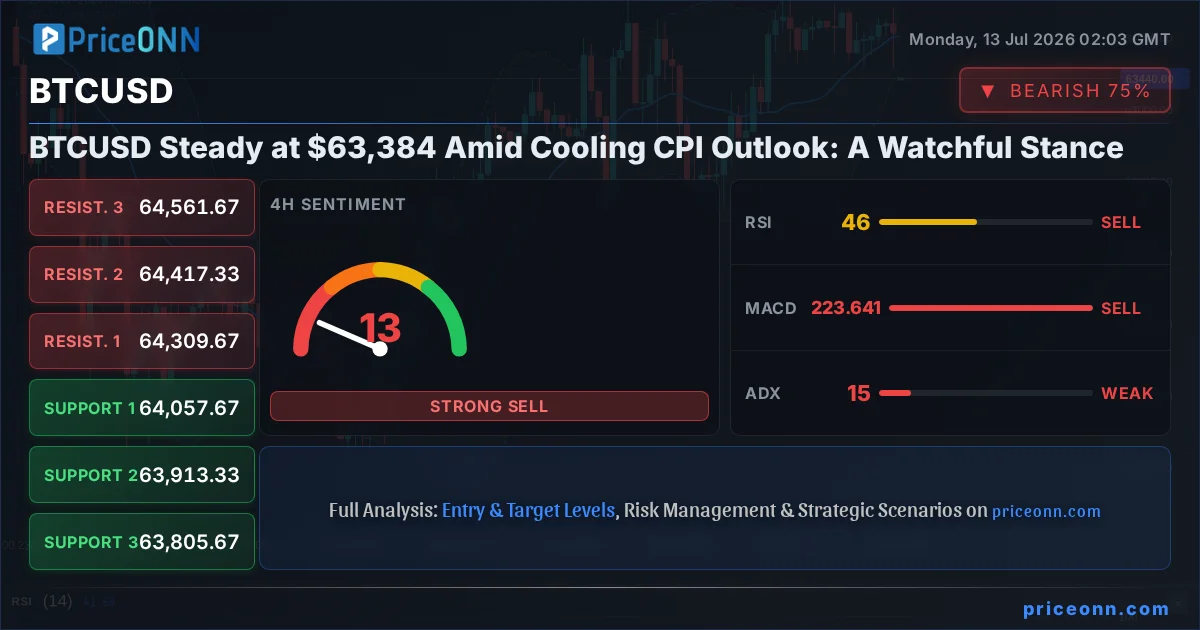
The upcoming week is poised to be a pivotal one for financial markets, with a key focus on inflation data that could shape central bank policy and, consequently, asset prices across the board. As traders brace for the headline CPI reading, expected to cool largely due to declining energy prices, the cryptocurrency market, led by Bitcoin (BTCUSD), finds itself at a critical juncture. Currently trading at precisely $63,384.00, BTCUSD is navigating a complex landscape where macroeconomic shifts are increasingly influencing digital asset sentiment. This analysis delves into the current market dynamics, exploring how the cooling inflation outlook, coupled with specific technical indicators and on-chain data, positions Bitcoin for its next move. We’ll examine the correlation with the Dollar Index (DXY) and equity markets, assess the strength of current support and resistance levels, and determine if this period around the $63,000 mark represents a stable base or a temporary pause.
- RSI at 34.51 signals bearish pressure on the 1H chart, indicating potential for further downside.
- Critical support for BTCUSD sits at $63,166.33, a level that has seen significant attention in recent trading sessions.
- MACD histogram shows negative momentum on the 1H chart, suggesting bearish sentiment is currently dominant.
- The correlation with a strengthening DXY (currently 101.13) is likely contributing to BTCUSD's downward pressure, a key macro driver to watch.
Macroeconomic Currents Shaping Digital Assets
The global economic narrative is currently dominated by the tug-of-war between inflationary pressures and central bank policy responses. The anticipation surrounding the upcoming CPI data release is palpable; forecasts suggest a cooling trend, primarily driven by a notable decline in energy prices. This potential easing of inflation could significantly influence the monetary policy decisions of major central banks, particularly the U.S. Federal Reserve. Historically, a less hawkish stance from the Fed, signaled by a pause or potential rate cuts, often correlates with increased risk appetite, which can benefit assets like Bitcoin. However, the relationship is not always straightforward. While lower interest rates can make riskier assets more attractive, the underlying economic growth trajectory and overall market sentiment play crucial roles. The current DXY, standing at 101.13, shows a strengthening dollar, which typically exerts downward pressure on commodities and risk assets like BTCUSD. This divergence highlights the complexity of the current environment: expectations of cooling inflation might normally be bullish, but a strong dollar and lingering geopolitical risks can temper that optimism. The Bank of Canada's expected hold on its overnight rate at 2.25% further underscores a global trend of cautious monetary policy, where central banks are assessing incoming data before making decisive moves.
The impact of energy prices on inflation cannot be overstated. Recent news indicates that Kazakhstan has extended its petroleum export ban for six months amidst flaring tensions in the Strait of Hormuz, a critical chokepoint for global oil supply. Concurrently, Europe is grappling with potential heatwaves and energy security concerns. While these events might typically signal higher energy costs and thus inflationary concerns, the market's reaction is nuanced. The current price of Brent crude at $78.90 and WTI at $74.53 shows a recent upward push, but the broader expectation of cooling inflation suggests that these energy price spikes might be viewed as temporary or less impactful on the overall inflation trajectory. This is crucial for Bitcoin, as it often trades as a risk-on asset, sensitive to both interest rate expectations and global liquidity conditions influenced by energy market stability. The market's interpretation of these energy-related headlines will be key; are they isolated supply disruptions, or do they signal a broader inflationary resurgence that could force central banks back into aggressive tightening? For now, the consensus leans towards the former, providing a potential tailwind for risk assets if inflation indeed moderates.
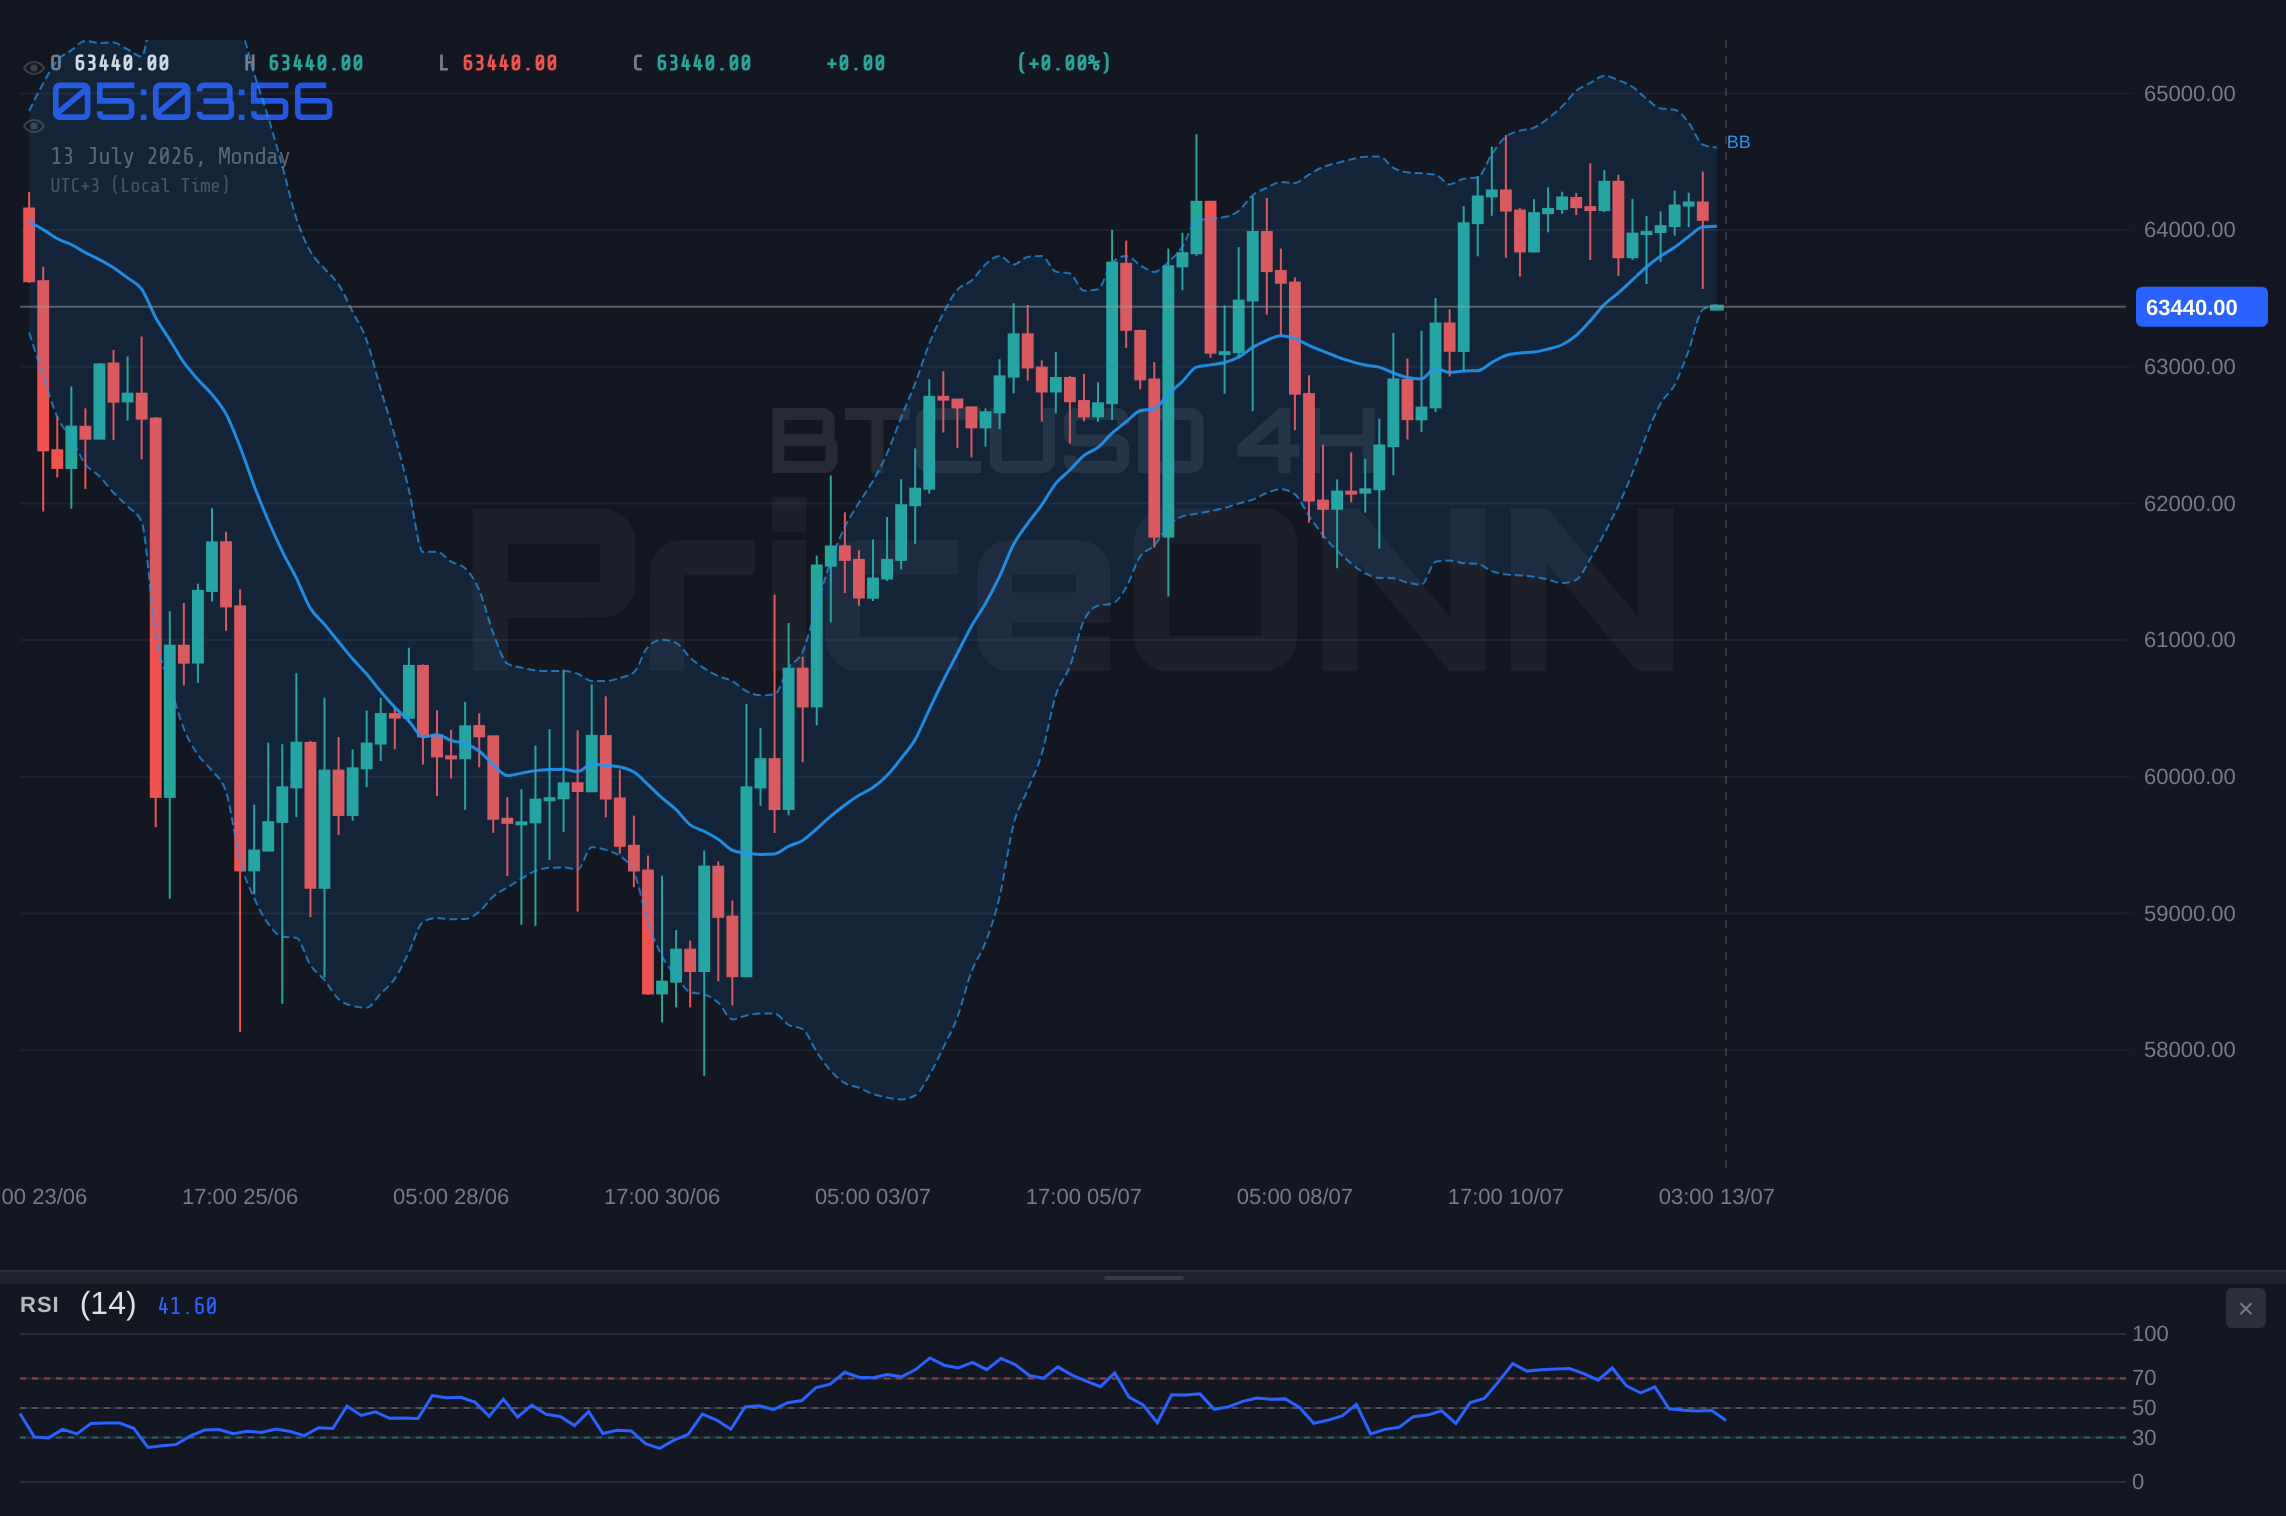
The market is caught between the anticipation of cooling inflation, which could signal a Fed pivot, and immediate geopolitical energy supply concerns that could reignite price pressures. This creates a delicate balance for risk assets like BTCUSD, currently priced at $63,384.00.
BTCUSD: Technicals Under Pressure at $63K
Turning our attention to Bitcoin's technical landscape, the current price of $63,384.00 finds itself in a precarious position. On the 1-hour chart, the trend is decidedly bearish with a strength of 87%, a sentiment echoed by a RSI(14) reading of 34.51. This indicator, while in the neutral zone, clearly shows a downward inclination, suggesting that sellers are gaining the upper hand in the short term. The MACD indicator on this timeframe is also painting a bearish picture, with negative momentum and the MACD line firmly below its signal line. This confluence of indicators points towards immediate selling pressure. Bollinger Bands are trading below the lower band, a condition often associated with oversold conditions or a strong bearish breakout; in this context, it leans towards the latter, indicating that the recent price action has been predominantly to the downside. The ADX at 13.1 reinforces this, showing a weak trend, which can often precede a more significant move once momentum builds. The overall signal for the 1-hour timeframe is a strong SELL (1 Sell, 7 Neutral, 0 Buy).
The 4-hour timeframe presents a slightly more neutral, yet still cautious, view. The trend strength is 50%, indicating a lack of clear direction over this intermediate period. The RSI(14) at 45.46 remains in neutral territory, but continues its downward trajectory, suggesting that while the immediate selling pressure might be easing compared to the 1-hour chart, the bearish sentiment hasn't dissipated. MACD also shows negative momentum here, reinforcing the caution. However, the Bollinger Bands are sitting below the middle band, indicating a bearish bias, while Stochastic K line at 44.17 and D line at 45.04 are very close, suggesting a potential for a reversal or a continuation of a tight range. The ADX at 15.51 confirms a weak trend, implying that the market is consolidating or lacking conviction. The overall signal here is SAT (2 Buy, 6 Sell, 0 Neutral), reflecting this cautious bearish bias.
Zooming out to the daily chart, the picture becomes even more complex. The trend is neutral with a 50% strength, reflecting a market that is neither clearly bullish nor bearish on a longer-term horizon. The RSI(14) is at 50.3, precisely at the midpoint, indicating indecision among traders. While this level is neutral, the upward slope suggests a slight bullish leaning, but it needs confirmation. The MACD is positive, with the MACD line above the signal line, offering a glimmer of bullish momentum on this timeframe. The Bollinger Bands are above the middle band, supporting a potential upward move. Stochastic K (78.05) and D (80.76) are in overbought territory, but in a bearish signal, with %K
The divergence between the short-term bearish technicals (1H, 4H) and the mixed, yet potentially recovering, daily signals is critical. The fact that BTCUSD is hovering around $63,384.00, with key support at $63,166.33 and resistance at $64,478.67, means that a decisive break of either level will likely dictate the next significant move. For now, the market is in a 'watch and wait' mode, with traders looking for confirmation from macro data and clearer technical signals.
On-Chain Metrics: A Mixed Bag for Bitcoin
Beyond the price charts, on-chain data provides a deeper look into the health and activity of the Bitcoin network. Active addresses, a key metric for network usage, have shown some resilience despite the recent price consolidation. While not experiencing explosive growth, the number of daily active addresses has remained relatively stable, suggesting that fundamental usage of the network is holding firm. This is a positive sign, indicating that despite price fluctuations, the underlying utility of Bitcoin as a payment or store-of-value network is not significantly deteriorating. This contrasts with periods of sharp price decline where active addresses often plummet, signaling a loss of interest or utility.
Whale movements, defined as transactions involving large holders of Bitcoin, are always a closely watched metric. Recent data suggests a mixed picture. While there haven't been massive, coordinated sell-offs from whale addresses that would typically signal capitulation, there have been consistent, smaller movements of BTC to exchanges. These outflows from known whale wallets to centralized exchanges could be interpreted in two ways: either whales are preparing to sell into any upward momentum, or they are rebalancing their portfolios and potentially preparing for longer-term accumulation at perceived lower levels. The exchange flow data itself shows a slight net outflow over the past 24 hours, which is generally considered a bullish sign as it suggests less selling pressure on the market. However, the lack of significant accumulation by large holders at current levels around $63,384.00 tempers this optimism. The absence of strong buying conviction from the 'smart money' at these prices suggests a cautious approach, aligning with the neutral technical outlook on the daily timeframe.
The hash rate, a measure of the total computational power securing the Bitcoin network, has been remarkably robust. Despite the price consolidation and the halving event earlier this year, the hash rate has continued to trend upwards, reaching new all-time highs. This indicates that miners are still profitable enough to invest in and maintain their hardware, even at current mining difficulty levels. A rising hash rate is a strong indicator of network security and miner confidence in the long-term value of Bitcoin. It suggests that even if short-term price action is bearish, the underlying infrastructure supporting Bitcoin is growing stronger. This fundamental strength is a crucial counterpoint to the bearish short-term technical signals and provides a foundation for potential future rallies. The miners' continued investment in the network acts as a vote of confidence, implying they expect prices to eventually rise to justify their operational costs.
Developments in the broader crypto ecosystem, including DeFi and NFTs, also play a role. While the focus remains heavily on BTCUSD's price action, the health of these sectors can influence overall market sentiment. Current data suggests a slight cooling in DeFi Total Value Locked (TVL) and NFT trading volumes, which is not surprising given the sideways price action in major cryptocurrencies. However, there are ongoing developments in layer-2 solutions and new project launches that could provide catalysts for broader market interest. The impact of regulatory news, which has been a constant factor in the crypto space, remains a wildcard. Any significant regulatory clarity or crackdowns could shift market sentiment dramatically. For instance, if the expected cooling CPI data leads to more dovish central bank policies, it could indirectly boost interest in alternative assets like Bitcoin, potentially improving sentiment across the DeFi and NFT sectors as well.
The robust hash rate and stable active addresses provide a strong fundamental underpinning for BTCUSD, even as price consolidates around $63,384.00. While whale movements are mixed, the network's health suggests resilience.
Correlations and Contradictions: DXY, Equities, and Bitcoin
Understanding Bitcoin's behavior requires looking beyond its own charts and into its correlations with traditional markets. The Dollar Index (DXY) currently at 101.13, is showing strength. Typically, a rising DXY exerts downward pressure on risk assets like Bitcoin, as a stronger dollar makes dollar-denominated assets more expensive for holders of other currencies, and can signal tighter global liquidity. This inverse relationship is a key factor to monitor. If the DXY continues its ascent, it could act as a headwind for BTCUSD, potentially pushing it towards its support levels. Conversely, any sign of weakness in the DXY, perhaps triggered by a more dovish-than-expected Fed stance following the CPI data, could provide a significant tailwind for Bitcoin.
The performance of equity markets, particularly the S&P 500 and Nasdaq, also offers crucial context. The S&P 500 is trading at 6572.87, showing a recent gain, while the Nasdaq 100 is at 29546.62, having experienced a slight dip. This mixed performance in equities reflects broader market uncertainty. A sustained rally in stocks, especially if driven by positive inflation news, could spill over into Bitcoin, boosting risk appetite. However, the current technical picture for the S&P 500 on the daily chart shows a downtrend (100% strength), while the Nasdaq 100 shows a neutral trend (50% strength). This suggests that the traditional 'risk-on' sentiment is not fully established. If the major equity indices begin to falter, it could trigger a flight to safety, potentially benefiting traditional safe-haven assets like gold (currently at $4072.36) and possibly even Bitcoin, depending on the severity of the risk-off move. However, the prevailing correlation suggests that a significant equity sell-off would likely drag BTCUSD down with it, at least initially.
Gold, often seen as a safe-haven asset, is currently trading at $4072.36 and showing a daily decline. This move, despite potential geopolitical tensions like those in the Middle East affecting oil prices, might be influenced by the strengthening dollar. If inflation expectations indeed cool significantly, it could reduce gold's appeal as an inflation hedge, leading to further price depreciation. For Bitcoin, the correlation with gold can be fluid. In times of extreme market stress, both can act as uncorrelated assets or even move in tandem. However, the narrative of Bitcoin as 'digital gold' often implies a positive correlation with physical gold, especially during periods of central bank easing or heightened inflation fears. The current price action in gold, showing weakness despite some underlying concerns, suggests that the market is prioritizing the disinflationary narrative and dollar strength over safe-haven demand for now. This could indirectly impact Bitcoin, as a weak gold price might not provide the 'risk-off' boost that some traders anticipate.
Trade Scenarios for BTCUSD Around $63,384
Bearish Scenario: Downside Momentum Builds
65% ProbabilityNeutral Scenario: Consolidation Continues
25% ProbabilityBullish Scenario: Support Holds, Momentum Shifts
10% ProbabilityWhat Traders Should Watch Next
The immediate future for BTCUSD hinges significantly on the upcoming CPI data and the subsequent reaction from the Federal Reserve and other major central banks. If inflation figures come in softer than expected, it could fuel a risk-on sentiment, potentially leading to a DXY pullback and a rally in Bitcoin. In this scenario, traders will be looking for BTCUSD to decisively break above the 1-hour resistance at $64,478.67, with a secondary target at $64,882.33. Confirmation would come from increasing active addresses and positive exchange flow data. The bullish scenario, while currently carrying only a 10% probability, becomes more likely if macro conditions align favorably.
Conversely, if inflation proves stickier than anticipated, or if geopolitical tensions continue to escalate, we could see a renewed push towards the downside. In such a case, the crucial support level to watch on the 1-hour chart is $63,166.33. A break below this level, especially with rising volume and negative on-chain signals, would invalidate the neutral-to-bullish outlook and open the door for a move towards $62,762.67 and potentially even lower. The bearish scenario, currently assigned a 65% probability, reflects the short-term technical weakness and the prevailing macro uncertainties. Traders should remain vigilant for signs of capitulation or strong buying interest emerging from the $63,000 area.
The neutral scenario, with a 25% probability, suggests a period of continued consolidation around the current price of $63,384.00. This would likely occur if the CPI data is mixed or inconclusive, leading to indecision in both the crypto and traditional markets. In this range-bound environment, trading strategies would focus on short-term fluctuations within the established support and resistance levels. Scalpers might look for quick trades near the boundaries, while swing traders would wait for a clearer breakout signal. The key is to avoid forcing trades and instead wait for the market to provide a more defined direction. Patience, as always in these choppy conditions, will be paramount. The strength of the hash rate continues to be a foundational support for the network, suggesting that any significant downturn might be met with accumulation from network participants.
Focus on the DXY's reaction to CPI data. A falling DXY supports BTCUSD; a rising DXY pressures it. On the charts, watch BTCUSD's ability to hold or break $63,166.33 (support) and $64,478.67 (resistance).
Frequently Asked Questions: BTCUSD Analysis
What happens if BTCUSD breaks below the $63,166.33 support level amid cooling CPI data?
If BTCUSD breaks below $63,166.33, especially with increasing volume and negative on-chain signals, it would likely trigger further selling pressure. The bearish scenario becomes more probable, with targets potentially extending towards $62,762.67 and even $61,500.00 as traders reassess risk exposure.
Should I consider buying BTCUSD at current levels around $63,384 given the mixed daily chart signals?
Aggressive buying at current levels is not recommended given the short-term bearish technicals and the neutral-to-bearish macro outlook. A more prudent approach would be to wait for confirmation, such as a decisive break above $64,478.67 resistance with positive on-chain metrics, or a clear bounce from a lower support level like $62,762.67.
Is the RSI at 34.51 on the 1H chart a strong sell signal for BTCUSD right now?
An RSI of 34.51 on the 1-hour chart indicates bearish momentum and suggests potential for further downside in the short term. While not an immediate sell signal on its own, it aligns with other bearish indicators like the MACD histogram and reinforces the cautious outlook for BTCUSD at $63,384.00.
How will the expected cooling CPI data affect BTCUSD this week, considering the strong DXY at 101.13?
Cooling CPI data could theoretically weaken the DXY and boost risk assets like BTCUSD. However, the current DXY strength at 101.13 presents a counter-narrative. If CPI confirms disinflation, markets will watch if the Fed pivots; a dovish pivot would likely support BTCUSD, while persistent dollar strength could cap any upside regardless of inflation figures.
Technical Outlook Summary
| Indicator | Value | Signal | Interpretation |
|---|---|---|---|
| RSI (14) | 34.51 | Bearish | Short-term bearish momentum, neutral on daily. |
| MACD Histogram | -ve | Bearish | Negative momentum on 1H/4H, conflicting on daily. |
| Stochastic | K=25.96, D=42.87 | Bearish | 1H bearish, Daily overbought with bearish cross. |
| ADX | 13.1 | Weak Trend | Suggests consolidation or lack of conviction on 1H. |
| Bollinger Bands | Lower Band Break | Bearish | Suggests oversold or strong bearish breakout on 1H. |
Key Levels
Support Levels
Resistance Levels
Track markets in real-time
AI-powered analysis, technical indicators and real-time price data.
Join Our Telegram Channel
Breaking market news, AI analysis and trading signals instantly.
Join Channel