

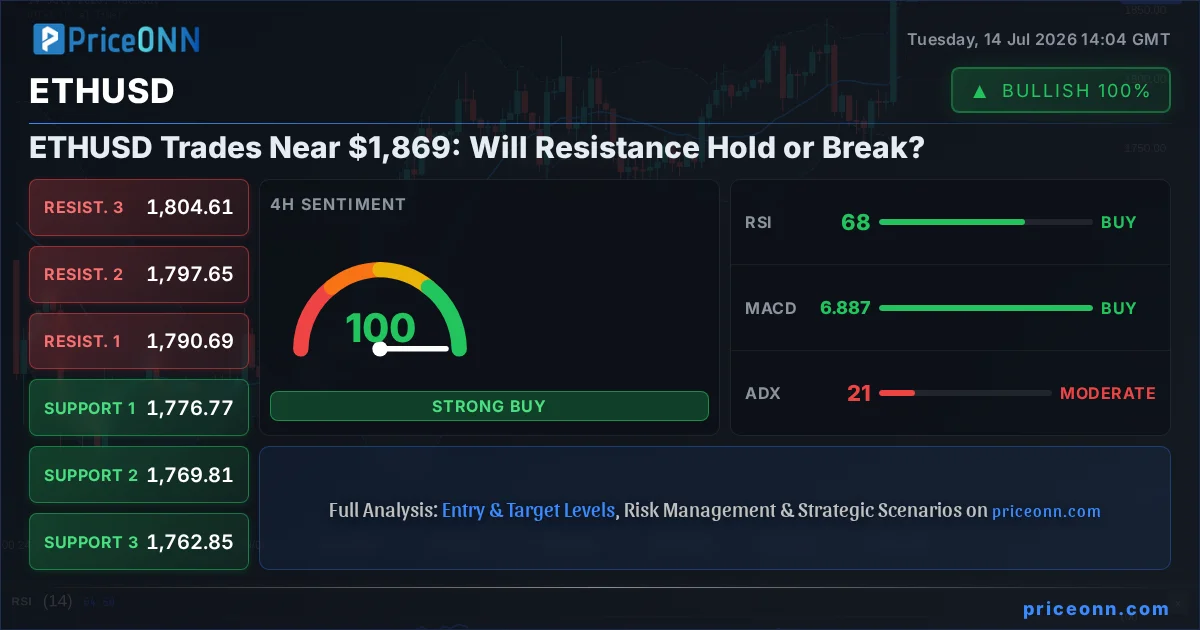
At $1,869.15, ETHUSD is standing at a critical juncture, flirting with significant resistance levels that have previously capped rallies. The question on every trader's mind is whether the current upward momentum is strong enough to shatter these barriers or if we're poised for a sharp correction. This ETHUSD today analysis delves into the intricate dance between bullish aspirations and bearish pressures, examining the technical indicators and market sentiment that will dictate the next move.
- ETHUSD faces crucial resistance near the $1,869.15 mark, with the 1-hour RSI at 68.41 indicating strong bullish momentum but nearing overbought territory.
- Critical resistance sits at $1,885.87 (1H R1), with a break above potentially targeting $1,912.63 (1H R2) in the short term.
- Support levels to watch are $1,812.20 (1H S1) and $1,765.29 (1H S2); a sustained break below these could signal a deeper pullback.
- The 4-hour chart shows ETHUSD at 56.2, suggesting a healthy uptrend is forming, but the daily chart's ADX at 25.11 indicates a relatively strong trend is still developing.
The cryptocurrency market, particularly Ethereum (ETHUSD), has experienced a notable surge, pushing prices towards previously established resistance zones. As of the latest data, ETHUSD is trading at exactly $1,869.15. This level is not just another number; it represents a psychological and technical barrier that has historically acted as a ceiling for price action. The recent upward push, which saw ETHUSD gain a significant 5.89% or $103.93 on the day, brings it squarely into the territory where sellers have previously stepped in. Understanding whether this resistance will hold or crumble is paramount for any trader looking to navigate the volatile crypto landscape.
The 1-hour timeframe presents a picture of strong bullish conviction. The RSI(14) is sitting at 68.41, indicating robust buying pressure but also bordering on overbought conditions. This suggests that while momentum is firmly to the upside, the market might be getting slightly overheated in the very short term. MACD is in positive territory, with the MACD line above the signal line, reinforcing the bullish sentiment on this timeframe. Stochastic oscillators are also showing a bullish signal, with %K (88.75) crossing above %D (77.06), further confirming the strength. However, the ADX at 24.45 points to a moderately strong uptrend, not yet a runaway train, implying that while the trend is up, it lacks extreme conviction for a decisive breakout just yet. The overall signal on the 1H chart leans heavily towards 'BUY' (8 Buys, 0 Sells, 0 Neutral), reflecting the immediate buying pressure.
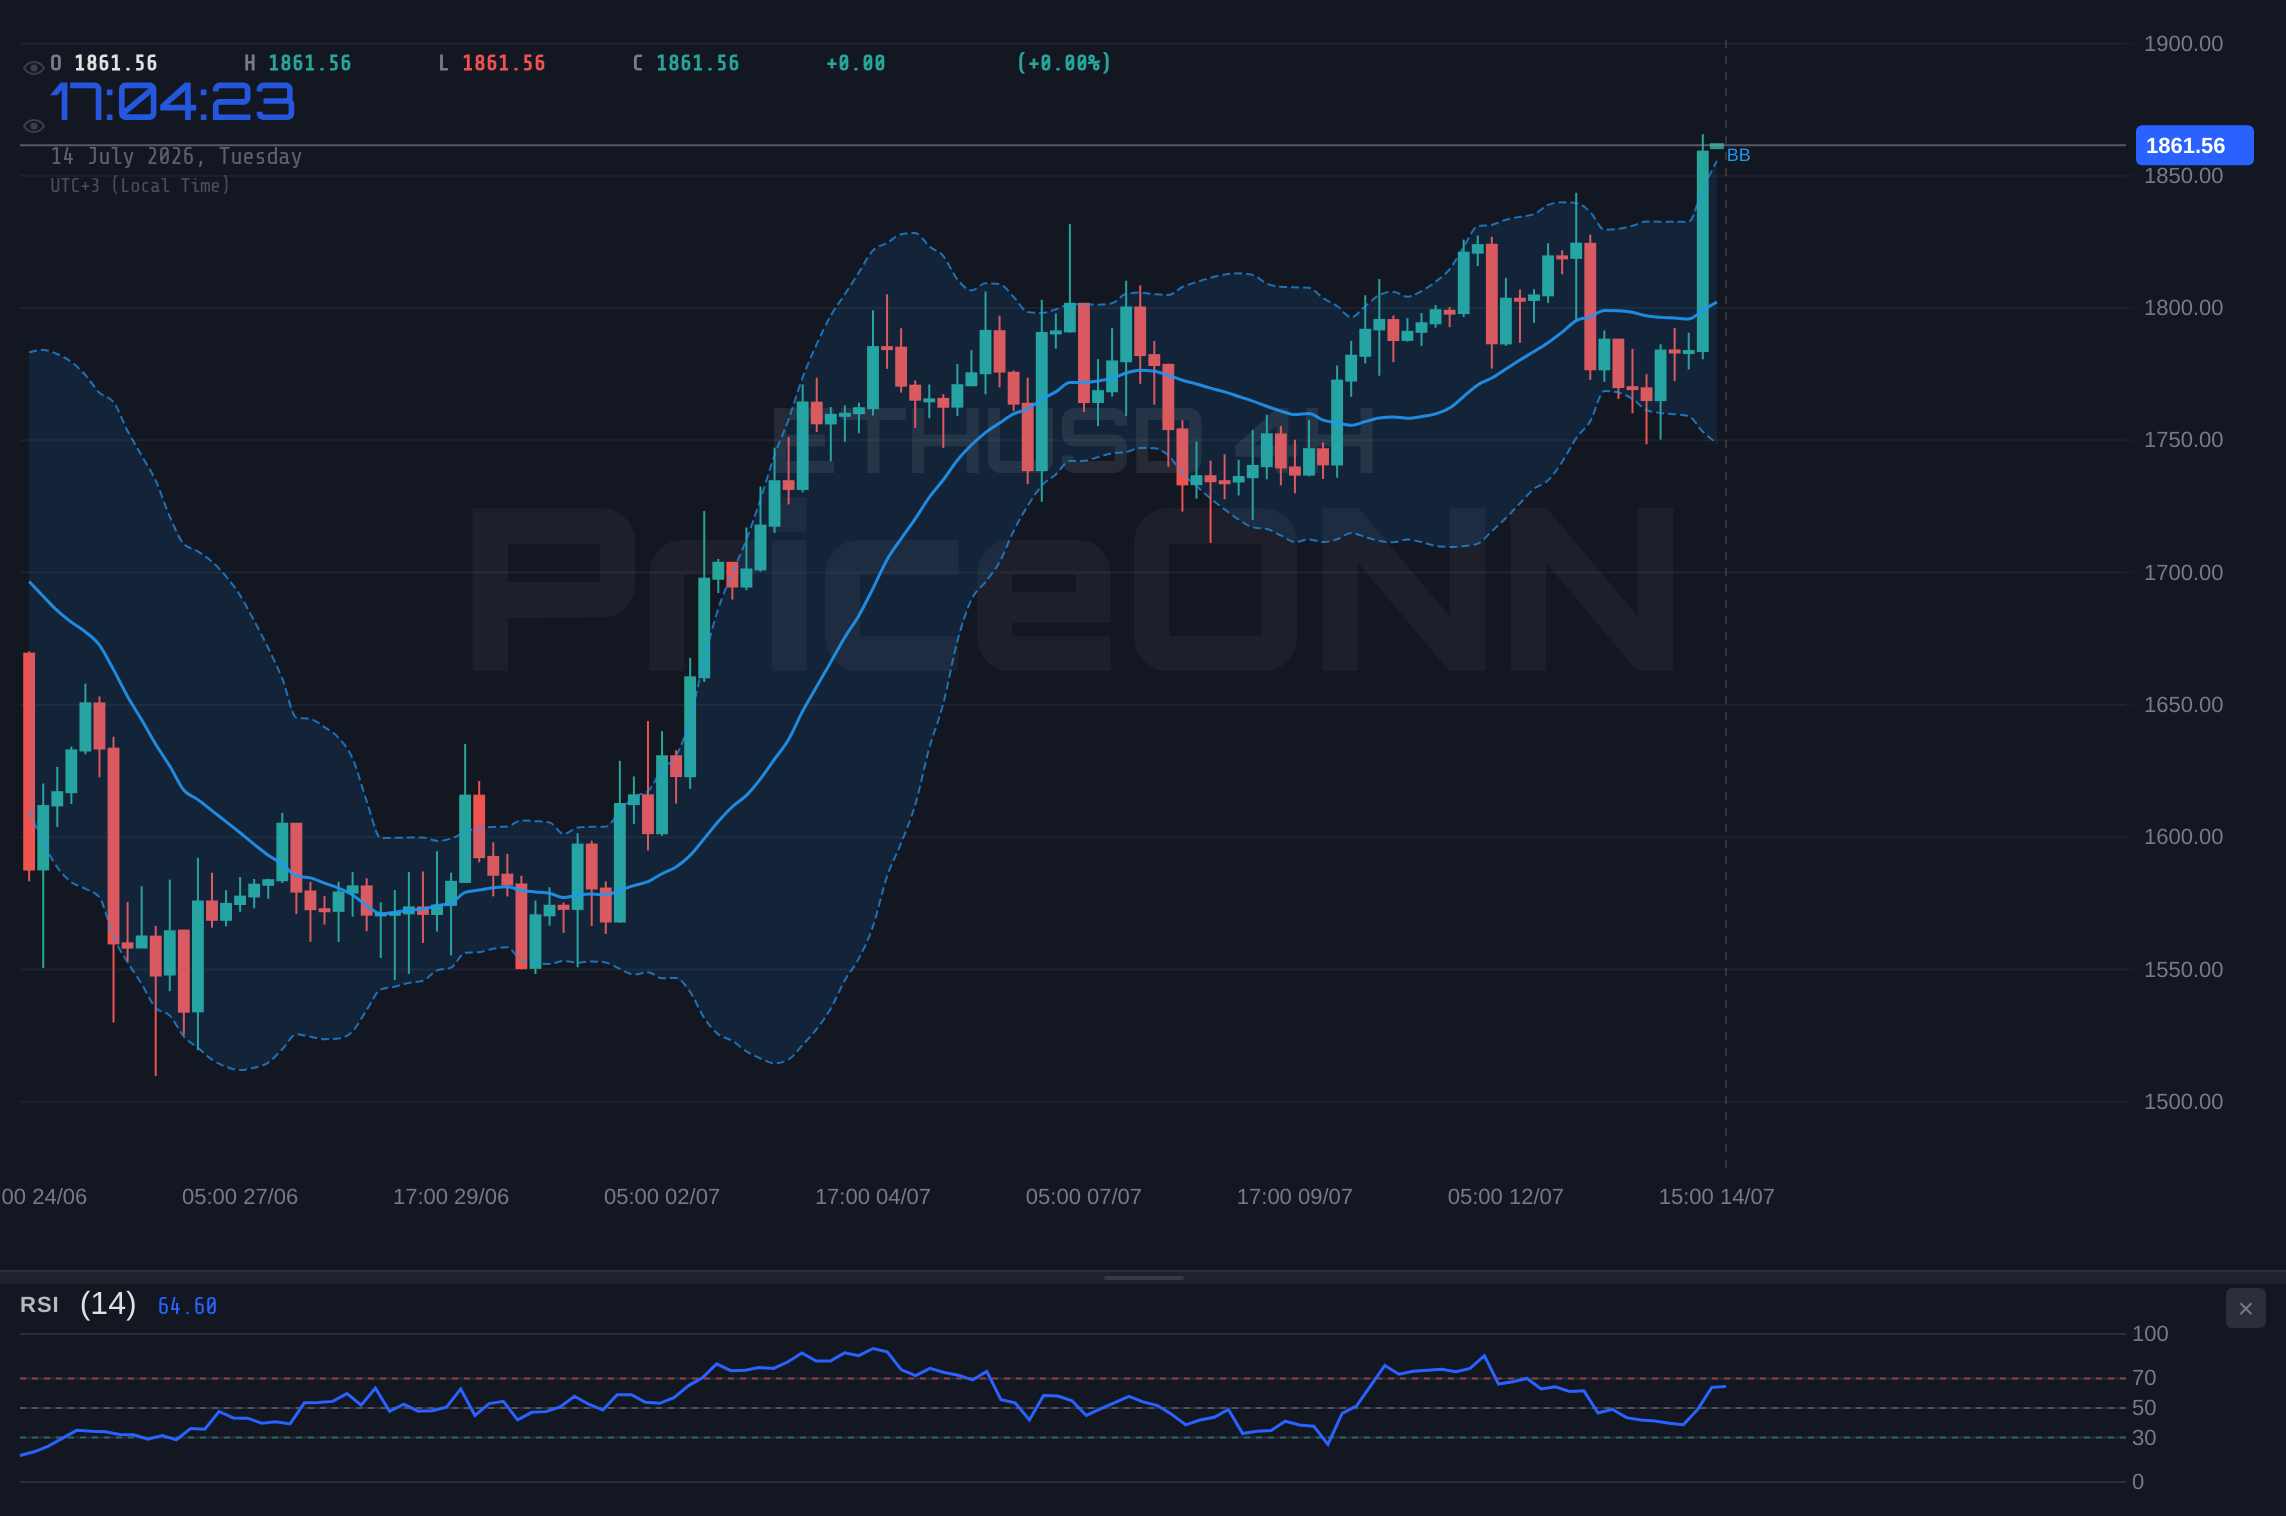
Shifting focus to the 4-hour chart, the technical landscape offers a slightly different perspective, though still largely positive. The RSI(14) at 56.2 suggests ETHUSD is in a healthy, neutral-to-bullish zone, far from being overbought. This indicates that the recent rally has room to breathe without immediately triggering profit-taking. The MACD, however, shows negative momentum on this timeframe, with the MACD line below the signal line, which contrasts with the 1-hour chart. This divergence warrants attention; it suggests that while buyers are active, the underlying momentum might be waning on a slightly longer timeframe. Bollinger Bands are positioned above the middle band, indicating an upward bias, and Stochastic continues to signal a buy, with %K (53.07) above %D (25.76). The ADX of 25.41 reinforces the idea of a strengthening uptrend. The 4H signals are predominantly 'BUY' (7 Buys, 1 Sell, 0 Neutral), but the MACD divergence is a subtle warning sign.
The Daily Grind: Where Trend Strength Meets Uncertainty
Zooming out to the daily chart, we see ETHUSD at $1,869.15, with the trend officially classified as 'Neutral' with a power of 50%. This neutrality is crucial. While shorter timeframes show bullishness, the daily perspective suggests a lack of strong directional conviction over a longer period. The RSI(14) at 51.97 is almost perfectly balanced, indicating neither overbought nor oversold conditions, and showing a slight upward tendency. The MACD is positive and above its signal line, aligning with the bullish bias seen on intraday charts. However, the ADX stands at 25.11, which on the daily timeframe can indicate a trend that is establishing itself but isn't yet overwhelmingly strong. This is a critical observation: the market is building energy, but the direction is not yet decisively set. The overall signal on the daily chart is 'BUY' (5 Buys, 3 Sells, 0 Neutral), but the neutral trend power and the ADX reading suggest caution is warranted.
The interplay between these different timeframes is where the real trading edge lies. The immediate bullishness on the 1-hour chart is being challenged by the neutral stance of the daily chart and the slight momentum divergence on the 4-hour chart. This creates a 'watch zone' scenario. We are not yet in a clear breakout above strong resistance, nor are we in a definitive downtrend. Instead, ETHUSD is consolidating its gains near a significant psychological level. Key support levels to monitor on the daily chart are $1,727.96 (S1), $1,690.70 (S2), and $1,632.90 (S3). Conversely, resistance levels above the current price are $1,823.02 (R1), $1,880.82 (R2), and $1,885.87 (R3). The price is currently hovering between the daily R1 and R2 levels, making the $1,869.15 price point a pivotal area.
Looking at the broader market context, the US Dollar Index (DXY) is currently trading at 100.7, showing a slight downtrend on the 1-hour and 4-hour charts, but a 'BUY' signal on the daily. A weaker dollar generally supports risk assets like ETHUSD, and this could be a tailwind for Ethereum. However, the DXY's daily chart shows a strong ADX of 30.88, indicating a solid underlying uptrend despite recent dips. This suggests that any dollar weakness might be temporary. Furthermore, the SP500 is trading at 6572.87, showing a strong daily uptrend (ADX 47.51), despite some mixed signals on intraday charts. A strong equities market typically correlates positively with crypto assets, providing a supportive environment for ETHUSD. However, the Nasdaq100, while showing a bullish 1H and 4H signal, has a neutral daily trend, highlighting a similar lack of strong conviction across major indices.
Geopolitical and macroeconomic factors are also playing a role. News reports indicate that US CPI data is expected to show inflation cooling, largely due to falling fuel prices. This could influence Federal Reserve policy expectations, potentially leading to a less hawkish stance, which would generally be positive for risk assets like ETHUSD. However, the market is also pricing in Fed hike bets, creating a tug-of-war. Reports of Bitcoin struggling to surpass $65,000 and trimming gains suggest that the broader crypto market sentiment might be cooling slightly, despite ETHUSD's individual strength. The correlation between gold and ETHUSD is also worth noting; gold is currently seeing pressure as oil surges and Fed hike bets build, leaving $4,000 increasingly vulnerable. While not a direct correlation, this indicates broader inflationary concerns and tightening monetary policy expectations that could eventually impact ETHUSD.
The Bull's Roadmap: Navigating Towards Higher Ground
For the bulls to maintain control and push ETHUSD higher, several conditions must be met. The immediate objective is to decisively break and hold above the current resistance zone around $1,869.15. A sustained push above the 1-hour resistance level at $1,885.87 is the first critical hurdle. If ETHUSD can clear this with strong volume and hold its ground, the next target would be the 4-hour resistance at $1,912.63. Beyond that, the next significant psychological and technical level to watch would be the daily resistance R2 at $1,880.82, and then R3 at $1,912.63 which aligns with the 4H resistance target. A clean break and hold above $1,912.63 could signal the start of a new upward leg, potentially targeting the $1,959.54 area (1H R3) in the medium term. Confirmation would come from sustained bullish RSI readings above 70 on the 4-hour chart and a daily ADX that begins to climb strongly above 30, indicating a robust trend. The DXY weakening further and SP500/Nasdaq continuing their upward trajectory would provide additional tailwinds for this bullish scenario.
Where Bears Take Control: The Risk of a Pullback
Conversely, the bearish case hinges on ETHUSD failing to overcome the immediate resistance at $1,869.15. If selling pressure intensifies around this level, we could see a move back towards the daily support S1 at $1,727.96. The 1-hour chart's RSI nearing overbought territory (68.41) and the MACD momentum divergence on the 4-hour chart are the primary indicators suggesting a potential reversal. A decisive break below the 1-hour support at $1,812.20 would be the first sign of weakness. If this level gives way, the next target would be the 4-hour support at $1,765.29. A further drop below this could signal a more significant pullback, potentially testing the daily support at $1,727.96. Invalidating the bullish thesis would require ETHUSD to close below the $1,765.29 level on the 4-hour chart. A strengthening DXY, a downturn in equities markets, or negative news regarding crypto regulations could all catalyze such a move. On the daily chart, if the ADX were to fall below 20 while price breaks lower, it would indicate a loss of trend strength and potential for a ranging market or further decline.
The Waiting Game: Consolidation Around Key Levels
It's also entirely possible that ETHUSD enters a period of consolidation, especially given the conflicting signals across different timeframes and the proximity to significant resistance. If neither the bulls nor the bears can gain decisive control, ETHUSD could trade within a defined range for a period. This scenario would likely see price action oscillating between the immediate support at $1,812.20 and the resistance around $1,885.87. During consolidation, technical indicators often give mixed signals. The RSI might hover in the 50-60 zone, MACD lines could cross back and forth around zero, and the ADX would likely remain relatively low, indicating a lack of strong trend. This 'waiting game' often precedes a larger move, as market participants digest new information, wait for economic data releases like the upcoming US CPI, or observe broader market sentiment shifts. In such a phase, breakout strategies become more appealing, waiting for price to decisively breach either the support or resistance boundaries of the range.
The Bull's Ascent: Breaking Resistance
55% ProbabilityThe Sideways Shuffle: Range-Bound Trading
30% ProbabilityThe Bear's Retreat: Pullback to Support
15% ProbabilityGiven the current technical setup, the most probable scenario appears to be a continuation of the bullish momentum, albeit with caution due to the approaching resistance and mixed signals on longer timeframes. The strength shown on the 1-hour and 4-hour charts, coupled with a generally supportive macro environment (weakening DXY, strong equities), suggests that bulls have the upper hand in the very short to medium term. However, the resistance at $1,869.15 and the confluence of potential overbought conditions on intraday charts mean that a period of consolidation or a minor pullback before a decisive breakout is also highly plausible. The probability leans towards the bullish scenario (55%), with a significant chance of consolidation (30%) and a lower probability for a sharp bearish reversal (15%) unless key support levels are breached decisively.
What I'm Watching This Week: Key Triggers for ETHUSD
As we move through the week, several key factors will be critical in determining ETHUSD's trajectory. Firstly, the upcoming US CPI data release is paramount. Any print that deviates significantly from expectations could trigger substantial volatility across markets, impacting the DXY, equities, and consequently, ETHUSD. A cooler-than-expected inflation report could fuel the bullish scenario by reducing Fed tightening fears, while a hotter report might do the opposite. Secondly, the price action around the $1,885.87 resistance level is crucial. A confirmed breakout above this level, especially with increasing volume, would be a strong bullish signal. Conversely, a failure to break and a subsequent drop below $1,812.20 would invalidate the bullish thesis and open the door for a deeper correction. Finally, I'll be monitoring ETHUSD's correlation with Bitcoin and the broader crypto market sentiment. While ETHUSD has shown strength, a significant downturn in BTCUSD could drag Ethereum down with it, regardless of its individual technical setup.
Frequently Asked Questions: ETHUSD Analysis
What happens if ETHUSD breaks above the $1,885.87 resistance level?
A sustained break above $1,885.87, confirmed by strong volume on the 1-hour chart, would likely trigger a bullish move targeting $1,912.63. This would signal that the bulls have overcome the immediate selling pressure and are aiming for higher ground, potentially extending towards $1,959.54.
Should I consider buying ETHUSD at current levels near $1,869.15, given the RSI is at 68.41?
Buying directly at resistance with an RSI nearing overbought territory carries significant risk. A more prudent approach would be to wait for either a confirmed breakout above $1,885.87 or a pullback to a key support level like $1,812.20, where the risk/reward ratio might be more favorable.
Is the MACD divergence on the 4-hour chart a strong sell signal for ETHUSD?
The MACD divergence on the 4-hour chart (negative momentum despite price gains) is a cautionary signal, not a definitive sell signal on its own. It suggests that the upward momentum might be weakening and warrants watching for confirmation from price action, such as a break below support levels.
How might the upcoming US CPI data affect ETHUSD this week?
A cooler-than-expected CPI report could boost ETHUSD by reducing fears of aggressive Fed rate hikes, potentially supporting a move towards higher resistance levels. Conversely, a hotter report might dampen sentiment and lead to a pullback towards support as market participants anticipate tighter monetary policy.
Technical Outlook Summary
| Indicator | Value | Signal | Interpretation |
|---|---|---|---|
| RSI (14) | 68.41 | Neutral | Nearing overbought on 1H, healthy on 4H. |
| MACD Histogram | Positive | Bullish | Positive momentum on 1H/1D, but divergence on 4H. |
| Stochastic | K=88.75, D=77.06 | Bullish | Bullish crossover on 1H, signals strength. |
| ADX | 25.11 | Bullish | Indicates a developing trend, stronger on Daily. |
| Bollinger Bands | Upper Band | Watch | Price near upper band suggests potential overheating. |
Key Levels for ETHUSD
Support Levels
Resistance Levels
Track markets in real-time
AI-powered analysis, technical indicators and real-time price data.
Join Our Telegram Channel
Breaking market news, AI analysis and trading signals instantly.
Join Channel