

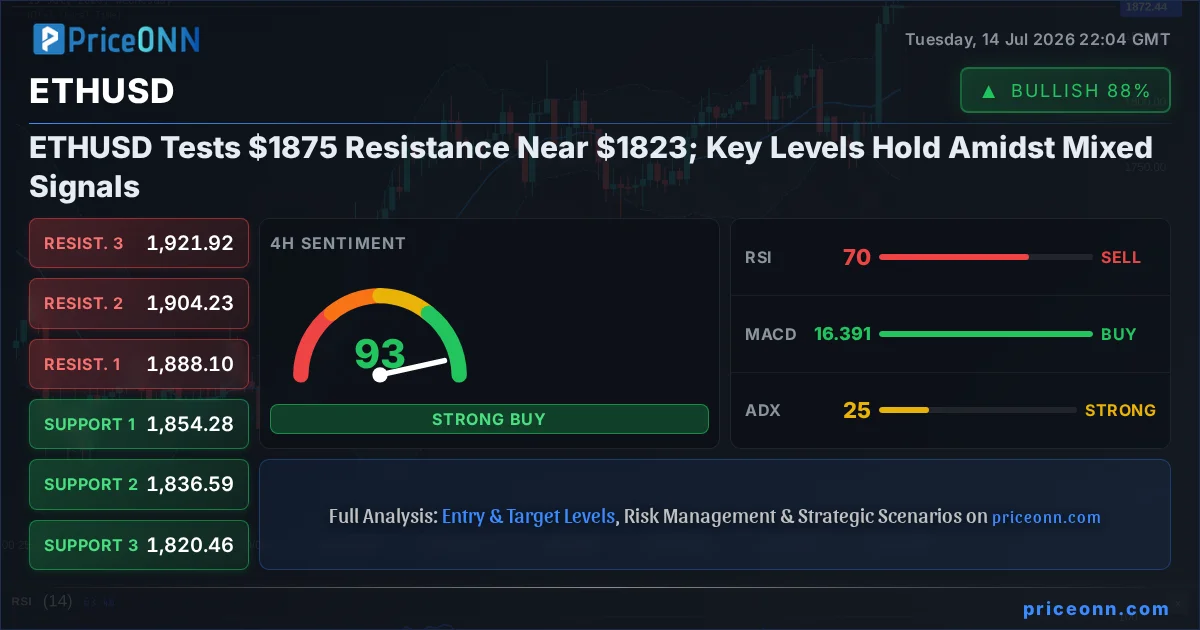
ETHUSD has staged a remarkable recovery, surging towards the $1,875 resistance zone. This impressive climb brings the price near the $1,823 support level, a critical juncture for traders assessing the next directional move. The question on everyone's mind is whether this upward momentum can be sustained or if we're merely seeing a temporary reprieve before further volatility. This ETHUSD today analysis delves into the intricate technical tapestry woven by multiple timeframes and indicators to decipher the market's true intent.
- RSI at 75.47 on the 1H chart signals strong overbought pressure, suggesting a potential pullback is imminent for ETHUSD.
- Critical support for ETHUSD sits at $1,823.02, a level that has held firm during recent volatility and is now being closely watched.
- The MACD histogram showing positive momentum across multiple timeframes indicates underlying buying interest, but divergence warnings are present.
- ETHUSD's correlation with DXY movements is a key factor; with DXY at 100.94 and showing a mixed short-term outlook, currency market dynamics are influencing crypto trends.
The cryptocurrency market, particularly Ethereum (ETHUSD), has been a spectacle of dynamic price action. After navigating a period of consolidation, ETHUSD has broken out with significant force, trading at $1,873.34. This surge places it squarely at a pivotal resistance level, with the immediate upper boundary identified at $1,875.93 on the 1-hour chart and a more significant hurdle at $1,888.10 on the 4-hour chart. Understanding the forces driving this price action requires a granular look at the technical indicators and their interplay across different timeframes, from the fast-paced 1-hour chart to the more established daily view. The current market sentiment, influenced by broader macroeconomic factors and specific crypto-related news, adds another layer to this complex analysis. This ETHUSD price forecast aims to provide clarity amidst the noise.
Navigating the 1-Hour Chart: A Battle for Momentum
On the 1-hour chart, ETHUSD is currently displaying a potent bullish trend, boasting a strength of 98%. The price action has pushed towards the immediate resistance at $1,875.93, with subsequent levels at $1,878.73 and $1,880.89. This upward push is supported by a generally positive MACD, which shows momentum above its signal line, indicating that buying pressure has been dominant in the short term. The Stochastic Oscillator, however, presents a conflicting signal. With %K at 78.02 and %D at 85.5, the %K line has crossed below the %D line, suggesting a potential downturn or at least a cooling of the bullish fervor. This divergence is a classic sign that the current rally might be losing steam, even as the price continues to climb. The RSI(14) is also flashing a warning at 75.47, firmly entrenched in overbought territory. While an RSI above 70 doesn't automatically signal a sell, it does indicate that the asset has experienced significant upward movement and may be due for a correction or consolidation. The ADX, a measure of trend strength, sits at a robust 35.89, confirming that the current move is part of a strong uptrend, but this doesn't preclude short-term pullbacks.
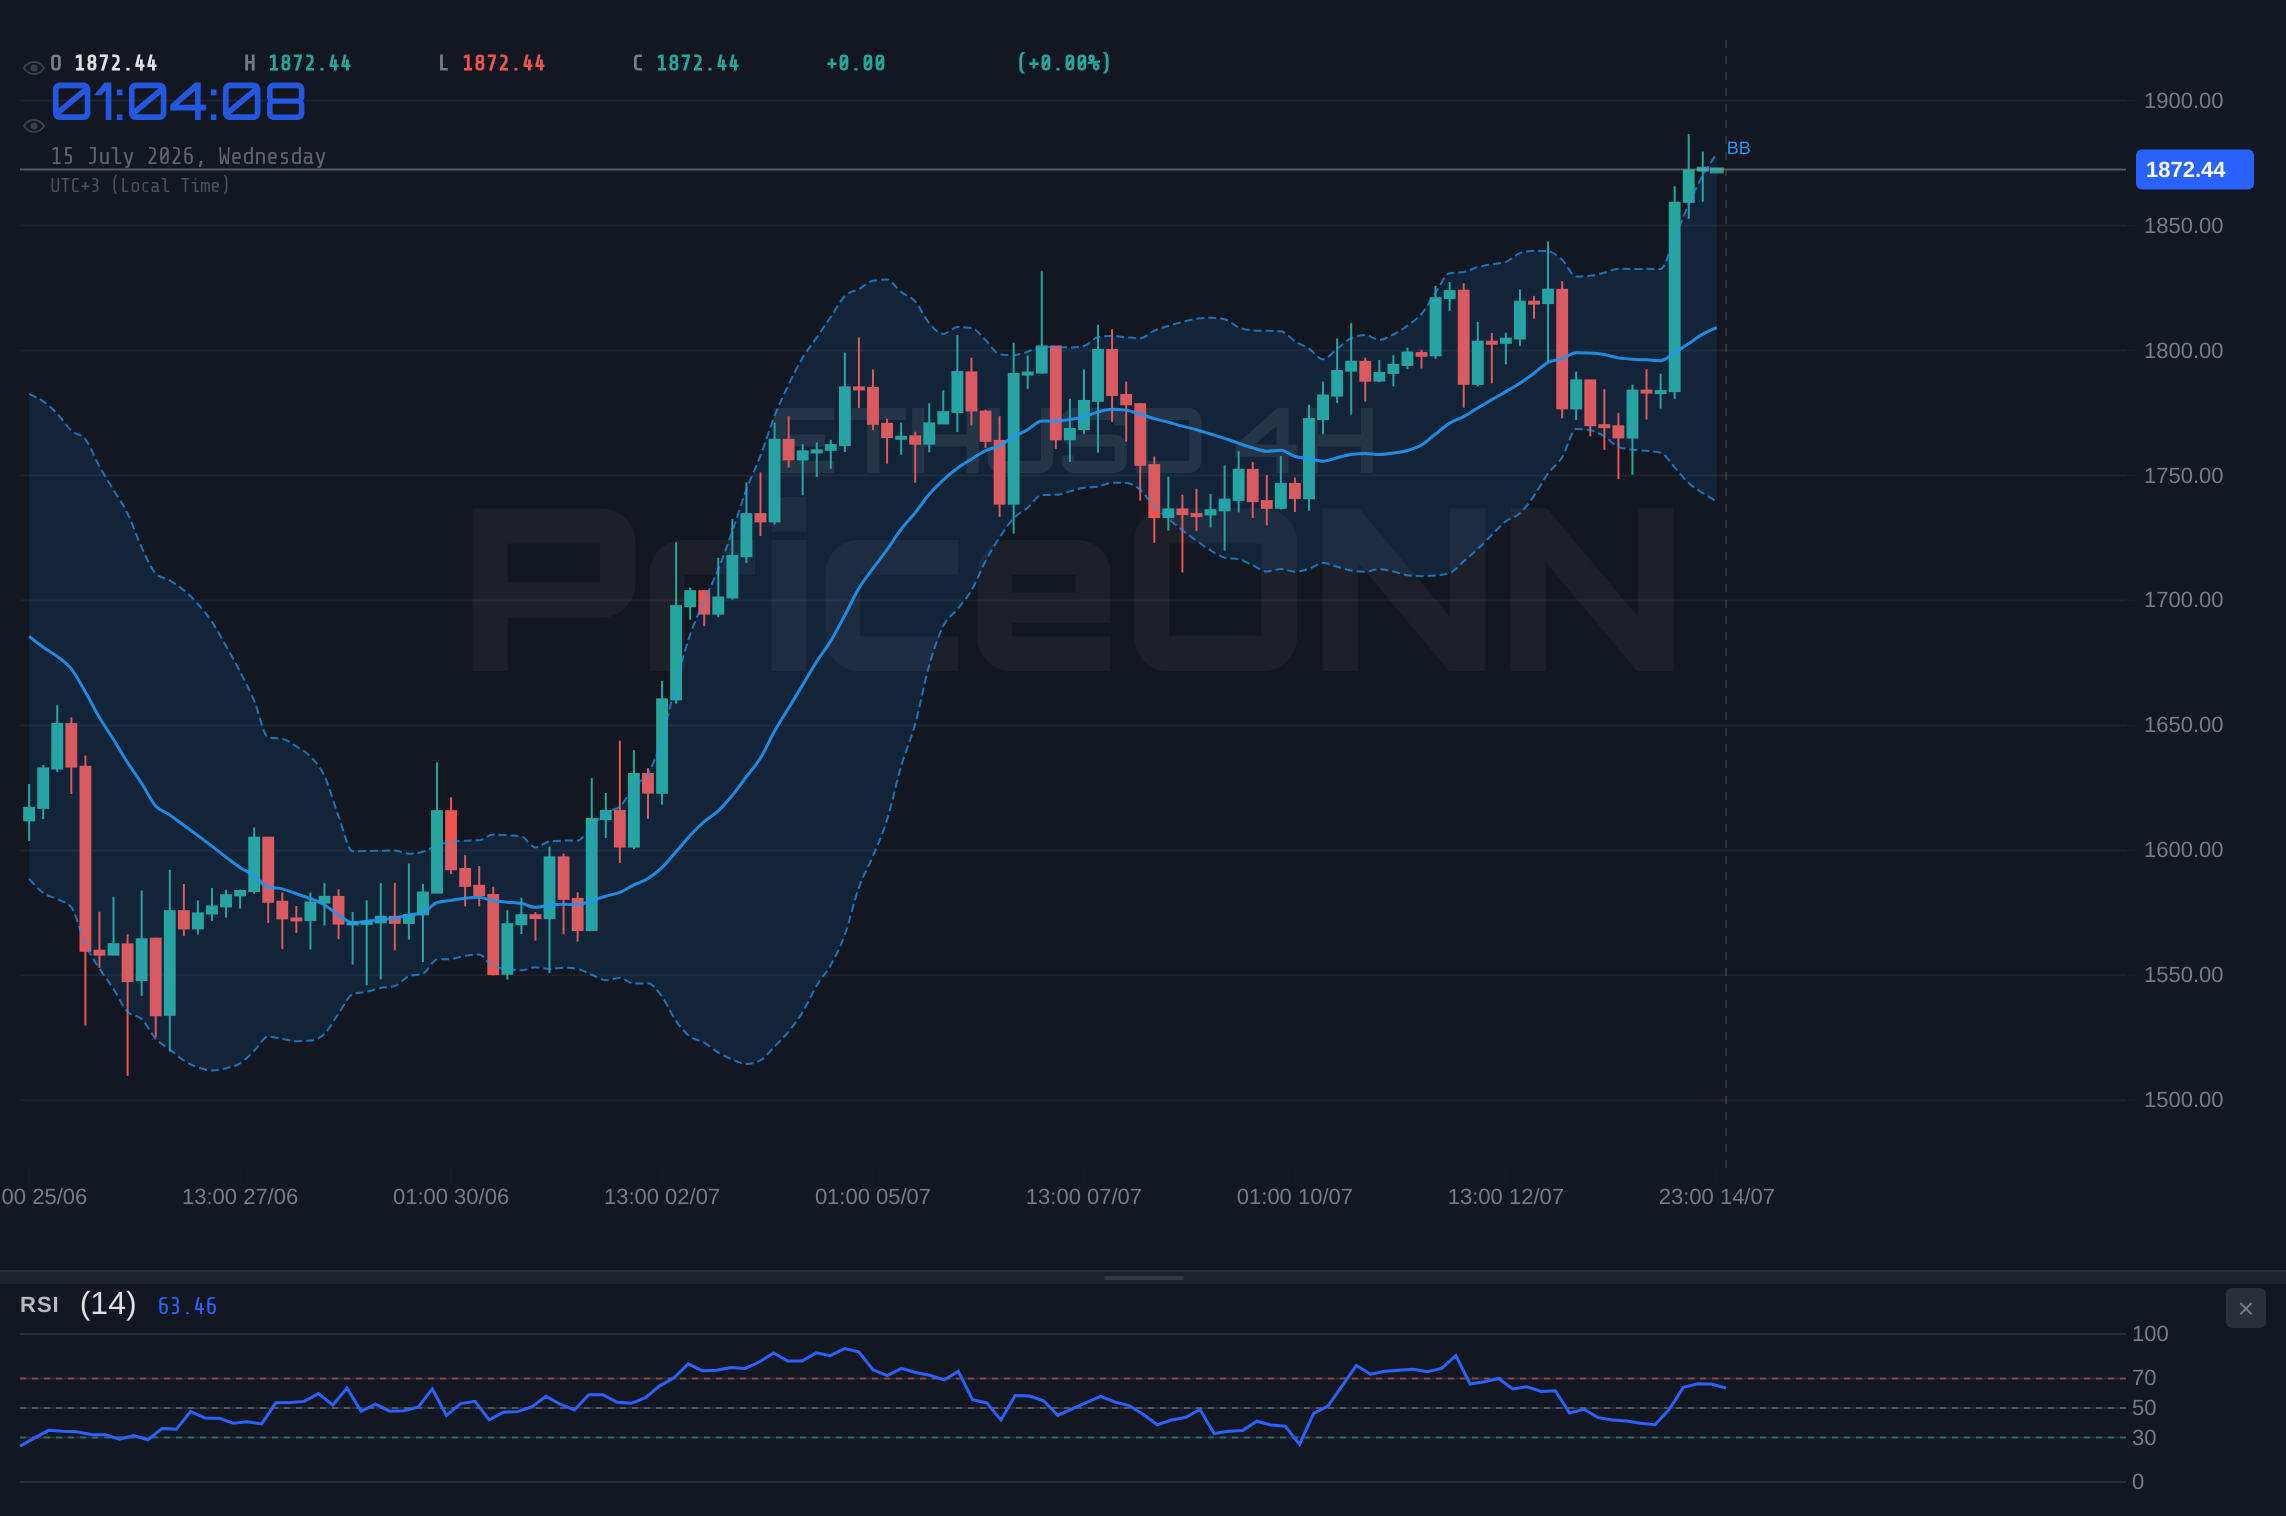
The support levels on the 1-hour chart are closely watched, starting at $1,870.97, followed by $1,868.81, and then $1,866.01. A break below these levels could signal a shift in short-term sentiment. The general signal for the 1H timeframe is AL (Buy: 6, Sell: 2, Neutral: 0), reflecting the strong upward momentum. However, the conflicting signals from the Stochastic and RSI cannot be ignored. This ETHUSD trend analysis highlights the immediate battle between buyers pushing higher and the potential for profit-taking as the price approaches overbought conditions. Traders are keenly observing whether the bulls can break through the $1,875.93 resistance, or if the bears will capitalize on the overextended indicators.
The 4-Hour Perspective: Building a Base for a Larger Move?
Shifting to the 4-hour timeframe, ETHUSD's trend is still predominantly bullish, with a strength of 83%. The price is currently hovering around $1,873.34, well above the 4-hour support levels of $1,854.28, $1,836.59, and $1,820.46. The key resistance levels to watch on this timeframe are $1,888.10, $1,904.23, and $1,921.92. Here, the MACD continues to show positive momentum, with the MACD line above the signal line, reinforcing the idea of underlying buying interest. The Bollinger Bands are widening slightly and the price is trading above the middle band, suggesting an upward bias. The RSI(14) is at 70.17, firmly in overbought territory, echoing the sentiment from the 1-hour chart. This suggests that the current rally is extensive, and a pullback is a distinct possibility. The Stochastic Oscillator offers a more bullish outlook here, with %K at 91.42 and %D at 51.81, indicating that %K has surged past %D, signaling strong bullish momentum and potentially still room for upward movement before reaching extreme overbought conditions.
The ADX on the 4-hour chart stands at 25.43, indicating a strong uptrend. This aligns with the overall bullish sentiment but must be considered alongside the overbought RSI. The general signal for the 4H timeframe is AL (Buy: 7, Sell: 1, Neutral: 0), leaning towards continued upside. The presence of strong uptrend confirmation from the ADX, coupled with positive MACD momentum, suggests that despite the overbought RSI, the path of least resistance may still be upwards. However, the overbought RSI is a crucial cautionary flag. It implies that the market is becoming extended and vulnerable to a reversal or at least a period of consolidation. This ETHUSD key level analysis highlights the importance of the $1,820-$1,823 zone as a potential floor should any significant profit-taking occur.
Daily Timeframe: The Long-Term Picture and Trend Strength
On the daily chart, ETHUSD presents a more neutral picture, with trend strength at 50%. This suggests that while recent price action has been strongly directional, the longer-term trend is less defined or in a state of transition. The current price of $1,873.34 is approaching the daily resistance at $1,880.82, with further levels at $1,918.08 and $1,921.92. The support levels on this timeframe are more substantial, beginning at $1,727.96, followed by $1,690.70, and then $1,632.90. The MACD is positive and above its signal line, indicating bullish momentum, which aligns with the recent price surge. However, the RSI(14) is at 61.75, in the neutral zone but leaning towards bullish, suggesting there is still room for upside before reaching extreme overbought conditions on this longer timeframe. The Stochastic Oscillator, with %K at 74.25 and %D at 77.4, is showing a slight bearish divergence, as %K is below %D and trending downwards from a higher level, hinting at potential cooling momentum.
The ADX on the daily chart is 21.47, indicating a moderately strong uptrend. This aligns with the MACD and RSI, suggesting that the overall market structure supports higher prices. The general signal for the 1D timeframe is AL (Buy: 6, Sell: 2, Neutral: 0). The confluence of positive MACD and a moderately strong ADX trend suggests that the longer-term outlook remains constructive. However, the Stochastic's bearish lean and the approaching resistance levels mean that the upside might be capped in the short to medium term. The critical support at $1,727.96 remains a significant level that, if breached, would invalidate the bullish thesis on the daily chart. This multi-timeframe analysis provides a balanced view; while short-term indicators show overbought conditions, the daily chart still offers room for growth, contingent on breaking key resistance levels.
Correlation Analysis: DXY, Equities, and Oil's Influence
The performance of ETHUSD cannot be viewed in isolation. Its correlation with broader market movements, particularly the US Dollar Index (DXY), major stock indices like the S&P 500 and Nasdaq 100, and commodity prices like Brent crude oil, offers crucial context. Currently, the DXY is trading at 100.94, down 0.36% on the day. The DXY's 1-hour chart shows a bearish trend, while the 4-hour is neutral, and the daily shows a slight bullish bias. This mixed picture for the dollar suggests it's not a strong headwind or tailwind for risk assets like ETHUSD at this precise moment. Historically, a strengthening DXY often puts pressure on gold and other commodities, and can sometimes correlate with a risk-off sentiment that impacts cryptocurrencies. Conversely, a weakening dollar can fuel inflation fears and boost demand for alternative assets.
The S&P 500 is trading at 6572.87, up 0.74%, and the Nasdaq 100 is at 29588.81, up 1.26%. Both indices are showing strong bullish momentum on the 1-hour and 4-hour charts, indicating a healthy risk appetite in the equity markets. This is generally supportive of cryptocurrencies, as they often move in tandem with tech stocks. The ADX on the S&P 500's 1-hour chart is at a high 49.72, confirming a strong uptrend, though RSI is nearing overbought territory. This positive equity sentiment can spill over into ETHUSD, encouraging buyers. Brent crude oil is trading at $84.31, up 1.98%, and WTI at $79.99, up 2.42%. Rising oil prices can signal increasing inflation expectations, which could be a double-edged sword for crypto. While it might increase demand for inflation hedges, it could also prompt central banks to adopt tighter monetary policies, which typically dampens risk asset performance. The current surge in oil prices, coupled with the strong equity performance, creates a complex macroeconomic backdrop for ETHUSD.
Economic Calendar and Geopolitical Undercurrents
The economic calendar provides potential catalysts that could significantly impact ETHUSD's trajectory. The recent news highlights the anticipation of US CPI data, expected to show cooling inflation due to falling fuel prices. While the BLS is set to release the June CPI report, the market has already seen some reaction with EURUSD showing modest gains and the Euro rising against the USD. The report's actual figures against expectations will be crucial. If inflation comes in lower than anticipated, it could reinforce expectations of a Fed pause or even rate cuts, generally a positive for risk assets like ETHUSD. Conversely, higher-than-expected inflation could reignite fears of further tightening, posing a risk. The article also notes that Dow Jones futures are trading lower ahead of earnings from Wall Street lenders, indicating some caution in the broader market despite recent gains.
Geopolitical tensions, though not explicitly detailed in the provided snippets for direct ETHUSD impact, always cast a shadow. Any escalation in regions like the Middle East, or significant developments in US-China relations, can trigger risk-off sentiment. This would typically lead to a strengthening of the DXY and a sell-off in risk assets, potentially pulling ETHUSD down, especially if it breaks below key support levels like $1,823.02. The current news flow about Bitcoin looking vulnerable due to mounting downside risks, despite its strong gains, also adds to the cautious narrative. This ETHUSD trading signal analysis must therefore consider not just the technicals but also the broader macro and geopolitical landscape. The market is pricing in Fed rate expectations, and any indication from upcoming data or central bank commentary that deviates from this expectation could cause significant price swings.
Trade Scenarios: Mapping the Path Forward
Bearish Scenario: Profit-Taking Pressure Mounts
65% ProbabilityNeutral Scenario: Consolidation Around Resistance
25% ProbabilityBullish Scenario: Momentum Carries Through
10% ProbabilityThe technical indicators paint a mixed picture, but the immediate overbought conditions on the shorter timeframes, coupled with the significant resistance at $1,875.93, lend weight to the bearish scenario. The RSI at 75.47 on the 1H chart is a strong signal that the current rally might be overextended. While the daily chart shows room for growth, the short-term indicators suggest a potential pullback is more probable in the immediate future. The 65% probability assigned to the bearish scenario reflects the caution warranted by these overbought readings and the proximity to resistance. The neutral scenario, with a 25% probability, accounts for the possibility of consolidation as the market digests recent gains and awaits clearer directional cues from upcoming economic data or clearer technical breaks. The bullish scenario, carrying a 10% probability, remains a possibility if strong buying pressure emerges, but it currently appears less likely given the short-term technical headwinds.
What to Watch Next: Key Levels and Data Releases
For ETHUSD traders, the $1,875.93 level on the 1-hour chart is the immediate focus. A failure to break decisively above this resistance, especially with the RSI in overbought territory, could lead to a pullback towards the $1,866.01 support. A more significant move lower would target the $1,854.28 level on the 4-hour chart, and ultimately the crucial daily support at $1,823.02. If, however, ETHUSD manages to break and hold above $1,875.93, the next resistance to watch is $1,888.10 on the 4-hour chart. This ETHUSD trading signal analysis emphasizes the importance of price action around these levels. Upcoming US CPI data will be a key macro driver. A softer inflation print could support a move higher, while hotter-than-expected data might trigger a risk-off move, benefiting the dollar and potentially pressuring ETHUSD. Traders should also keep an eye on the DXY's reaction to this data, as its movement often provides clues about broader market sentiment.
The strength of the uptrend on the ADX across multiple timeframes suggests that any pullback might be a healthy correction within a larger bullish structure, rather than a full reversal. However, the overbought RSI on shorter timeframes cannot be dismissed. Patience will be key; waiting for confirmation of a break above resistance or a clear bounce from support is advisable. The market is currently in a delicate balance, with strong short-term momentum meeting overbought conditions and significant resistance. The interplay between equities, the dollar, and oil prices will also be crucial in determining the broader risk appetite, which directly influences ETHUSD's performance. Monitoring these correlated assets and upcoming economic releases will be paramount for navigating the next phase of ETHUSD's price discovery.
Frequently Asked Questions: ETHUSD Analysis
What happens if ETHUSD fails to break above the $1,875.93 resistance in the next 24 hours?
If ETHUSD fails to decisively break above $1,875.93 resistance, especially with the 1-hour RSI at 75.47 signaling overbought conditions, a pullback is likely. This could see prices retest the $1,866.01 support level, with a more significant move targeting the $1,854.28 zone.
Should I consider buying ETHUSD at current levels around $1,873.34 given the mixed technical signals?
Buying at current levels carries risk due to overbought indicators on shorter timeframes and proximity to resistance. A more prudent approach might be to wait for a clear break above $1,875.93 with strong volume, or a confirmed bounce from a key support level like $1,854.28, with a 65% bearish scenario probability.
Is the RSI at 75.47 a definitive sell signal for ETHUSD right now?
An RSI of 75.47 on the 1-hour chart indicates strong overbought conditions, suggesting the rally may be extended. While not a direct sell signal on its own, it warrants caution and increases the probability of a short-term pullback or consolidation, especially when viewed alongside other indicators.
How might upcoming US CPI data impact ETHUSD's price around $1,873.34?
Softer-than-expected US CPI data could boost risk appetite, potentially supporting ETHUSD towards higher resistance levels. Conversely, hotter inflation might trigger a risk-off sentiment, strengthening the DXY and pressuring ETHUSD lower, possibly towards the $1,823.02 support.
Technical Outlook Summary
| Indicator | Value | Signal | Interpretation |
|---|---|---|---|
| RSI (14) | 61.75 | Neutral | Leaning bullish, but daily RSI shows room for upside. |
| MACD Histogram | +108.12 | Bullish | Positive momentum across most timeframes. |
| Stochastic | K=74.25, D=77.40 | Bearish | Daily shows bearish crossover, 1H/4H are mixed. |
| ADX | 21.47 | Bullish | Moderately strong uptrend on the daily chart. |
| Bollinger Bands | Middle Band Breakout | Bullish | Price above middle band on daily, suggesting upward bias. |
Key Levels
Support Levels
Resistance Levels
Track markets in real-time
AI-powered analysis, technical indicators and real-time price data.
Join Our Telegram Channel
Breaking market news, AI analysis and trading signals instantly.
Join Channel