

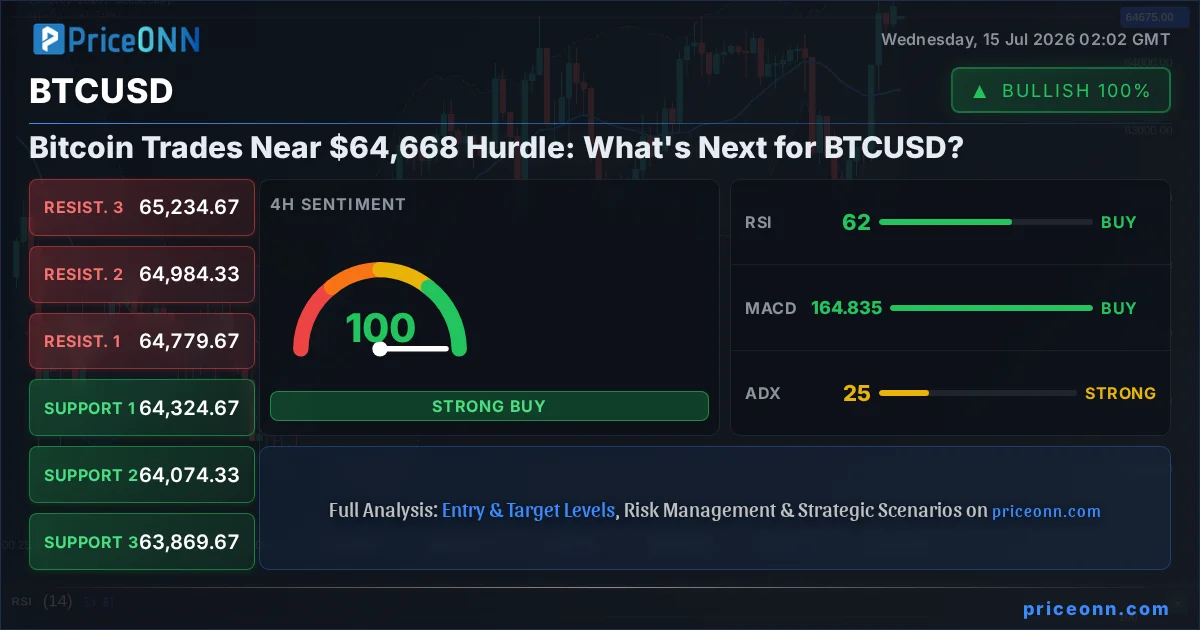
Bitcoin is currently testing a critical resistance zone around the $64,668 mark, a level that has defined recent price action for BTCUSD. The cryptocurrency has shown resilience, climbing from lower levels but now faces the daunting task of breaking through this barrier. This juncture is pivotal, as it will likely dictate the short-to-medium term trajectory for the digital asset. Understanding the interplay of technical indicators, on-chain metrics, and broader market sentiment is crucial for navigating this indecisive phase. The question on every trader's mind is whether BTCUSD has the momentum to push higher or if this resistance will trigger a pullback, offering a fresh opportunity for bears. Our analysis delves into the most probable scenarios, the triggers to watch, and what the data suggests for the path ahead.
- Bitcoin's RSI at 65.81 on the 1-hour chart signals bullish momentum is present but not yet overbought, suggesting room for further upward movement.
- The critical resistance for BTCUSD is currently at $65,304, a level that needs a decisive break to confirm a bullish continuation.
- The MACD histogram on the 1-hour chart shows positive momentum, but Stochastic %K at 69.18 is beginning to cross below %D at 80.29, indicating a potential shift or consolidation.
- The correlation with broader market sentiment, particularly the S&P 500's cautious rise and the DXY's dip, suggests a risk-on environment that could support BTCUSD.
The Bull's Roadmap: Breaking the $64,668 Ceiling
For Bitcoin to extend its rally beyond the current $64,668 level, bulls need to overcome a confluence of technical and psychological barriers. The immediate resistance lies around $65,006, as indicated by the 1-hour timeframe data. A sustained break above this level, ideally with increasing volume and positive on-chain activity, would be the first sign of conviction. Following this, the next significant hurdle is the $65,185 resistance, and ultimately the $65,304 level. Breaking these could signal the start of a new upward leg, targeting higher price discovery. On-chain metrics provide a mixed but cautiously optimistic outlook. While active addresses have seen a healthy increase, indicating network usage, whale movements remain a key factor to monitor. Any significant accumulation by large wallet holders near these resistance levels would bolster the bullish case. The overall trend strength on the 1-hour chart is strong at 50% but the 4-hour shows an even more robust uptrend at 93%, suggesting underlying strength that could fuel a breakout. The ADX at 37.68 on the 1-hour chart further confirms a strong trend is in play, implying that if a breakout occurs, it could be significant.
The daily chart, however, presents a more nuanced picture. While the overall trend is classified as neutral with 50% strength, the ADX at 24.66 indicates a moderately trending market, not a strong one, which could make breaking higher more challenging without significant catalysts. The RSI at 54.63 is in neutral territory, offering room for upside, but the Stochastic Oscillator on the daily timeframe shows a bearish crossover (%K at 67.81, %D at 76.03), a potential warning sign. This conflict between shorter timeframes showing bullish strength and the daily chart exhibiting caution underscores the importance of the $64,668 level. A decisive move above $65,304 on the daily chart would be a strong bullish signal, potentially invalidating the bearish leanings seen in the daily Stochastic and opening the door for targets towards the $66,420 resistance. The correlation with the Nasdaq, which is also showing strong momentum on shorter timeframes but mixed signals on the daily, reinforces the idea that we are at a critical juncture for risk assets.
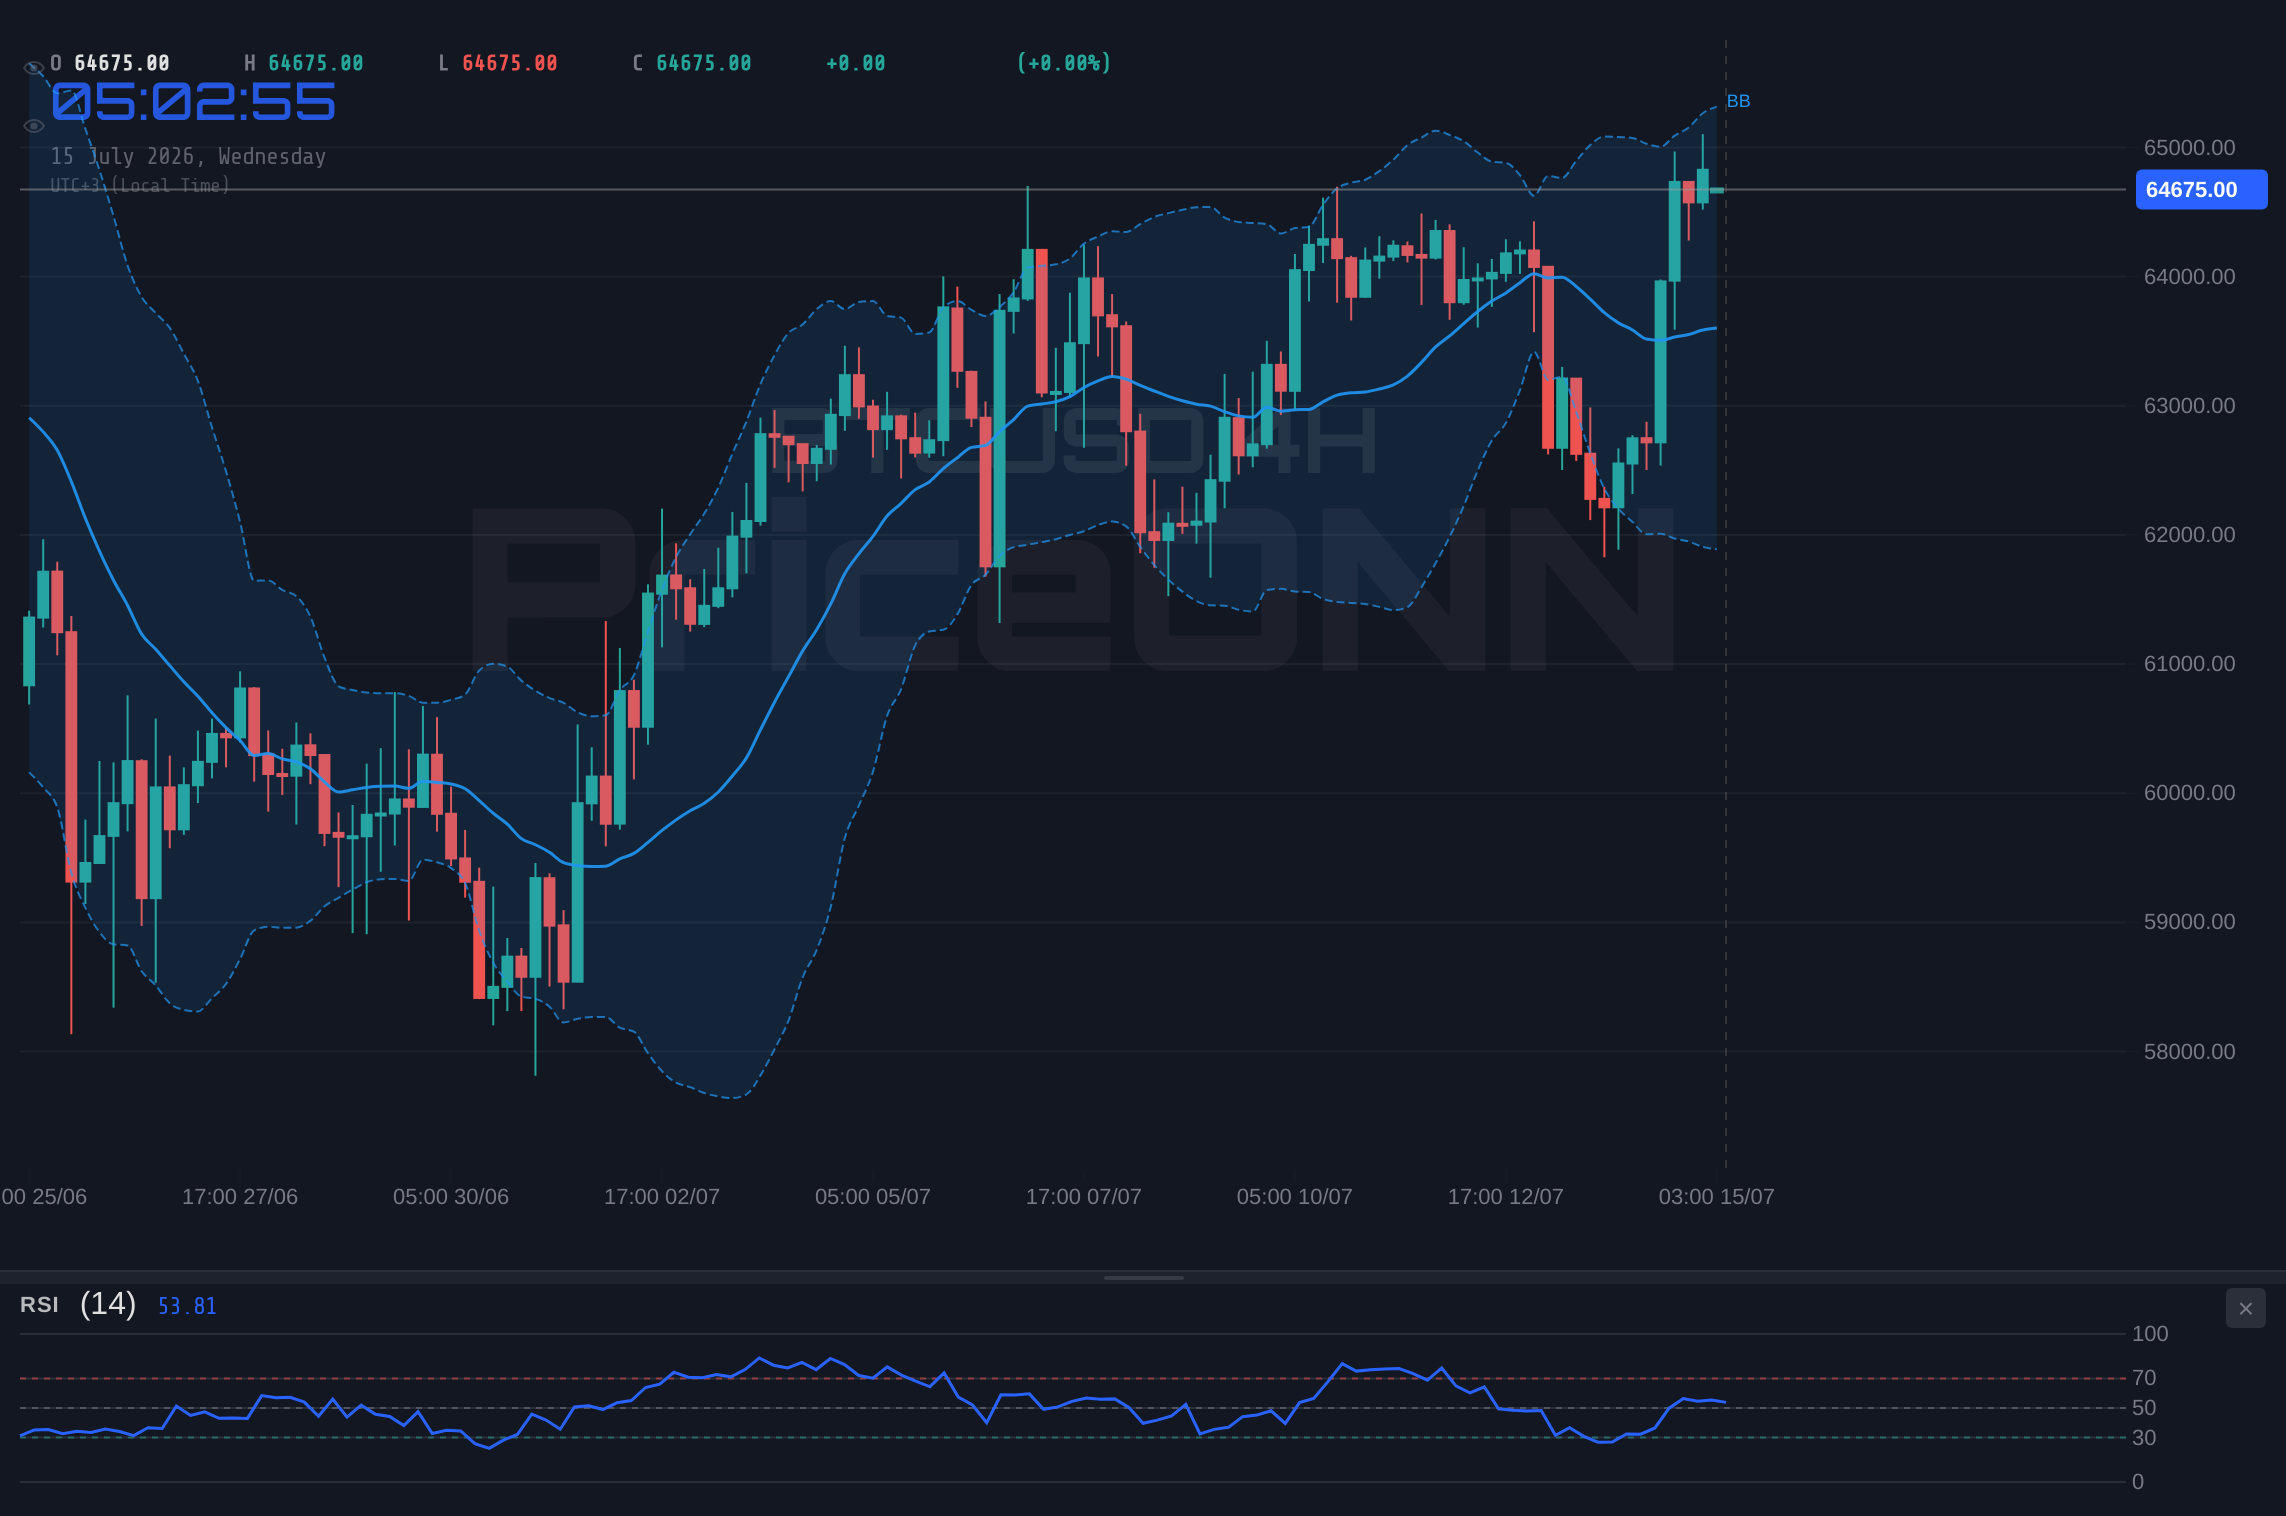
Where Bears Take Control: The $63,800 Line in the Sand
If Bitcoin fails to break decisively above the $64,668 resistance, the bears have a clear path to reassert control. The immediate support level to watch on the 1-hour chart is $64,410. A break below this could signal weakness, leading to a retest of the $64,074.67 support on the 4-hour chart. Further downside could then target the $63,869.67 support, a level that has historically acted as a significant psychological and technical floor. If this level fails, the narrative quickly shifts to a more bearish outlook, potentially dragging BTCUSD down towards the $61,869-$61,218 range observed on the daily chart. The ADX on the 1-hour chart, while strong, could also indicate a potential reversal if price fails to break out and starts to trend downwards.
The daily technicals provide a cautionary tone. The MACD on the daily chart is showing negative momentum, with the MACD line below the signal line, suggesting that selling pressure might be building. Combined with the bearish Stochastic crossover observed earlier, a failure to break resistance could lead to a swift decline. On-chain data would also become critical in a bearish scenario. An increase in exchange inflows, particularly from large wallets, could indicate selling pressure building up. A significant drop in active addresses or a decline in mining difficulty adjustments could also signal a weakening network, further supporting a bearish thesis. The correlation with the DXY, which is showing some signs of stabilization on the 4-hour chart despite its daily dip, could also play a role. If the dollar index finds footing and begins to rise, it would typically exert downward pressure on risk assets like Bitcoin. The key invalidation level for a bearish scenario would be a strong, sustained close above the $65,304 resistance, which would then pivot the analysis towards a bullish outlook.
The Waiting Game: Consolidation Around $64,668
It's entirely plausible that Bitcoin will enter a period of consolidation, trading within a defined range around the $64,668 level. This scenario often occurs when there is indecision in the market, with neither bulls nor bears having enough conviction to force a significant move. In such a case, price action might oscillate between the immediate support at $64,410 and resistance at $65,006. This range-bound environment can be frustrating for traders seeking clear directional moves but can also present opportunities for range-trading strategies, focusing on buying near support and selling near resistance, provided risk is managed effectively.
The technical indicators often give mixed signals during consolidation. We might see RSI hovering around the 50 level, MACD lines crisscrossing near the zero line, and Stochastic oscillators showing choppy movements without clear overbought or oversold conditions. The ADX, which measures trend strength, would likely decline or remain subdued, indicating a lack of a strong trend. On-chain metrics might also show a decrease in transaction volumes and a plateauing of active addresses. Geopolitical stability or a lack of significant macroeconomic news could also contribute to this consolidation phase, as traders await clearer direction from central banks or major economic data releases. The current setup, with strong uptrend signals on shorter timeframes but daily indicators showing caution and mixed signals, lends itself to a consolidation scenario in the short term. The key here is to watch for increasing volatility or a clear break from the established range, which would signal the end of the waiting game and the beginning of a new directional move. Until then, patience and disciplined risk management are paramount.
Probability Assessment: Where the Smart Money is Leaning
Assessing the probabilities for these scenarios requires a careful look at the confluence of factors. The bullish case is supported by the strong uptrend signals on the 1-hour and 4-hour charts, particularly the robust ADX readings and positive MACD momentum. The recent surge in BTCUSD's price and its correlation with a generally risk-on sentiment in global markets, as evidenced by the Nasdaq's strong performance and the DXY's dip, lend credence to the possibility of a breakout. However, the daily chart's mixed signals, including the bearish Stochastic crossover and the neutral RSI, introduce a significant element of caution. This conflict suggests that while upward momentum exists, it may not yet have the sustained conviction for a clear breakout.
The bearish scenario gains traction if Bitcoin fails to clear the $65,006-$65,304 resistance zone. The daily MACD's negative momentum and the Stochastic crossover are key indicators here. If price begins to fall and breaks below the $64,410 support, the probability of a deeper correction towards the $63,869 area and potentially lower increases significantly. Geopolitical stability or a sudden shift in risk appetite, perhaps driven by unexpected economic data or central bank commentary, could also trigger this downside move. Given the conflicting signals across timeframes and the critical resistance level being tested, a period of consolidation appears to be the most probable short-to-medium term outcome. This suggests a higher probability for range-bound trading before a decisive move, perhaps in the 40-50% range. The bullish breakout scenario might carry a 30-35% probability, contingent on clearing key resistance with conviction, while the bearish breakdown scenario could hold a 20-25% probability, especially if key supports are breached.
Key Triggers to Watch This Week
The coming days will be crucial for BTCUSD. Several key triggers could ignite the next significant price move. Firstly, the close above the $65,304 resistance on the daily chart is paramount for the bullish scenario. This would require sustained buying pressure and likely a positive catalyst. Secondly, a decisive break below the $64,410 support on the 1-hour chart, followed by a daily close below $63,869, would invalidate the bullish outlook and open the door for further downside. The market sentiment will also be heavily influenced by macroeconomic data. The recently released US CPI data showed inflation cooling, which could influence Fed policy expectations. While the immediate market reaction saw the DXY dip and risk assets like EURUSD and GBPUSD rise, the subsequent market moves and commentary from Fed officials will be critical. Any indication of a premature rate cut or a more hawkish stance could significantly impact Bitcoin's direction. On-chain data, particularly exchange flows and whale activity, will provide real-time insights into investor conviction and should be monitored closely. A significant shift in these metrics could preempt technical signals.
Additionally, institutional flows into Bitcoin ETFs remain a significant driver. While specific real-time ETF flow data isn't provided, any news or reports indicating substantial inflows or outflows could sway market sentiment. The correlation between Bitcoin and traditional risk assets like the S&P 500 and Nasdaq remains strong. If these indices experience significant volatility, either positive or negative, BTCUSD is likely to follow suit. Therefore, keeping an eye on the performance of these major indices, alongside the DXY and oil prices, will be essential for understanding the broader risk appetite influencing Bitcoin. The upcoming economic calendar, particularly any statements from Fed officials or further inflation data, will be key in shaping expectations for monetary policy, which in turn directly impacts speculative assets like Bitcoin. Traders should remain vigilant for any shifts in these macro factors that could provide the catalyst for a breakout or breakdown from the current consolidation range.
Scenario Analysis: BTCUSD at the Crossroads
Bearish Scenario: The Pullback Potential
25% ProbabilityNeutral Scenario: Range-Bound Trading
45% ProbabilityBullish Scenario: Breaking Resistance
30% ProbabilityFrequently Asked Questions: BTCUSD Analysis
What happens if BTCUSD breaks decisively above the $65,304 resistance?
A sustained daily close above $65,304 would invalidate the current bearish concerns and open the door for further upside. The bullish scenario suggests targets around $66,420 and potentially higher towards new all-time highs, driven by renewed momentum and positive on-chain activity.
Should I consider buying BTCUSD at current levels around $64,668, given the RSI at 65.81?
Buying at current levels carries risk due to the proximity of resistance at $65,006 and $65,304. While the 1-hour RSI at 65.81 indicates bullish momentum, the daily Stochastic shows a bearish crossover. A more prudent approach might be to wait for a confirmed breakout above resistance or a pullback to support levels around $64,410, with a clear invalidation point below $63,869.
Is the MACD histogram showing negative momentum a sell signal for BTCUSD at $64,668?
The daily MACD histogram showing negative momentum suggests underlying selling pressure is building, which is a cautious signal. However, on shorter timeframes (1-hour and 4-hour), the MACD is positive and above the signal line, indicating ongoing bullish momentum. This conflict suggests that while the daily trend might be losing steam, the immediate pressure is still upwards, making a definitive sell signal uncertain without further confirmation.
How will the cooling US CPI data affect BTCUSD this week?
The cooling CPI data generally supports risk assets like Bitcoin by potentially influencing the Federal Reserve to adopt a less hawkish stance on interest rates. This could lead to increased inflows into speculative assets. However, the market's reaction will depend on subsequent Fed commentary and overall risk appetite. A dip in the DXY, as seen today, is a positive sign for BTCUSD, but sustained dollar strength could counteract this effect.
| Indicator | Value | Signal | Interpretation |
|---|---|---|---|
| RSI (14) | 65.81 | Neutral | Bullish momentum, but room to move higher before overbought conditions on 1H. Daily RSI at 54.63 is also neutral. |
| MACD Histogram | +0.91 | Bullish | Positive momentum on 1H and 4H, but daily MACD shows negative momentum, indicating conflicting signals across timeframes. |
| Stochastic | K=69.18, D=80.29 | Bearish Crossover | On 1H, %K is below %D, a potential early warning. Daily Stochastic shows a clear bearish crossover (%K=67.81, %D=76.03). |
| ADX | 37.68 | Strong Trend | Indicates a strong trend on the 1-hour chart (37.68), suggesting potential for significant moves if a breakout occurs. Daily ADX at 24.66 is weaker. |
| Bollinger | Middle Band | Above Middle Band | Price is trading above the middle band on 1H, 4H, and 1D charts, indicating a bullish bias across timeframes. |
As a market analyst with years of experience navigating crypto cycles, I've learned that patience is often the greatest trading tool. While the $64,668 level presents a clear resistance, the underlying strength suggested by shorter-term indicators, coupled with a generally favorable macro environment, indicates that a bullish breakout is a tangible possibility. However, the conflicting signals on the daily chart serve as a crucial reminder to manage risk diligently. The market is not always straightforward, and understanding the conditions that would invalidate a bullish thesis is just as important as identifying the triggers for a move higher. Stay disciplined, wait for clear confirmation, and let the price action guide your decisions. The crypto market is dynamic, and opportunities will continue to emerge for those who are prepared and patient.
Track markets in real-time
AI-powered analysis, technical indicators and real-time price data.
Join Our Telegram Channel
Breaking market news, AI analysis and trading signals instantly.
Join Channel