

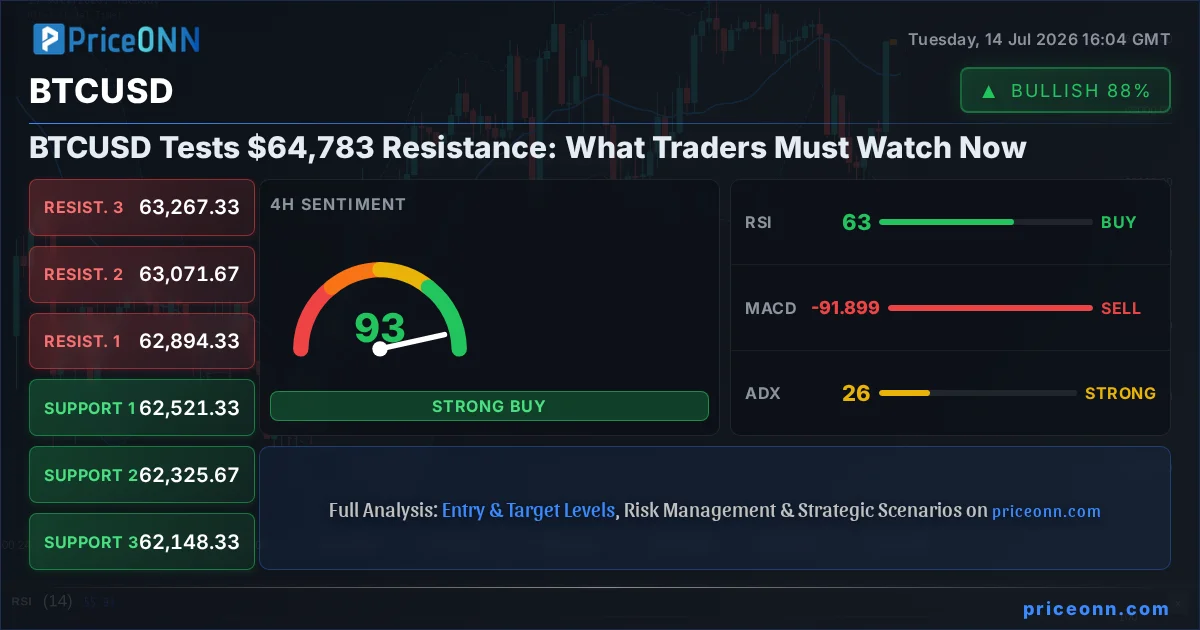
Having watched Bitcoin navigate the volatile landscape of 2024, the current price action around $64,783 presents a critical juncture. The recent surge, pushing BTCUSD towards its upper limits, is undeniably exciting, but as any seasoned trader knows, excitement often masks underlying risks. My primary focus right now isn't just the headline number, but the subtle shifts in momentum and the confluence of technical signals that tell a more nuanced story. We're seeing a divergence in indicators, with some pointing towards continued strength while others flash warnings of a potential pullback. Understanding this tension is key to navigating the choppy waters ahead.
- RSI at 76.96 signals overbought pressure, suggesting potential for a short-term pullback or consolidation.
- Critical resistance sits at $65,323.33, a level BTCUSD has struggled to decisively break on the 1H chart.
- MACD histogram shows negative divergence on the 1H chart: bullish momentum is fading.
- Fed rate expectations and DXY movements are driving BTCUSD correlation, demanding attention to macroeconomic drivers.
The Current Battleground: $64,783 and Key Technicals
Bitcoin is currently trading at $64,783, a price point that signifies a significant psychological and technical hurdle. The daily chart shows a strong upward move, with a daily change of +4.13% ($2,569) and a trading range from $61,885 to $64,969. This upward momentum is impressive, but a closer look at the intraday indicators reveals a more complex picture. On the 1-hour timeframe, the RSI stands at a lofty 76.96, firmly in overbought territory. This typically suggests that the asset has risen too far, too fast, and a correction or at least a period of consolidation is likely. While RSI alone isn't a sell signal, it's a strong warning sign that the buying pressure might be exhausting itself. The MACD histogram, also on the 1-hour chart, is showing negative divergence. This means that while the price has been making higher highs, the underlying momentum driving those highs is weakening. This is a classic sign that the bulls might be losing their grip, and a reversal could be on the horizon.
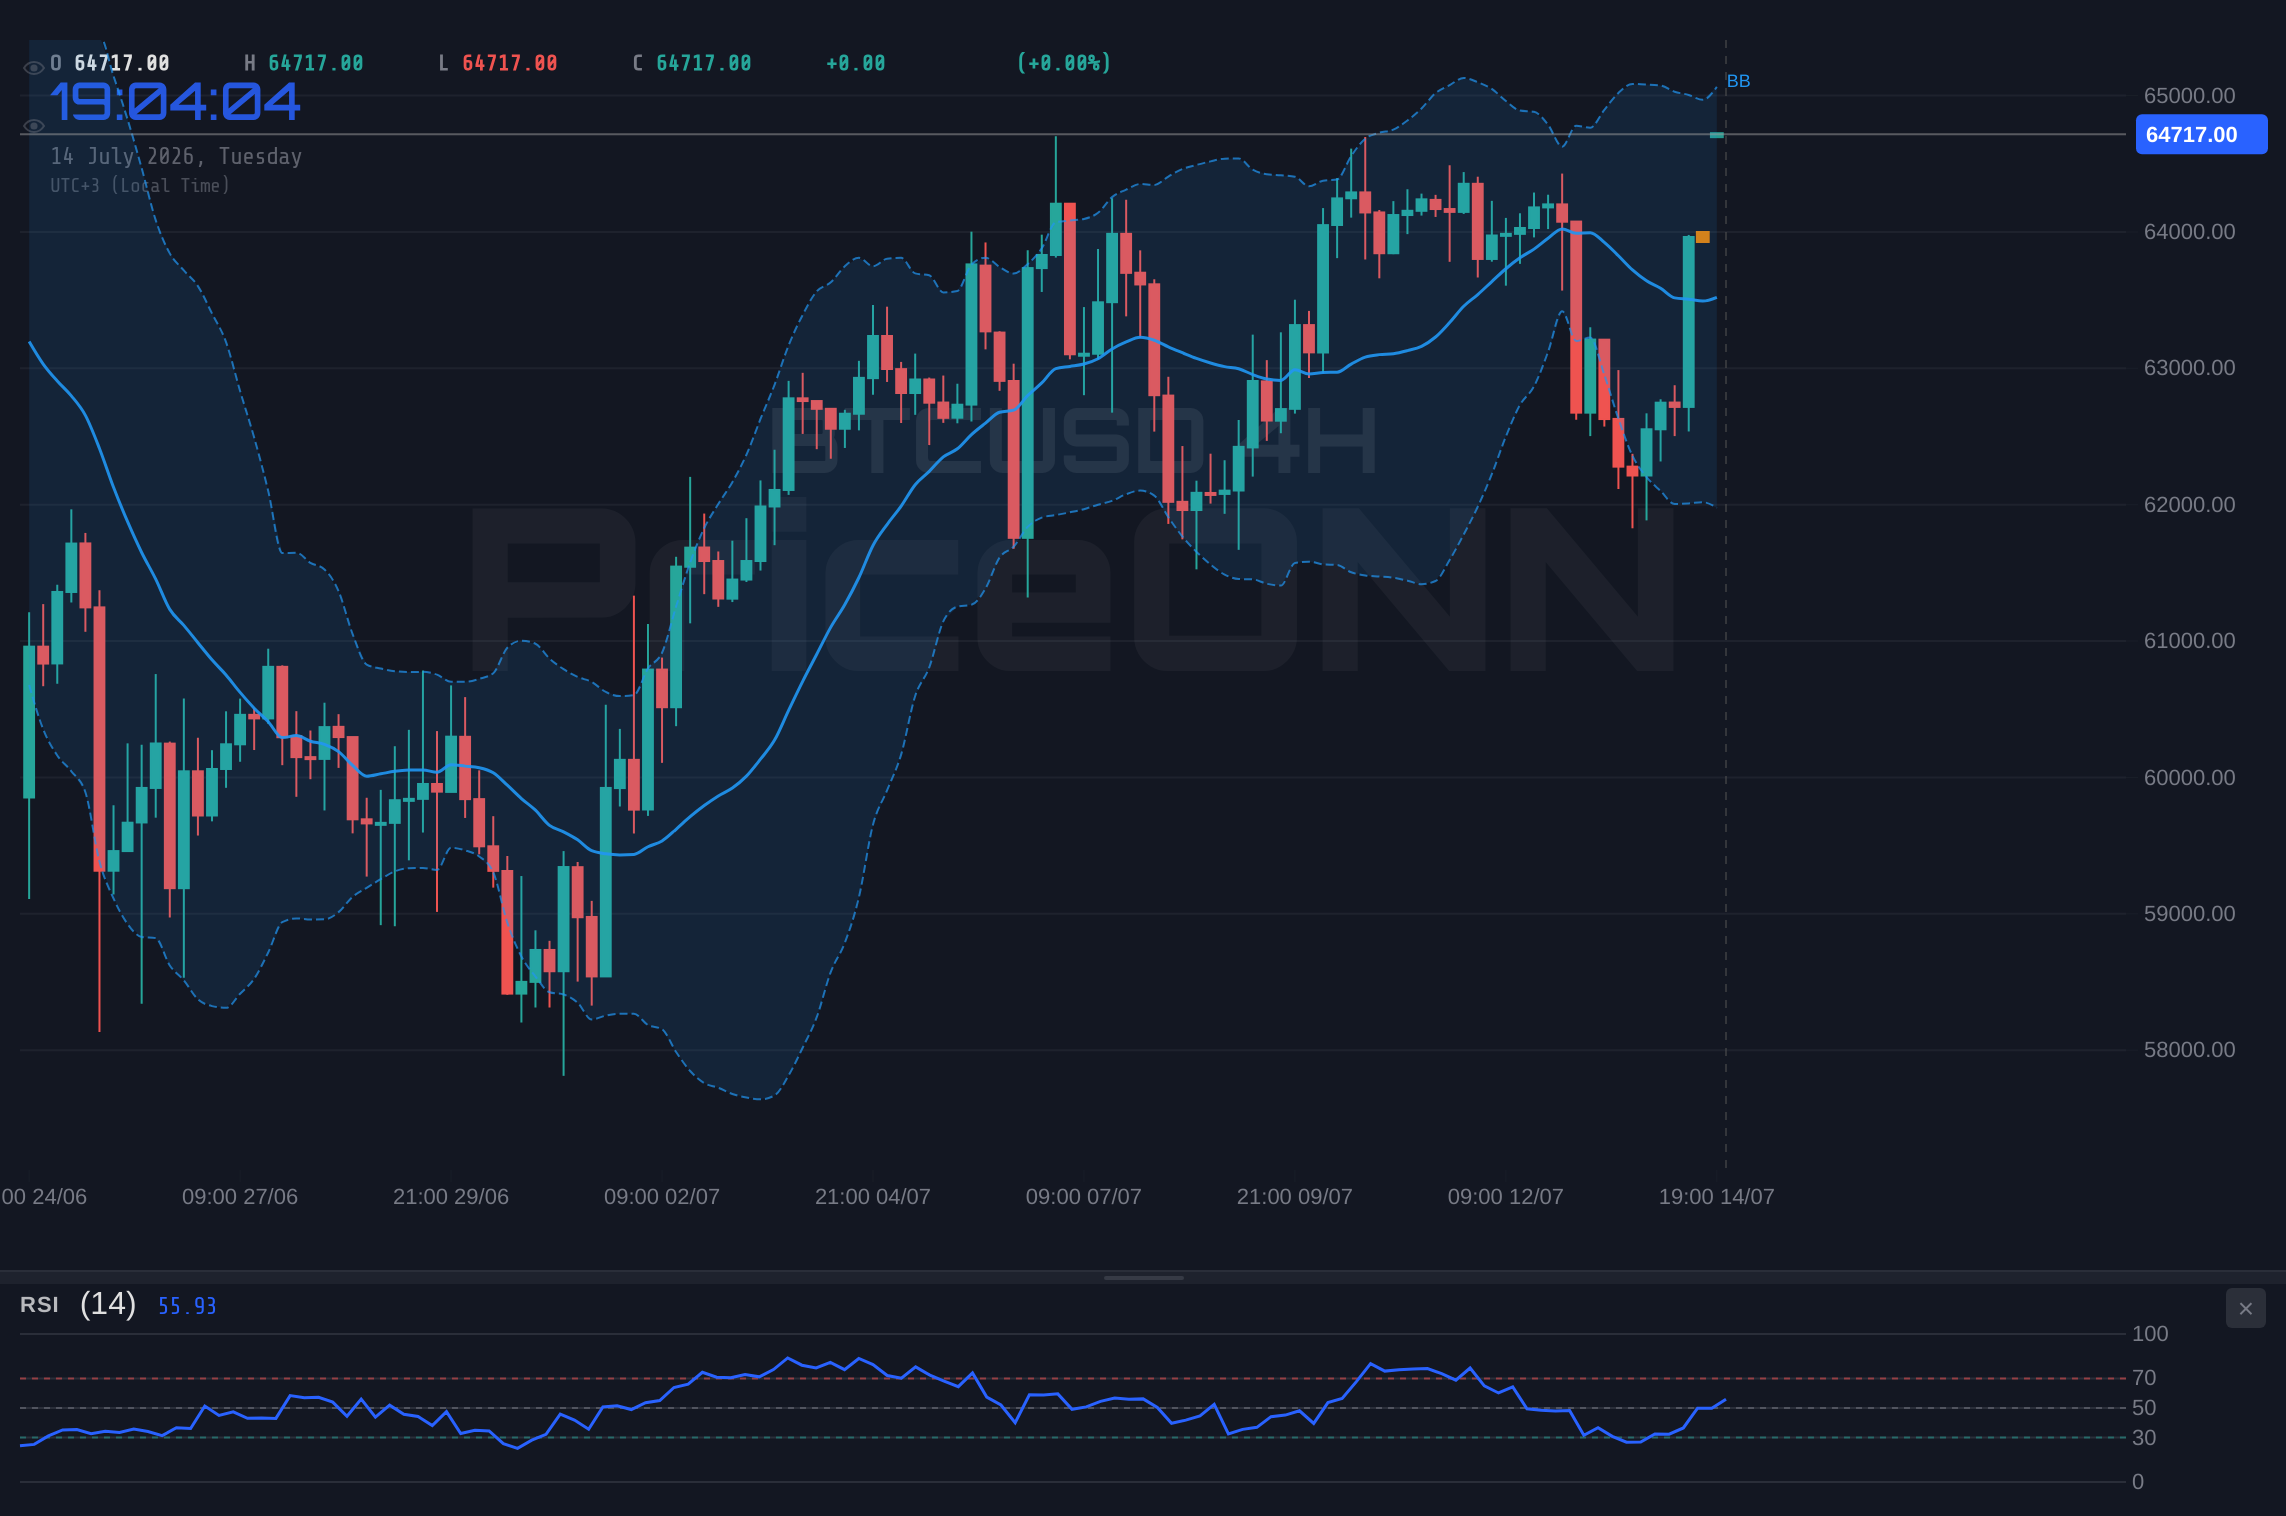
Adding to this caution, the Stochastic Oscillator on the 1-hour chart is also in overbought territory, with %K at 90.25 and %D at 84.41. The fact that %K is above %D confirms the overbought condition, but the proximity of these lines and the potential for a bearish crossover loom large. Meanwhile, the ADX on the 1-hour chart is at 27.18, indicating a strong uptrend is in place. This creates a conflict: strong trend strength versus overbought indicators. This is precisely the kind of market environment where volatility can spike, and price action can become erratic. The Bollinger Bands on the 1-hour chart are also showing the price pushing above the upper band, a sign of strong upward pressure but also a potential prelude to a mean reversion move. It’s a tug-of-war between raw buying power and the exhaustion signals from momentum oscillators.
Multi-Timeframe Divergence: A Warning for Traders
When we zoom out to the 4-hour and daily charts, the picture becomes even more nuanced, highlighting a critical divergence in technical signals that traders must pay attention to. While the 1-hour chart shows overbought conditions and fading momentum, the 4-hour chart paints a slightly different, though still cautious, narrative. Here, the RSI is at 63.31, still in bullish territory but not yet screaming overbought. The MACD on the 4-hour timeframe, however, shows negative momentum, with the MACD line below the signal line. This contradicts the 1-hour MACD's positive momentum, suggesting that the strength seen in the shorter timeframe might not be sustainable. The Stochastic Oscillator on the 4-hour chart is at K=56.54 and D=26.34, indicating a bullish signal with %K well above %D, but it’s not in extreme territory yet.
The ADX on the 4-hour chart is at 26.54, still indicating a strong uptrend, albeit slightly weaker than the 1-hour reading. This reinforces the idea that while the dominant trend may still be upwards, the short-term indicators are flashing amber. Moving to the daily chart, we see further complexity. The RSI is at 54.98, comfortably in neutral territory and showing a slight upward eğilimi. The MACD on the daily chart displays positive momentum, with the MACD line above the signal line, aligning with the upward move. However, the Stochastic Oscillator on the daily chart shows K=68.86 and D=76.21, indicating a bearish signal with %K below %D, and it’s nearing overbought territory. The ADX on the daily chart is at 24.66, suggesting a moderate downtrend, which starkly contrasts with the strong uptrend signals on shorter timeframes. This multi-timeframe divergence is precisely why caution is paramount. The market is sending mixed signals, and a clear directional bias is not firmly established across all key timeframes.
Correlation Analysis: DXY and Equities Matter
It's impossible to analyze BTCUSD in a vacuum; its movements are increasingly intertwined with traditional markets and macroeconomic forces. The Dollar Index (DXY), currently trading around 100.91 and showing a daily decrease of -0.39%, plays a crucial role. A weakening dollar often correlates with a stronger risk appetite, which can translate into inflows into assets like Bitcoin. Conversely, if the dollar were to strengthen, it would likely put pressure on BTCUSD, especially as it battles resistance levels. The recent dip in the DXY might be providing some underlying support for Bitcoin's rally, but this is a delicate balance. Traders are also keeping a close eye on US inflation data, with the upcoming CPI report being a major event. The news suggests that inflation may have cooled due to falling fuel prices, which could influence Federal Reserve policy expectations. If inflation comes in lower than expected, it might reinforce the narrative of a Fed pause or even potential rate cuts later in the year, which would typically be bullish for risk assets like Bitcoin.
Furthermore, the performance of major US equity indices like the S&P 500 and Nasdaq 100 provides vital context. The S&P 500 is currently showing a strong daily gain of 0.74% ($48.57), trading around 6572.87, while the Nasdaq 100 is up 1.22% ($355.17) at 29575.83. This positive sentiment in equities generally supports a risk-on environment, benefiting Bitcoin. However, the daily charts for both indices show a different story, with the S&P 500 in a downtrend (ADX 47.51) and the Nasdaq 100 showing a weak trend (ADX 15.44). This internal conflict within the equity markets mirrors the divergence seen in BTCUSD's own technicals. The Dow Jones Industrial Average, currently trading around 52408.5 with a slight daily drop of -0.1%, also adds to the mixed signals. The interplay between a potentially cooling inflation outlook, a weakening dollar, and mixed signals from equities creates an environment of uncertainty. Any surprises in the CPI data or a shift in Fed rate hike expectations could significantly impact Bitcoin's correlation with these markets.
Navigating the $64,783 Resistance: Scenarios and Probabilities
Given the conflicting technical signals and the macroeconomic backdrop, the $64,783 level for BTCUSD is more than just a price point; it’s a critical battleground. The immediate resistance lies around $64,570.33 on the 1H chart, with a more significant cluster at $64,832.67 and $65,323.33. Breaking decisively above these levels, and holding them, would be a strong bullish signal. Conversely, failure to do so could lead to a sharp reversal, especially with the overbought conditions on shorter timeframes. The support levels on the 1H chart are $63,817.33, $63,326.67, and $63,064.33. A break below the immediate support at $63,817.33 could signal the start of a deeper correction.
Considering the current data, I've outlined three potential scenarios. The first is a bearish scenario, where the overbought indicators and fading momentum on shorter timeframes lead to a rejection at current resistance. This is currently the most probable outcome, given the RSI at 76.96 and the MACD divergence on the 1H chart. The second is a neutral consolidation phase, where Bitcoin trades within a tight range around $64,783 as traders await clearer signals from upcoming economic data, particularly the CPI report. The third is a bullish breakout, where underlying buying pressure, perhaps fueled by positive inflation news or strong equity performance, pushes BTCUSD decisively above the resistance levels. However, the current technical picture does not strongly support this scenario without further confirmation.
Bearish Scenario: Resistance Holds Firm
65% ProbabilityNeutral Scenario: Consolidation Amidst Uncertainty
25% ProbabilityBullish Scenario: Breakout Confirmation
10% ProbabilityThe Path Forward: Risk Management is Paramount
The current technical setup for BTCUSD is a classic case of conflicting signals. Strong uptrend indicators on shorter timeframes clash with overbought oscillators and fading momentum. The daily chart, while showing a positive MACD, has a bearish Stochastic signal and a moderate downtrend ADX, adding another layer of complexity. This is not a market for aggressive bets. Instead, it demands disciplined risk management. For short-term traders, watching the immediate 1-hour resistance at $64,832.67 is crucial. A failure to break this level, especially with the RSI at 76.96, could present a shorting opportunity, targeting the 1H support levels. However, this requires tight stop-losses, likely just above the resistance.
For those with a longer-term horizon, the daily chart's signals are more pertinent. The bearish Stochastic on the daily chart and the moderate downtrend ADX suggest that the current rally might be a retracement within a larger, potentially bearish, structure. Waiting for a clear break and hold above the 1D resistance at $65,323.33, or a decisive break below the 1D support at $61,218, would offer much clearer trading setups. The upcoming CPI data is a significant wildcard. A surprisingly high inflation number could spook markets and lead to a sharp sell-off in risk assets like Bitcoin, while a lower-than-expected print could fuel another leg up. Until then, expect range-bound trading or increased volatility around key levels. Patience and a robust risk management strategy are your best allies in this uncertain environment.
Frequently Asked Questions: BTCUSD Analysis
What happens if BTCUSD fails to break above the $64,832.67 resistance level?
If BTCUSD fails to break above the $64,832.67 resistance on the 1H chart, particularly with the RSI at 76.96 signaling overbought conditions, a pullback is likely. The bearish scenario suggests targeting the 1H support levels at $63,817.33 and potentially $63,326.67. This outcome is currently assigned a 65% probability.
Should I buy BTCUSD at current levels of $64,783 given the RSI at 76.96?
Buying at current levels of $64,783 with the RSI at 76.96 is not recommended due to the overbought conditions, especially on the 1H chart. The risk/reward ratio is unfavorable for a long entry without clearer confirmation or a pullback to more reasonable levels. A bullish scenario requires a confirmed break above $64,832.67, which currently has a lower probability.
Is the MACD histogram divergence at -0.03 a sell signal for BTCUSD right now?
The negative MACD histogram divergence on the 1H chart, moving from positive momentum towards zero or negative, is a warning sign of weakening bullish momentum. While not a direct sell signal on its own, it supports the bearish scenario by suggesting that the recent price surge may lack strong underlying conviction, increasing the chance of a pullback.
How will the upcoming US CPI data affect BTCUSD this week?
The upcoming US CPI data is a significant catalyst. If inflation figures come in lower than expected, it could boost risk appetite, potentially supporting BTCUSD and pushing it towards resistance levels. Conversely, higher-than-expected inflation could trigger a risk-off move, leading to a decline in Bitcoin as investors seek safer assets. This uncertainty contributes to the current neutral scenario probability of 25%.
Bearish Scenario: Resistance Holds Firm
65% ProbabilityNeutral Scenario: Consolidation Amidst Uncertainty
25% ProbabilityBullish Scenario: Breakout Confirmation
10% ProbabilityTrack markets in real-time
AI-powered analysis, technical indicators and real-time price data.
Join Our Telegram Channel
Breaking market news, AI analysis and trading signals instantly.
Join Channel