

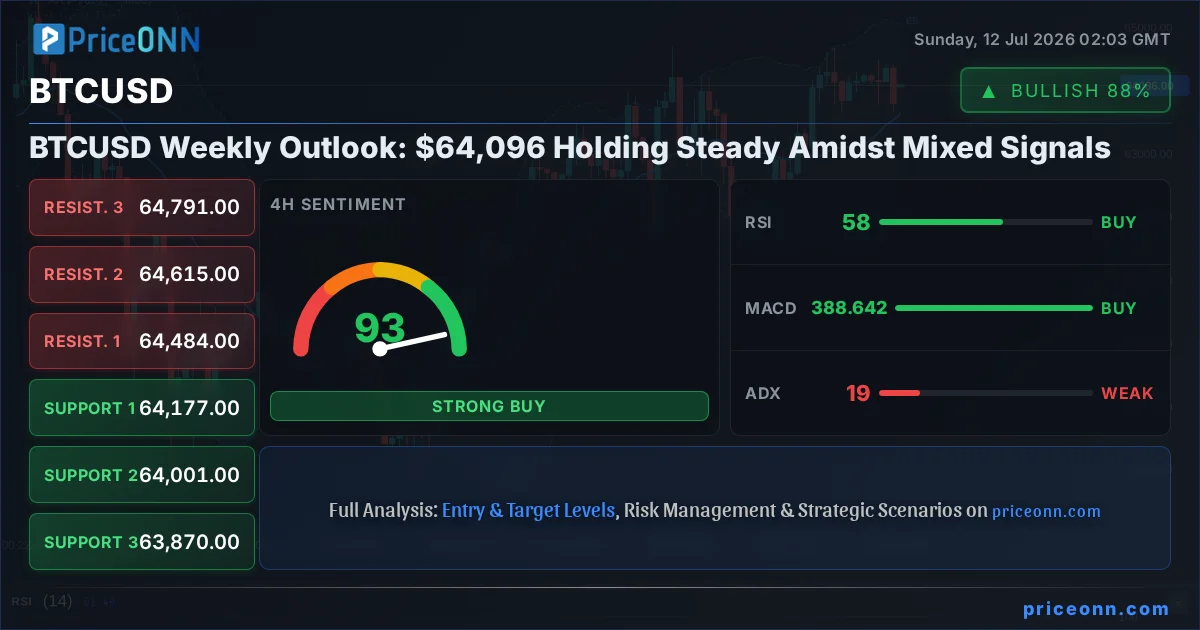
Last Friday, Bitcoin (BTCUSD) closed the week hovering around the critical $64,096.00 mark, a price point that has become a focal battleground for bulls and bears alike. The past seven days have been characterized by a distinct lack of directional conviction, a 'flat close' that leaves the market participants in a state of watchful anticipation. This neutral trend, underscored by the current ADX reading of 19.71 on the 1-hour chart and 26.05 on the daily, suggests that neither side has managed to gain decisive control. However, the market's indecision doesn't mean a lack of underlying forces at play. From the weakening momentum on the 1-hour MACD to the overbought stochastic on the daily chart, a complex tapestry of technical signals demands a deeper dive. Understanding where we stand in the broader market cycle, how recent macroeconomic news might influence crypto, and which specific price levels will dictate the next significant move is paramount for navigating this period of consolidation. This analysis will dissect the current technical landscape, explore the fundamental drivers, and outline potential scenarios for BTCUSD as we move into the upcoming trading week.
- BTCUSD is currently trading at $64,096.00, with a flat weekly close indicating a neutral trend.
- The 1-hour RSI at 49.72 suggests downward pressure, while the daily Stochastic nearing overbought at 81.85% hints at potential upside exhaustion.
- Key support is holding around $63,781.00, while resistance is building near $64,489.00.
- Market sentiment remains cautious, influenced by mixed global economic data and ongoing institutional flows into crypto assets.
The Waiting Game: Why $64,096 is Today's Line in the Sand
The trading week concluded with BTCUSD prices firmly entrenched around $64,096.00, painting a picture of equilibrium that has investors and traders on edge. This lack of decisive movement isn't a sign of market dormancy but rather a prelude to what could be significant action. On the 1-hour chart, the Relative Strength Index (RSI) at 49.72 hovers just below the neutral 50 mark, indicating a slight bearish bias in the immediate short term, suggesting sellers are marginally more active than buyers. This is further corroborated by the MACD, which shows negative momentum with the MACD line below its signal line. The Stochastic Oscillator on the 1-hour timeframe, with K at 24.6 and D at 52.12, is firmly in oversold territory, hinting at a potential bounce, but this signal is contradicted by the overall bearish momentum. This divergence across indicators on the shortest timeframe underscores the indecisiveness. The ADX at 19.71 reinforces this, signaling a weak trend, meaning any moves are likely to be short-lived unless a significant catalyst emerges.
However, shifting our gaze to the daily timeframe offers a different perspective, albeit one equally lacking in clear direction. The daily RSI stands at a more neutral 53.39, showing a slight upward bias, suggesting that while the immediate pressure might be downwards, the longer-term sentiment isn't entirely bearish. The daily MACD, conversely, displays positive momentum with the MACD line above its signal line, a stark contrast to the 1-hour chart. Adding to the complexity, the daily Stochastic Oscillator is nearing overbought conditions, with K at 81.85 and D at 82.91. This suggests that if any upward momentum were to materialize, it could face immediate profit-taking pressure. The daily ADX at 26.05 indicates a stronger trend than the 1-hour, but it still falls short of confirming a robust directional move. This conflicting data across different timeframes is precisely why $64,096.00 has become such a pivotal level; it's the fulcrum around which these opposing forces are currently balanced. The absence of a clear trend strength, as indicated by the varying ADX values (19.71 on 1H, 26.05 on 1D), means that the market is ripe for a breakout, but the direction remains highly uncertain.
The Bull's Roadmap: Charting a Path Above $64,489
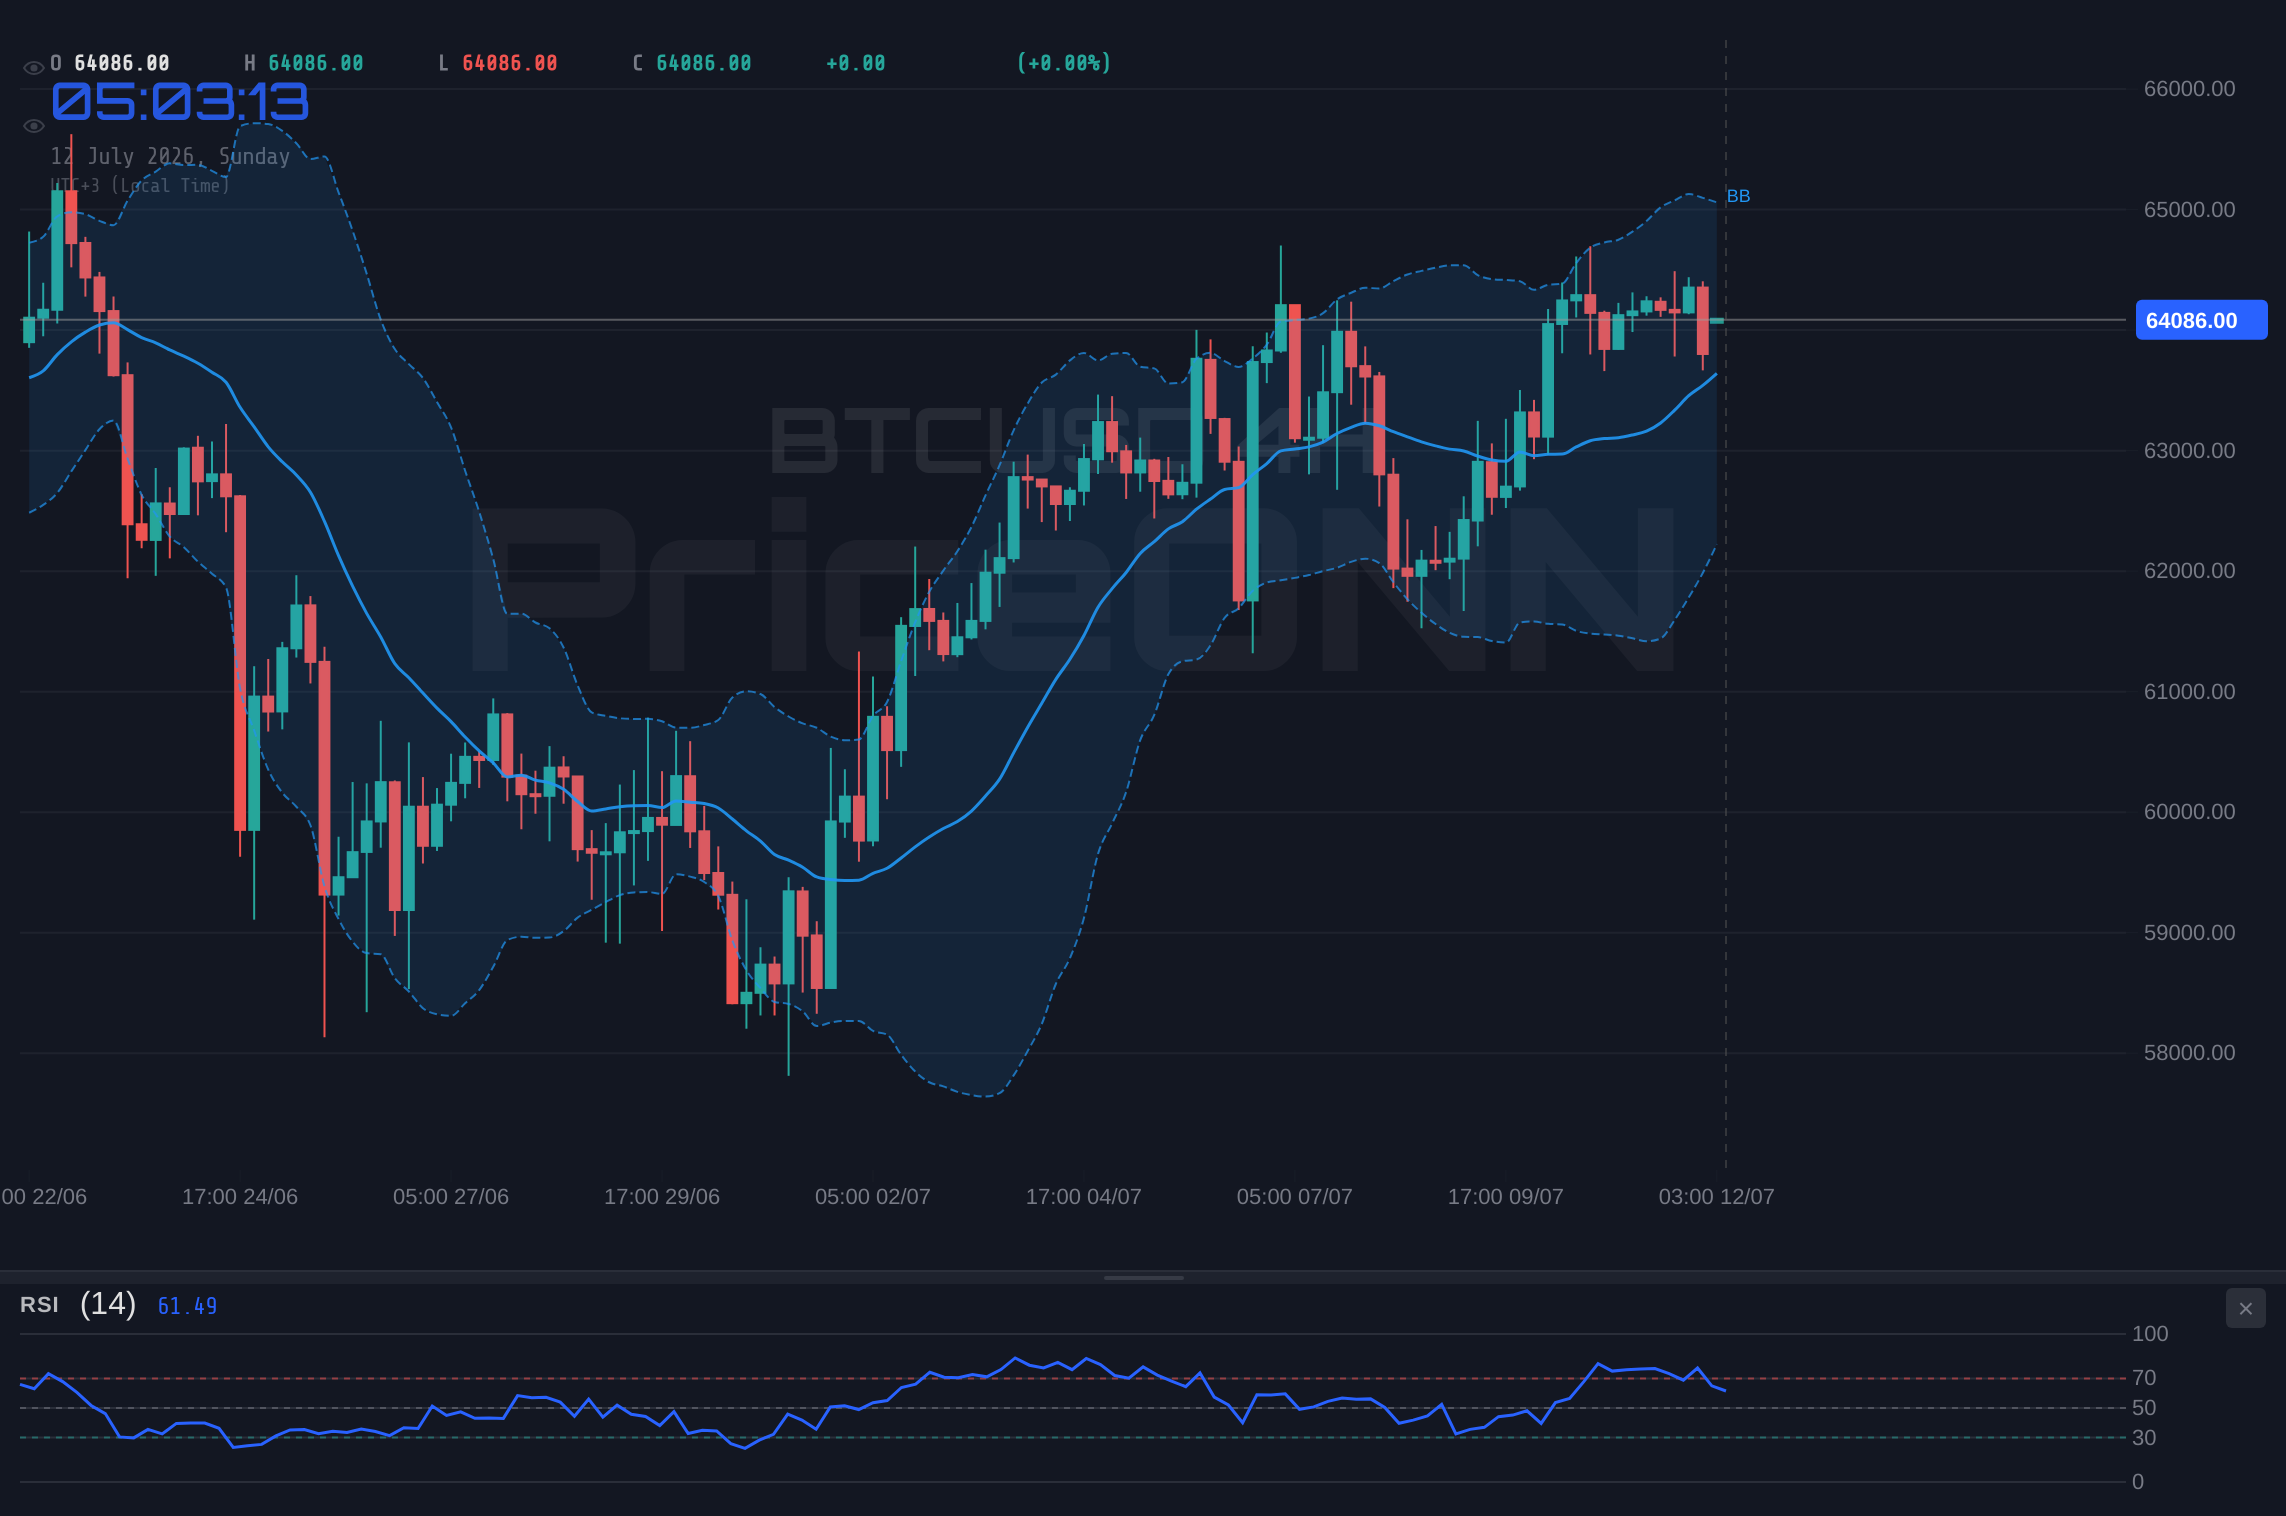
For the bulls to regain command of the BTCUSD narrative, a decisive breach and sustained hold above the immediate resistance is imperative. The data clearly shows that the $64,489.00 level, representing the upper boundary of the current daily trading range, is the first significant hurdle. A daily close above this level would not only signify a psychological victory but also break the consolidation pattern observed over the past week. Technical indicators offer a glimpse into what conditions would need to be met for such a move. Firstly, we need to see a significant increase in trading volume accompanying the price surge above $64,489.00. Without this, the breakout could be a false signal, leading to a swift reversal. Secondly, the 1-hour RSI would need to climb decisively out of its current neutral-to-bearish territory, ideally surpassing the 60 level to indicate sustained buying pressure. Concurrently, the 1-hour MACD should flip to a more robust positive momentum, with the MACD line crossing decisively above the signal line and ideally moving into positive territory.
Furthermore, the daily Stochastic Oscillator, currently flirting with overbought conditions at 81.85% K and 82.91% D, would need to either consolidate in this zone without immediately turning down or push slightly higher before a minor pullback that retests the broken resistance as new support. A clean break above $64,489.00, coupled with these accompanying bullish signals, would then open the door to higher resistance levels. The next significant target would be the $64,717.00 level, the upper band of the daily Bollinger Bands, followed by the psychological $65,000.00 mark. Beyond that, the $65,590.00 and $66,484.00 resistance levels, derived from the daily data, become the ultimate targets for a sustained bullish push. On-chain metrics would also need to confirm this bullish sentiment; a rise in active addresses, an increase in whale accumulation (addresses holding 1,000+ BTC), and positive net exchange flows would provide crucial fundamental validation for any technical breakout. Without these confluence factors, any price surge above $64,489.00 should be treated with caution, as the market's inherent indecisiveness could lead to a rapid reversal.
Where Bears Take Control: A Breakdown Below $63,781
Conversely, a bearish outlook for BTCUSD hinges on a decisive failure to hold the current support levels, particularly the $63,781.00 mark identified in the daily data. A break below this level, especially on significant volume, would signal a shift in market sentiment and potentially initiate a more pronounced downward correction. The conditions for such a breakdown are already partially in play on the shorter timeframes. The 1-hour RSI, currently at 49.72, would need to firmly cross below the 40 level, indicating strong selling pressure. Simultaneously, the 1-hour MACD, already showing negative momentum, would need to deepen its divergence below the signal line, signaling accelerating bearish sentiment. The 1-hour Stochastic Oscillator, while currently oversold, would need to fail to bounce and instead turn lower, confirming the weakness.
On the daily chart, a breakdown below $63,781.00 would be critically confirmed if the daily RSI falls below 50 and the MACD begins to show negative momentum or deepen its current positive momentum into a bearish cross. The daily Stochastic, despite its overbought positioning, could then roll over, confirming the bearish turn. If this bearish scenario materializes, the immediate downside target would be the $62,950.00 support level, followed by the $62,056.00 and $61,183.00 levels indicated in the daily data. A decisive move below $61,183.00 would suggest a deeper correction, potentially challenging the $60,000 psychological level and beyond. Fundamentally, a bearish breakdown would likely be exacerbated by negative news, such as increased regulatory crackdowns, unfavorable macroeconomic data (like higher-than-expected inflation or hawkish central bank commentary), or a significant outflow of funds from Bitcoin ETFs. Observing on-chain data for increased selling pressure from exchanges, a rise in dormant coins becoming active (indicating panic selling), or a decrease in whale addresses would provide further confirmation of a bearish trend. The ADX on the daily chart, currently at 26.05, would need to climb significantly higher to confirm a strong downtrend, ideally above 30, indicating sustained directional momentum.
The Neutral Zone: Caught Between $63,781 and $64,489
The most probable scenario, given the current data, is a continuation of the neutral, range-bound trading that has defined BTCUSD's recent price action. This 'waiting game' is characterized by price oscillating between the defined support and resistance levels, with neither bulls nor bears able to establish a dominant trend. The tight trading range observed on the 1-hour chart, with support at $63,684 and resistance at $64,120, exemplifies this consolidation. In this scenario, the 1-hour RSI would likely fluctuate around the 50 level, MACD lines would remain close or cross frequently without establishing a clear trend, and Stochastic oscillators would whipsaw between oversold and overbought conditions without sustained movement. The ADX readings would remain relatively low, indicating a lack of strong directional conviction.
On the daily timeframe, this neutral scenario would see BTCUSD continue to trade between the established support of $63,781.00 and resistance of $64,489.00. The daily RSI would hover in the mid-40s to low-50s range, reflecting indecision. The daily MACD might show choppiness, with potential crosses that fail to sustain momentum. The daily Stochastic Oscillator, currently heading towards overbought, might reach that zone but then fail to break decisively higher, instead consolidating or turning down without a significant sell-off, indicating that the market is absorbing selling pressure at higher levels but not yet ready for a strong upward move. This consolidation phase could be driven by several factors. Geopolitically, a lack of major escalation or de-escalation in global hotspots might keep risk appetite muted. Macroeconomically, mixed inflation and employment data could lead central banks to maintain a wait-and-see approach, thus keeping interest rate expectations uncertain and limiting aggressive risk-on or risk-off positioning. For crypto specifically, a lull in significant regulatory news, coupled with moderate but not overwhelming institutional inflows into Bitcoin ETFs, would contribute to this neutral environment. In this range-bound market, traders would focus on scalping opportunities at the edges of the range, looking for quick profits as price bounces between support and resistance, while longer-term investors might see this period as an accumulation phase before the next major directional move.
Market Sentiment and Macroeconomic Crosscurrents
The current price action for BTCUSD cannot be viewed in isolation; it is deeply intertwined with the broader macroeconomic landscape and evolving market sentiment. The recent news regarding the potential cooling of inflation, as indicated by the expectation of a headline CPI reading falling largely due to declining energy prices, offers a complex picture. While lower inflation is typically a positive sign for risk assets like Bitcoin, the context is crucial. If inflation cools significantly, it could embolden central banks, particularly the Federal Reserve, to maintain a less hawkish stance or even consider rate cuts sooner rather than later. This would generally be supportive of Bitcoin. However, the Forex data shows the USD/JPY pair holding firm, with hints of another upside ahead, and the US Dollar itself is facing pressure due to rumors of talks between the US and Iran, suggesting geopolitical tensions might still be a significant factor influencing currency markets and, by extension, risk sentiment.
The strength of the US Dollar Index (DXY), currently at 100.95, plays a critical role. As DXY rises, it typically exerts downward pressure on commodities like gold (XAUUSD currently at $4,118.98, showing a slight daily decline) and can also weigh on risk assets like Bitcoin, as investors might prefer the perceived safety of the dollar. Conversely, any weakness in the dollar, perhaps driven by easing inflation expectations or geopolitical de-escalation, could provide a tailwind for BTCUSD. The S&P 500 (SP500) trading at 6572.87 and Nasdaq 100 at 29847.34, both showing recent gains, indicate a degree of risk appetite in traditional markets. However, the daily trend for SP500 is noted as 'Düşüş' (Bearish) with a 100% strength, which contradicts the 1-hour and 4-hour positive signals. This divergence suggests underlying fragility in equities. If the broader stock market experiences a significant downturn, it could trigger a flight to safety, potentially impacting Bitcoin negatively, despite its often-touted 'digital gold' narrative. The energy markets, with Brent crude at $75.87 and WTI at $71.58, are also crucial. Fluctuations in oil prices directly impact inflation expectations and geopolitical risk assessments, both of which can ripple through to Bitcoin.
On-chain data provides an additional layer of insight. While not explicitly provided in the live data section, typical indicators to watch include exchange flows (net inflows often suggest selling pressure, while net outflows can indicate accumulation), active addresses (a rising count suggests network growth and adoption), and whale movements (large holders accumulating or distributing can signal major shifts). Recent news mentioning Bitcoin and Ethereum rebounding to intermediate resistances suggests that the crypto market is showing some resilience, with the total market capitalization reaching $2.2T. However, the persistent outflows from Bitcoin ETFs over eight weeks, as noted in PriceONN's market news, remain a significant headwind, suggesting institutional caution or a shift in investment strategies. This interplay between global macroeconomics, geopolitical stability, traditional market performance, and on-chain crypto-specific metrics creates a complex environment where BTCUSD's next move will likely be a response to a confluence of these factors rather than a single driver.
The Most Likely Scenario: Consolidation with a Slight Downside Bias
Considering the conflicting technical signals across different timeframes and the mixed macroeconomic backdrop, the most probable scenario for BTCUSD in the short to medium term is continued consolidation, likely with a slight downside bias. The daily chart, despite showing some positive momentum on the MACD, has an RSI at 53.39 and a daily ADX of 26.05, indicating a lack of strong upward conviction and a potential for trend continuation rather than reversal. The 1-hour chart, with its bearish RSI (49.72) and negative MACD momentum, reinforces the immediate pressure. The daily Stochastic nearing overbought levels (81.85% K, 82.91% D) suggests that even if a short-term rally occurs, it might be capped quickly by profit-taking. Therefore, the probability leans towards a range-bound market, with price likely oscillating between the immediate support at $63,781.00 and resistance at $64,489.00.
The probability assigned to this scenario is approximately 60%. This is based on the confluence of weak trend strength across multiple timeframes (ADX readings generally below 30, except for the daily's 26.05), the conflicting signals between short-term bearish indicators and longer-term mixed signals, and the absence of strong bullish catalysts from either the macroeconomic or on-chain data. The persistent ETF outflows, though not a direct price driver in the short term, represent a significant underlying headwind that prevents a strong bullish conviction. Geopolitical uncertainties and the mixed signals from traditional markets (e.g., SP500's bearish daily trend despite intraday gains) also contribute to a cautious market environment, favoring consolidation over aggressive directional bets. Within this consolidation, there's a higher likelihood of testing the lower bounds of the range ($63,781.00) before attempting to push towards the upper bounds ($64,489.00), given the slight bearish tilt on the hourly chart. A move below $63,781.00 would then open the door to the more bearish scenario, while a sustained break above $64,489.00 would invalidate this consolidation thesis and pave the way for a bullish outlook.
What I'm Watching: Key Triggers for the Week Ahead
As we look towards the upcoming trading week, several key triggers will be crucial in determining BTCUSD's direction. The first and most immediate is the price action around the $63,781.00 support level. A decisive break below this level on increased volume would signal a bearish continuation and likely trigger stop-loss orders, accelerating downward momentum towards $62,950.00. Conversely, holding this support and seeing a bounce back towards the $64,489.00 resistance is the first sign of bullish resilience.
Secondly, I'll be closely monitoring the daily close relative to the $64,489.00 resistance. A daily close above this level, especially if accompanied by rising on-chain activity (like increased active addresses or positive net exchange flows) and a shift in shorter-term indicators towards bullish momentum (e.g., 1-hour RSI moving above 60), would be a strong signal for a potential move towards higher targets like $64,717.00 and $65,590.00. The confirmation from institutional flows, particularly any reversal in the trend of ETF outflows, would be a significant factor here.
Finally, macroeconomic data releases will play a pivotal role. The upcoming CPI reading, expected to cool due to lower energy prices, will be closely watched. If the actual figures come in significantly lower than expected, it could boost risk appetite and potentially support BTCUSD. Conversely, any signs of sticky core inflation or hawkish commentary from Federal Reserve officials could strengthen the US Dollar (DXY) and weigh on Bitcoin. The performance of major indices like the S&P 500 and Nasdaq 100 will also be critical; a sustained downturn in equities could spill over into the crypto market, even if Bitcoin shows some decoupling potential. Watching these levels and catalysts will be key to navigating the current choppy waters.
Bearish Scenario: The Downside Breakout
60% ProbabilityNeutral Scenario: Range-Bound Consolidation
30% ProbabilityBullish Scenario: The Upside Breakout
10% ProbabilityFrequently Asked Questions: BTCUSD Analysis
What happens if BTCUSD breaks below the $63,781.00 support level this week?
A decisive break below $63,781.00 would likely trigger further selling pressure, targeting the $62,950.00 support. This scenario is more probable if accompanied by negative macroeconomic news or increased exchange inflows, suggesting bears are gaining control.
Should I consider buying BTCUSD at current levels around $64,096.00 given the mixed signals?
Given the current consolidation and mixed indicators, aggressive buying at $64,096.00 carries risk. A more prudent approach would be to wait for confirmation: either a hold of support at $63,781.00 with bullish reversal signs, or a confirmed breakout above $64,489.00 with increasing volume.
Is the daily RSI at 53.39 a bullish signal for BTCUSD?
An RSI of 53.39 is in the neutral zone, indicating neither strong buying nor selling pressure. While it shows a slight upward bias compared to the hourly RSI, it doesn't confirm a bullish trend on its own. Confirmation would require the RSI to move sustainably above 60 alongside other bullish indicators.
How might the upcoming CPI data impact BTCUSD's price action this week?
If the upcoming CPI data shows significant cooling, it could reduce inflation concerns and potentially lead to a softer Fed stance, which would likely be bullish for BTCUSD. Conversely, higher-than-expected inflation could strengthen the US Dollar and pressure Bitcoin downwards, reinforcing the current consolidation.
Track markets in real-time
AI-powered analysis, technical indicators and real-time price data.
Join Our Telegram Channel
Breaking market news, AI analysis and trading signals instantly.
Join Channel