

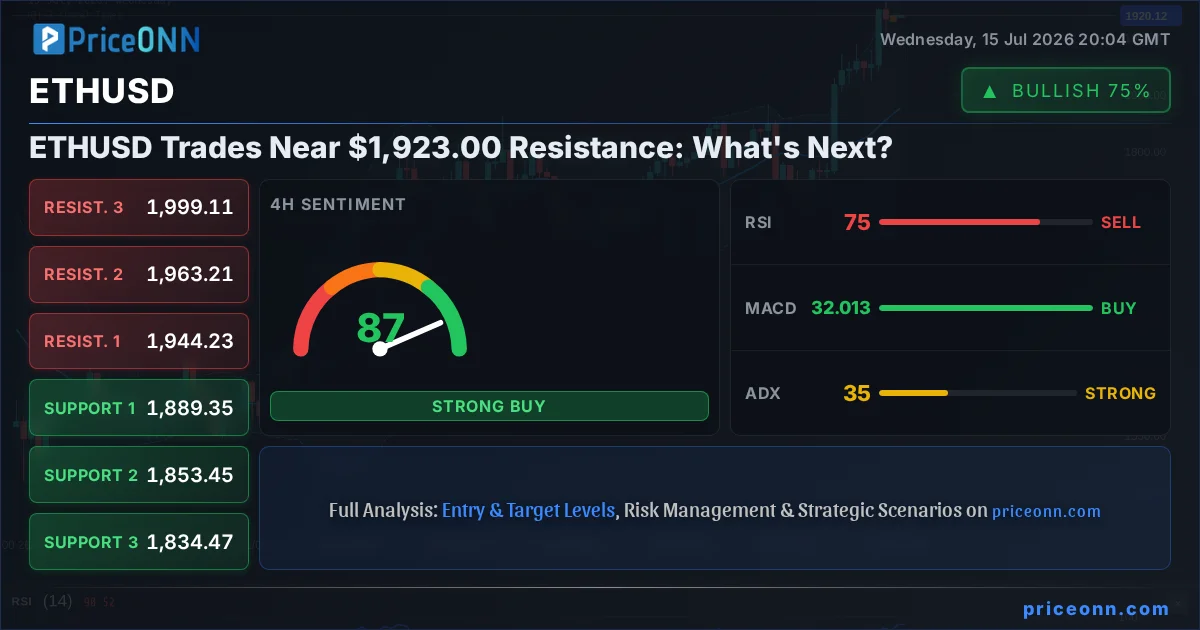
Amidst a complex macroeconomic backdrop featuring fluctuating DXY levels and shifting risk appetite in global equities, the cryptocurrency market is closely watching Ethereum (ETHUSD). The digital asset is currently trading near a critical resistance point at $1,923.00, a level that has historically dictated short-term price direction. Understanding the interplay between macro sentiment, on-chain activity, and technical indicators is paramount for navigating this pivotal juncture. This analysis delves into the current state of ETHUSD, exploring the data-driven insights that can guide traders and investors through the prevailing market conditions.
- ETHUSD faces significant resistance around the $1,923.00 mark, with the 1H chart showing a strong uptrend but 4H and 1D indicators suggesting a neutral to cautious outlook.
- RSI at 68.35 on the 1H chart indicates bullish momentum, but Stochastic's K/D cross suggests potential cooling, highlighting a divergence that warrants attention.
- Key resistance looms at $1,931.23, while crucial support lies at $1,917.03; a decisive break above or below these levels will likely dictate ETHUSD's immediate trajectory.
- The correlation with DXY, currently at 100.52 and trending downwards, could offer some tailwind, but broader market risk sentiment and specific crypto ecosystem developments will be the ultimate drivers.
The cryptocurrency market, and Ethereum specifically, exists within a broader financial ecosystem where macroeconomic forces exert considerable influence. Currently, the US Dollar Index (DXY) is trading at 100.52, showing a downward trend on the 1H and 4H charts. This weakening dollar environment can often be a tailwind for risk assets like ETHUSD, as it reduces the purchasing power of the dollar and potentially increases demand for alternative stores of value. However, the relationship is not always straightforward. While a lower DXY may theoretically support ETHUSD, the prevailing risk sentiment in global equity markets, represented by the SP500 at 6572.87 (trending up) and Nasdaq at 29523.33 (trending down), paints a more nuanced picture. The divergence between these indices suggests underlying market uncertainty. A risk-off sentiment, often signaled by a downturn in tech-heavy indices like the Nasdaq, could still dampen enthusiasm for cryptocurrencies, even if the dollar weakens.
On-chain metrics provide another layer of insight into ETHUSD's current standing. While specific on-chain data points are not provided in the live API feed, we can infer potential activity based on price action. The significant daily increase in ETHUSD's price, coupled with its upward trajectory on the 1H chart, suggests increasing buyer interest. However, the neutral signals on the 1D timeframe hint that this buying pressure might be met with considerable selling at higher levels. Active addresses, whale movements, and exchange flows are critical metrics to monitor. An increase in active addresses typically signals growing network utility, while large inflows to exchanges can precede sell-offs, and significant outflows might indicate accumulation. Without this granular data, we rely on price action and broader market correlations to infer sentiment.
Navigating the Technical Landscape: ETHUSD at the Crossroads
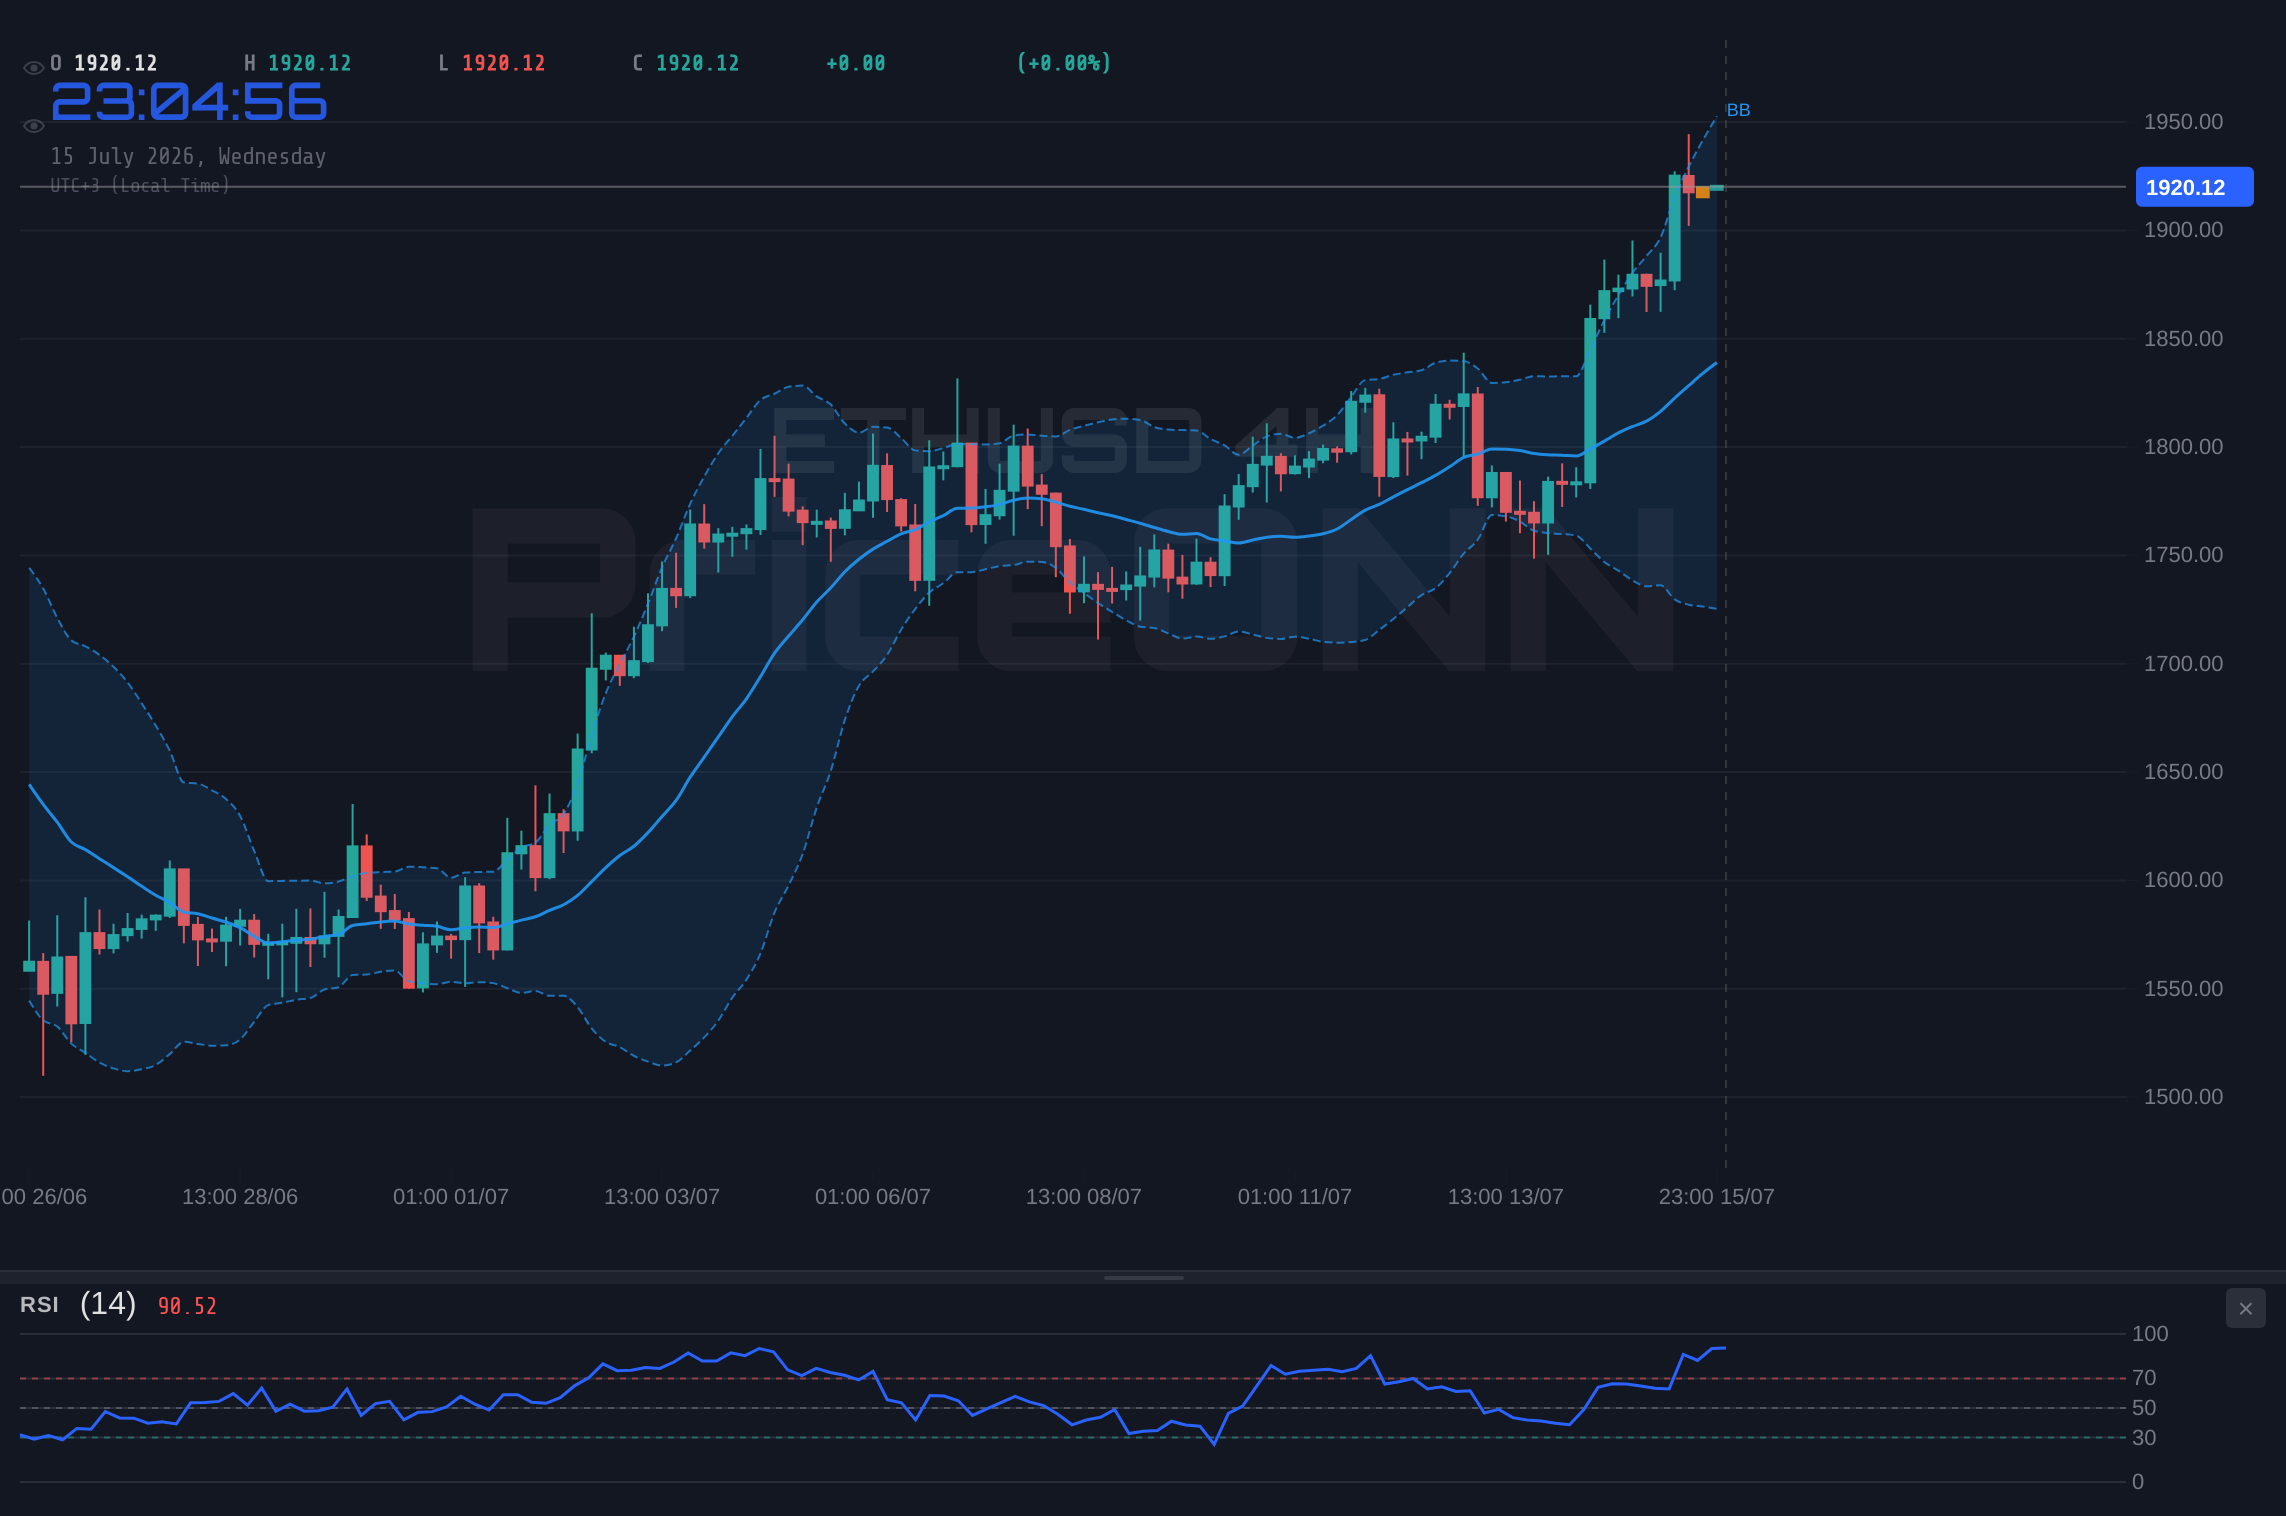
The technical picture for ETHUSD presents a classic battleground scenario, particularly on the shorter timeframes. On the 1-hour chart, the trend is decisively bullish with a strength of 92%, supported by an RSI of 68.35, which, while in the upper neutral zone, indicates positive momentum. The MACD is also showing positive momentum, trading above its signal line, reinforcing the bullish inclination. Stochastic oscillators on this timeframe, however, present a conflicting signal with %K at 84.47 and %D at 83.74, suggesting an overbought condition that could lead to a short-term pullback. This divergence is a key element to watch, as it flags potential exhaustion in the current upward move.
Zooming out to the 4-hour timeframe, the ETHUSD trend remains strong at 98% bullish, with an RSI of 75.92 firmly in overbought territory. This higher RSI value on the 4H chart, compared to the 1H, amplifies the warning signs of potential overheating. The Stochastic %K (91.06) and %D (86.64) are also deeply overbought, further corroborating the idea that significant buying pressure might be facing resistance. The ADX at 35.3 indicates a strong trend, but when combined with overbought oscillators, it suggests that the trend, while strong, might be due for a consolidation or a correction before any further significant moves. The Bollinger Bands are trading above the middle band, confirming the bullish bias, but the upper band itself can act as a dynamic resistance.
The daily (1D) chart offers a more balanced perspective, showing a neutral trend with 50% strength. This suggests that while shorter-term trends might be bullish, the longer-term picture is consolidating or awaiting a clearer directional signal. The RSI at 65.17 remains in the neutral zone, leaning towards bullish but far from extreme overbought conditions. However, the Stochastic K (74.66) and D (77.73) are showing a bearish cross, indicating a potential downturn, and the ADX at 22.09 points to a moderately trending market, not a runaway bull or bear phase. This daily neutrality is crucial; it implies that the current upward momentum might be hitting a ceiling, and a decisive move is needed to break this indecisive state. The key resistance level to watch on the daily chart is $1,972.90, while support is found at $1,923.01, the current price itself, and further down at $1,786.76.
The Crucial $1,923.00 Level: A Line in the Sand
The current price of ETHUSD, $1,923.00, is not just a random number; it represents a confluence of technical significance. On the 1-hour chart, it acts as a psychological level and a point of immediate contention. A failure to hold this level could quickly lead to a test of the 1H support at $1,917.03. Conversely, if buyers can push ETHUSD decisively above the immediate 1H resistance at $1,931.23, the next target would be $1,940.05. This immediate range - $1,917.03 to $1,931.23 - is where the short-term battle is being waged. Traders are likely watching these levels intently, placing stop-losses and setting buy/sell orders around them. The high ADX on the 1H chart (43.06) suggests that a breakout from this range, once it occurs, could be sharp and swift, driven by the strong trend momentum identified on this timeframe.
The 4-hour chart reinforces the importance of $1,923.00 as it aligns closely with the middle Bollinger Band and acts as a pivot. A sustained move above this level on the 4H chart would be a significant bullish signal, potentially targeting the 4H resistance at $1,944.23. However, the overbought Stochastic and RSI on this timeframe mean that any move higher will likely face immediate selling pressure. The daily chart, showing $1,923.01 as the closest support, underscores its importance as a psychological and technical floor. A break below this level on a daily closing basis would be a strong bearish signal, invalidating the short-term bullish thesis and potentially opening the door for a deeper correction towards $1,786.76. The strength of the trend on the 1D ADX (22.09) suggests that while a break might occur, it might not immediately lead to a sustained trend without further confirmation.
The conflict between the bullish momentum on shorter timeframes and the neutral-to-cautionary signals on longer timeframes highlights the 'WATCH_ZONE' status for ETHUSD. A clear trade setup – either a confirmed breakout above resistance or a decisive breakdown below support – is yet to materialize. For a bullish scenario to gain traction, ETHUSD needs to convincingly break and hold above the $1,931.23 resistance. This would likely require sustained buying pressure, potentially fueled by positive news flow or a weakening DXY. On the flip side, a bearish scenario would be triggered by a close below the $1,917.03 support, which could accelerate towards the $1,889.35 level on the 4H chart, especially if broader market sentiment turns risk-averse.
Crypto Ecosystem Developments and ETHUSD's Future
Beyond the charts, the broader cryptocurrency ecosystem plays a vital role in ETHUSD's price action. Ethereum's transition to Proof-of-Stake (PoS) has fundamentally altered its tokenomics, with staking yields becoming a significant factor influencing investor behavior. Currently, staking yields are a key incentive for holding ETH, potentially creating a structural demand floor. Developments in the Decentralized Finance (DeFi) and Non-Fungible Token (NFT) sectors, which are largely built on Ethereum, also impact its value. A resurgence in DeFi activity, measured by Total Value Locked (TVL), or a boom in NFT markets, could drive demand for ETH as the native gas token. Conversely, high gas fees, which can occur during periods of intense network congestion, might deter users and negatively impact ETH price, although the current market data doesn't provide specific gas fee information.
Regulatory news is another critical, albeit unpredictable, factor. Any significant regulatory clarity or crackdowns from major economies like the US, EU, or Asia can send ripples through the crypto market. For instance, news regarding potential approval of ETH-based ETFs, similar to Bitcoin ETFs, could significantly boost institutional adoption and investor confidence. Conversely, unfavorable regulatory actions could lead to sell-offs. The ongoing dialogue around crypto regulation, including discussions on stablecoin frameworks and securities classifications, remains a background risk and opportunity for ETHUSD. The recent news about Bitcoin's vulnerability and sideways movement, while not directly about ETH, indicates a cautious sentiment in the broader crypto market that could easily spill over to Ethereum.
The dominance of Bitcoin (BTCUSD) is another crucial correlation to monitor. When Bitcoin experiences significant price swings or consolidates, altcoins like ETHUSD often follow suit, albeit with amplified volatility. The provided data shows BTCUSD trading around $64,946, with mixed signals across timeframes. If Bitcoin begins a strong upward trend, it could pull ETHUSD along with it. However, if Bitcoin falters or enters a prolonged correction, ETHUSD might face headwinds, especially given its current proximity to resistance levels. The general crypto market sentiment, influenced by these large-cap movements and broader macro factors, will ultimately shape ETHUSD's path.
The current technical indicators on ETHUSD show a divergence between short-term bullish momentum and longer-term overbought conditions. RSI and Stochastic readings on the 4H and 1D charts suggest that the upside may be limited without a significant fundamental catalyst or a shift in broader market sentiment. Traders should be wary of a potential 'bull trap' if price fails to decisively break key resistance levels, and should maintain strict risk management protocols, especially given the neutral outlook on the daily timeframe.
Scenario Analysis: Charting Potential Paths Forward
Bearish Scenario: Retreat from Resistance
45% ProbabilityNeutral Scenario: Consolidation at Key Levels
30% ProbabilityBullish Scenario: Resistance Breakout
25% ProbabilityFrequently Asked Questions: ETHUSD Analysis
What happens if ETHUSD breaks decisively above the $1,931.23 resistance level?
A sustained break above $1,931.23, particularly on the 4-hour chart, would invalidate the immediate bearish concerns and could open the door for a rally towards the next key resistance at $1,940.05 and potentially $1,972.90. This would likely require strong buying volume and positive market sentiment.
Should traders consider buying ETHUSD at current levels around $1,923.00 given the mixed signals?
Buying at current levels carries significant risk due to the proximity to resistance and conflicting signals on longer timeframes. A more prudent approach would be to wait for a confirmed breakout above $1,931.23 or a pullback to a stronger support level like $1,917.03, offering a better risk-reward ratio.
Is the RSI at 68.35 on the 1H chart a sell signal for ETHUSD?
An RSI of 68.35 on the 1H chart indicates strong bullish momentum but is not yet in extreme overbought territory. While it suggests caution and a potential for a short-term pullback or consolidation, it is not a direct sell signal on its own. Confirmation from other indicators like Stochastic or a price action reversal would be needed.
How might the current DXY trend at 100.52 affect ETHUSD's price action this week?
The downward trend in the DXY, currently at 100.52, generally provides a supportive environment for risk assets like ETHUSD. A weaker dollar can increase demand for alternative investments. However, this effect could be muted if broader market risk aversion or specific crypto-related headwinds dominate price action.
"Patience is a virtue in trading. Waiting for the market to confirm a direction provides a much higher probability of success than guessing the next move."
Track markets in real-time
AI-powered analysis, technical indicators and real-time price data.
Join Our Telegram Channel
Breaking market news, AI analysis and trading signals instantly.
Join Channel