

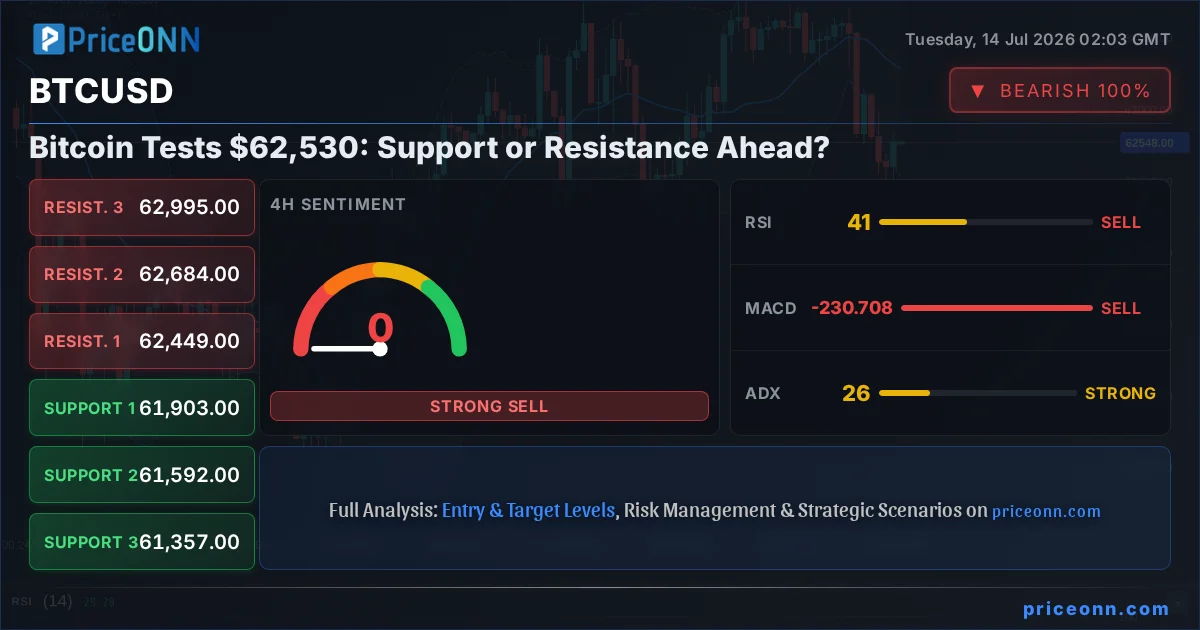
Bitcoin is currently navigating a critical juncture, trading around the $62,530 mark. This price point is more than just a number; it represents a battleground where the bulls and bears are locking horns, with the outcome dictating the next significant move for the flagship cryptocurrency. The recent price action, characterized by a notable daily drop of -2.6%, shedding $1,672 from its value and trading within a range of $61,827 to $64,428, paints a picture of indecision and heightened volatility in the crypto market. As traders and investors digest this price action, the question on everyone's mind is whether $62,530 will hold as a support level, paving the way for a recovery, or if it will crumble under selling pressure, leading to further downside. This analysis delves into the technical indicators, market sentiment, and crucial levels to decipher the immediate future for BTCUSD.
- RSI at 46.42 on the 1H chart indicates a neutral stance with a slight downward lean, suggesting waning momentum rather than immediate oversold conditions.
- The ADX reading of 29.14 on the 1H timeframe signifies a strong trend, but its current position suggests caution as the trend could be nearing a critical juncture.
- Key support levels to watch are $62,327.33, $62,101.67, and $61,930.33, while resistance is building at $62,724.33, $62,895.67, and $63,121.33.
- The broader market sentiment, influenced by global risk appetite and macroeconomic factors like DXY movements, will play a significant role in BTCUSD's next directional move.
The Tug-of-War at $62,530: What the Charts Are Saying
The 1-hour BTCUSD chart presents a fascinating, albeit tense, picture. While the current price hovers precariously around $62,530, the technical indicators offer a mixed bag of signals, reflecting the market's current indecision. The Relative Strength Index (RSI) sits at 46.42, firmly in neutral territory but leaning towards bearish momentum. This suggests that while the selling pressure might be easing from its peak, the bulls haven't yet gathered enough strength to initiate a decisive rally. Historically, an RSI in this zone doesn't signal an immediate reversal but rather a period of consolidation or a potential continuation of the prevailing trend, which has recently been downwards. The Average Directional Index (ADX) at 29.14 on the same timeframe is a significant clue; it indicates a strong trend is in play. However, the direction of that trend is what traders are scrutinizing. Combined with the RSI's lean, this suggests the prevailing downward momentum, while strong, might be facing a challenge at current levels.
Further complicating the narrative, the MACD (Moving Average Convergence Divergence) indicator shows positive momentum, with the MACD line currently above its signal line. This typically suggests upward pressure. However, this bullish signal from the MACD on the 1-hour chart appears to be at odds with the broader bearish sentiment suggested by the RSI and the ADX's trend strength. This divergence is precisely where seasoned traders look for confirmation. A true breakout often requires multiple indicators to align, or at least not to contradict each other so starkly. The Bollinger Bands on the 1-hour chart are also noteworthy; they are positioned above the middle band, indicating a generally upward bias in the short term, yet this is happening within a context of broader selling pressure. The Stochastic Oscillator, with K at 71.19 and D at 36.78, is flashing a bullish signal, indicating a potential upward move as the %K line has crossed above the %D line. This is perhaps the most bullish signal currently available on the 1-hour chart, but its validity hinges on whether it can overcome the bearish undertones from other indicators and the recent price action.
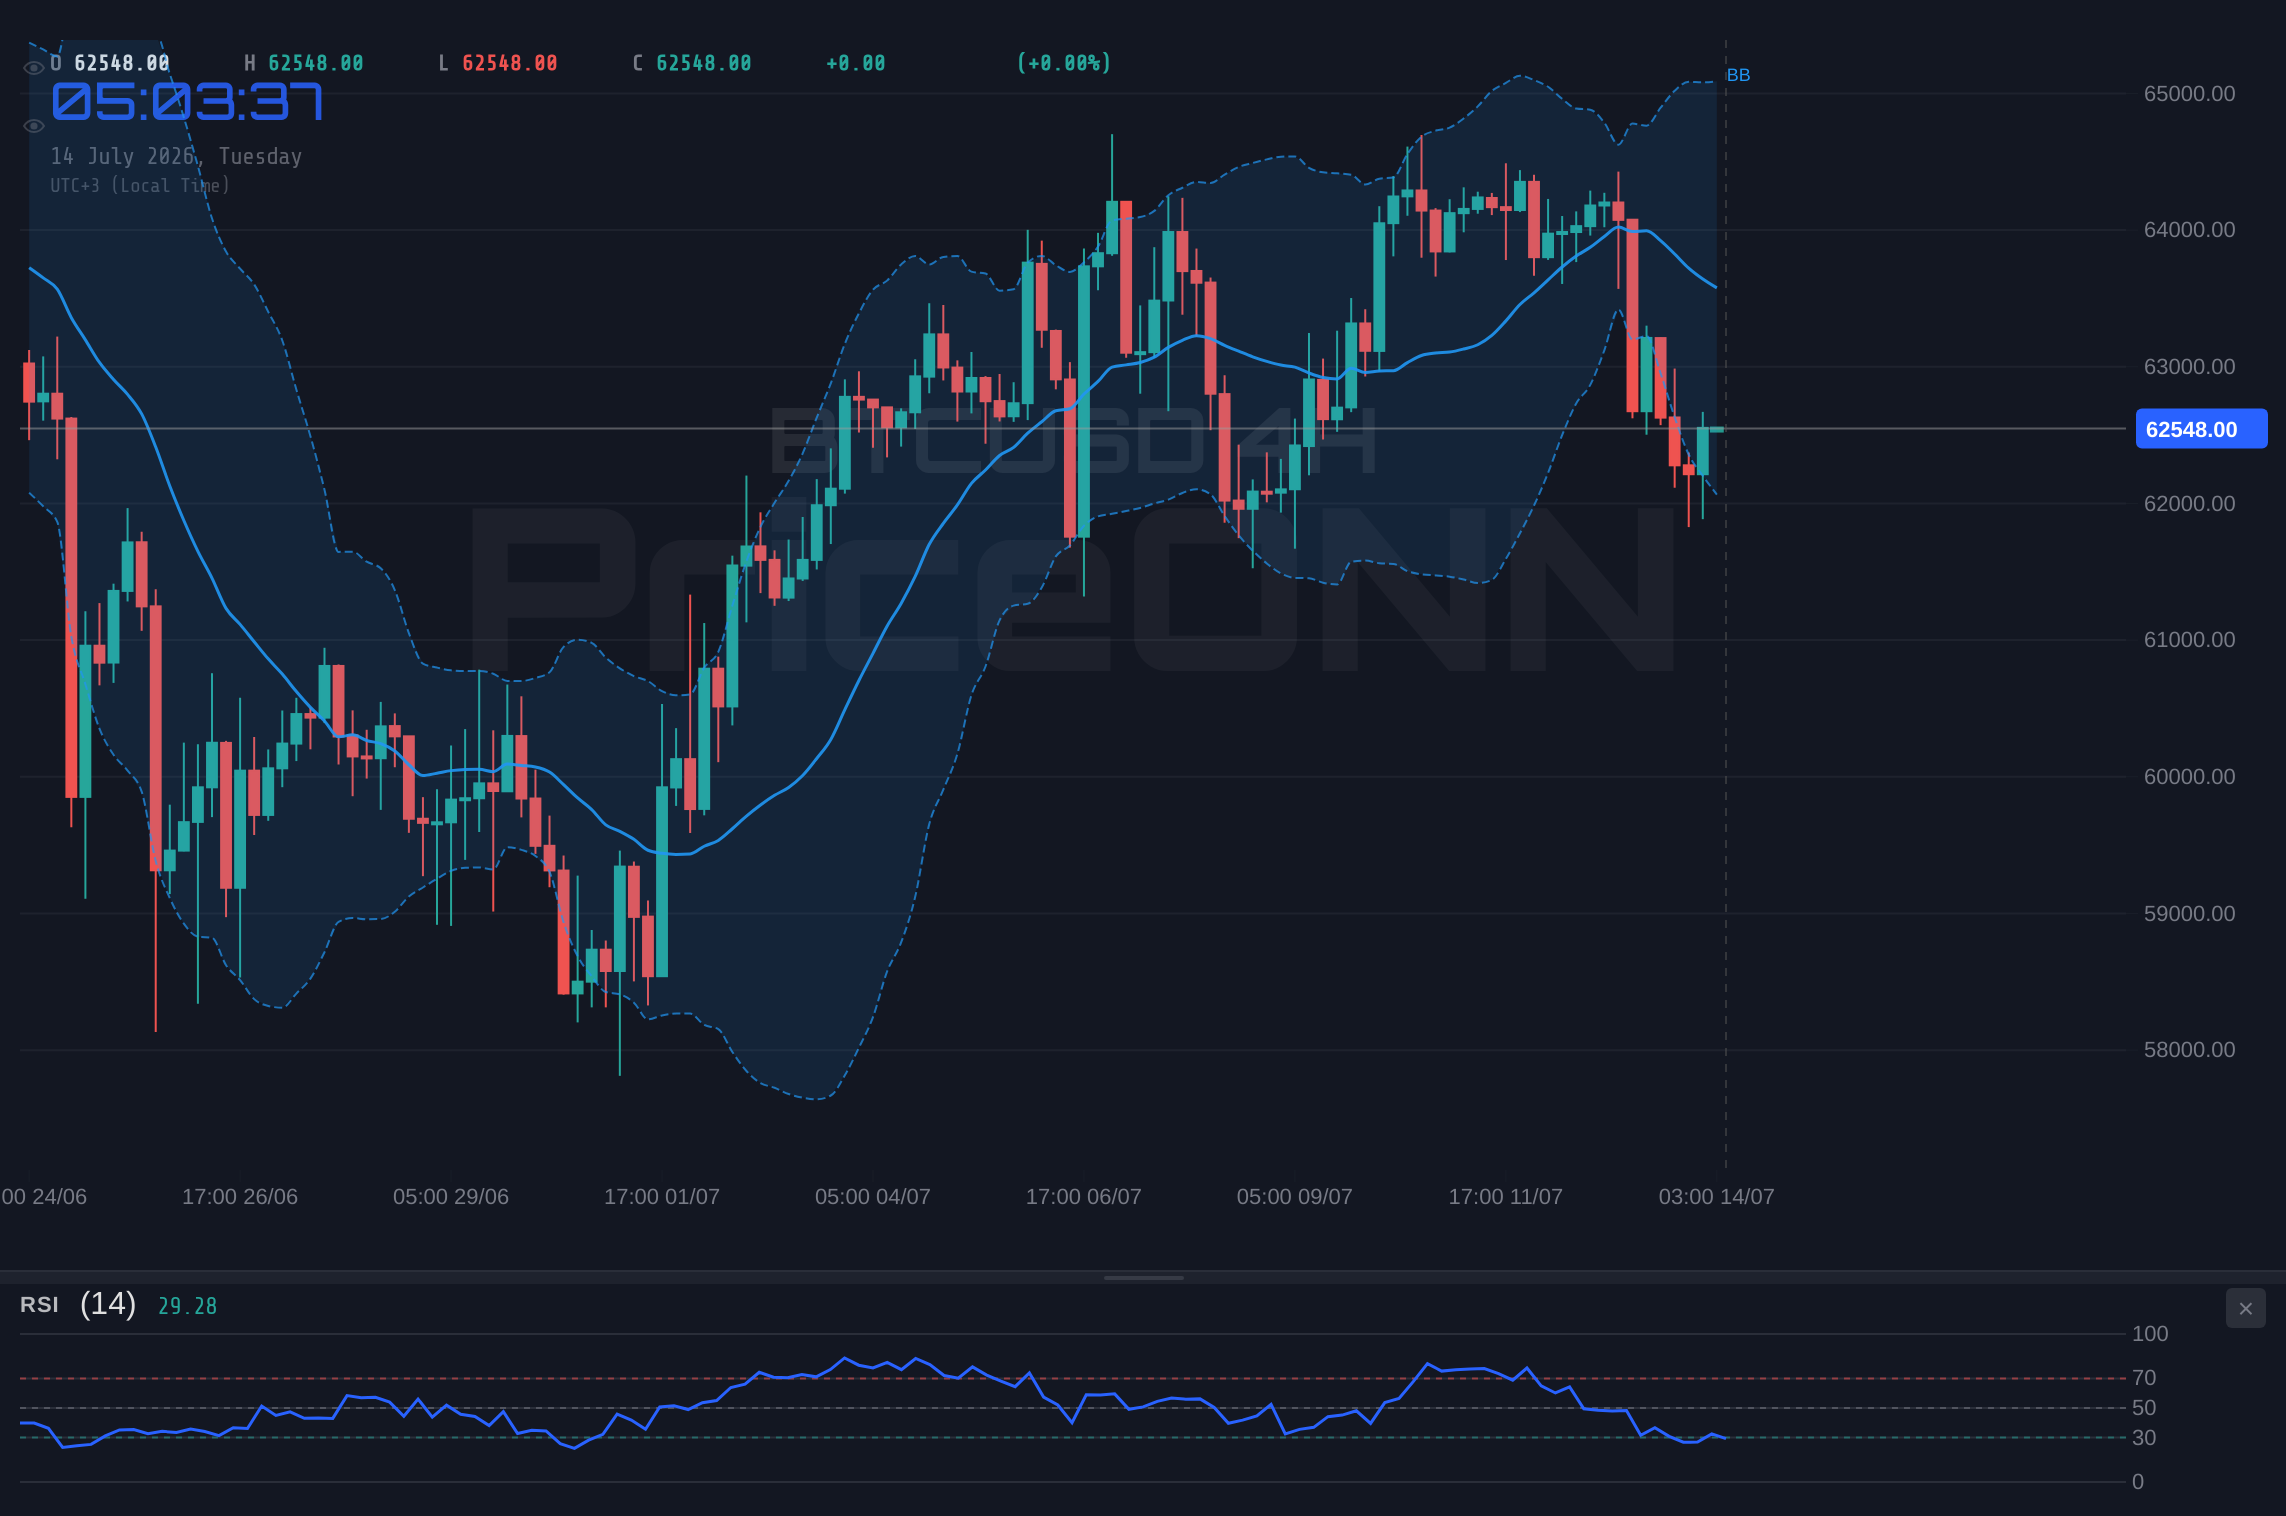
Navigating the Lower Timeframes: A Deeper Dive into 4H and 1D Signals
Shifting our focus to the 4-hour timeframe for BTCUSD, the picture becomes decidedly more bearish. The trend here is classified as neutral, but with a significant 50% power, indicating a lack of clear direction but potential for sharp moves. The RSI (14) stands at 40.35, further reinforcing the bearish lean observed on the 1-hour chart. This level suggests that while not yet oversold, the market is not showing strong buying conviction. The MACD indicator on this timeframe has flipped to negative momentum, with the MACD line sitting below its signal line. This is a classic bearish signal, indicating that downside pressure is building and that recent upward moves might be short-lived. The Bollinger Bands are also positioned below the middle band, a common sign of bearish sentiment or consolidation in a downtrend. The Stochastic Oscillator presents a clear bearish signal, with K at 16.33 and D at 21.88, indicating that %K is below %D, suggesting that the market is in or approaching oversold territory and could see further declines.
The ADX on the 4-hour chart is at 25.95, confirming a strong downtrend. This aligns with the bearish signals from the MACD and Stochastic, painting a consistent picture of selling pressure. The overall signal on the 4-hour timeframe leans heavily towards SAT (Sell), with 8 out of 8 indicators suggesting a sell. This is a strong confluence of bearish indicators that cannot be ignored. It implies that any short-term bounces observed on lower timeframes might be temporary corrections within a larger bearish move. The contrast between the mixed 1-hour signals and the clearer bearish consensus on the 4-hour chart highlights the importance of multi-timeframe analysis. Traders often look for alignment across these different perspectives to confirm their trading bias. Here, the 4-hour chart strongly suggests caution for any potential long positions.
Stepping back to the daily BTCUSD chart, the trend is again categorized as neutral with 50% power, suggesting that the longer-term picture is not yet definitively established. The RSI(14) is at 46.81, continuing the theme of a bearish lean observed on shorter timeframes. This neutral-to-bearish RSI reading on the daily chart implies that the market is not yet showing signs of a strong recovery and could be consolidating before a potential further move down. The MACD indicator here, however, presents a more optimistic view, showing positive momentum with the MACD line above its signal line. This suggests that, from a longer-term perspective, there might be underlying strength or at least a lack of significant selling pressure that could support the price. The Bollinger Bands are above the middle band, which is generally a bullish sign, indicating that the price is trading in the upper half of its recent range. The Stochastic Oscillator, with K at 70.3 and D at 78.84, is showing a bearish signal, as %K is below %D, suggesting a potential pullback from current levels.
The ADX on the daily chart is 25.06, indicating a strong downtrend is in play. This daily ADX reinforces the bearish sentiment observed across shorter timeframes and contrasts with the daily MACD's positive momentum. This divergence between the MACD and ADX on the daily chart is a key area of focus. It suggests that while there might be underlying upward pressure (MACD), the overall trend strength is currently favoring the downside. The overall signal on the daily chart leans towards SAT (Sell), with 6 out of 8 indicators pointing that way. This nuanced view across different timeframes - mixed signals on the 1-hour, decidedly bearish on the 4-hour, and a divergence between bullish MACD and bearish ADX on the daily - underscores the complexity of the current BTCUSD market. It suggests that short-term traders might find opportunities in the volatility, but longer-term investors need to be patient and wait for clearer directional signals.
The Dollar's Shadow: DXY's Influence on BTCUSD
No analysis of Bitcoin's price action is complete without considering the broader macroeconomic landscape, particularly the movements of the US Dollar Index (DXY). The DXY is currently trading at 101.26, showing a significant daily increase of 0.3% and a clear upward trend on the 1-hour and 4-hour charts, with a strong bullish signal on the daily chart as well. This strengthening dollar is a critical factor that often exerts downward pressure on risk assets like Bitcoin. When the dollar strengthens, it typically means that assets priced in dollars, such as Bitcoin, become more expensive for holders of other currencies. This can dampen demand and lead to price decreases. The DXY's current upward trajectory, supported by bullish momentum on its 1-hour and 4-hour charts and a strong ADX of 32.54 on the daily, suggests that the global demand for the dollar is increasing. This could be driven by various factors, including a 'risk-off' sentiment in global markets or anticipation of specific economic data releases that favor a stronger dollar.
The correlation between BTCUSD and DXY, while not always perfect, is a significant one to monitor. Historically, a rising DXY often corresponds with a falling BTCUSD price, and vice versa. Given that the DXY is currently showing strong upward momentum, this presents a headwind for Bitcoin. The fact that BTCUSD is showing signs of weakness, with key indicators leaning bearish on shorter timeframes, could be partly attributed to the dollar's strength. For Bitcoin to mount a sustainable recovery, it would likely require either a stabilization or a decline in the DXY. The current technical setup for the DXY, with its strong uptrend and bullish signals across multiple timeframes, suggests that this dollar strength might persist in the near term, potentially capping any significant upside for Bitcoin unless other factors strongly intervene.
Equity Market Correlation: SP500 and Nasdaq's Role
Beyond the dollar, the performance of major equity indices like the S&P 500 and Nasdaq 100 provides crucial context for Bitcoin's risk appetite. The S&P 500 is currently showing a strong upward trend, trading at 6572.87 with a daily gain of 0.74%. This suggests a healthy appetite for risk in the broader equity market, which typically bodes well for cryptocurrencies like Bitcoin. The S&P 500's 1-hour and 4-hour charts show a bullish trend, although the daily chart presents a more complex picture with a bearish trend indicated by an ADX of 47.51. This divergence suggests that while the short-term sentiment is positive, the longer-term trend for equities might be facing headwinds. The Nasdaq 100, on the other hand, is showing a bearish trend on its 1-hour chart, trading at 29250.24 with a significant daily drop of -2%. This bearish signal from the Nasdaq, a key indicator for growth and tech stocks, contrasts sharply with the S&P 500's strength. This mixed signal from the equity markets adds another layer of complexity to Bitcoin's outlook.
The Nasdaq's decline, especially with its strong negative momentum on the 4-hour chart and a bearish ADX of 20.21, could be interpreted as a sign of waning risk appetite, particularly in the tech-heavy sector where many crypto-related companies are listed. If this bearish trend in the Nasdaq continues, it could spill over into Bitcoin, especially given its increasing correlation with tech stocks. The fact that BTCUSD is showing bearish signs on its 4-hour chart, while the Nasdaq is also weak, might indicate a broader sector rotation away from risk assets. However, the strength in the S&P 500 offers a counterpoint, suggesting that the overall market sentiment isn't uniformly negative. This duality means that Bitcoin's price action could be influenced by both the tech sector's weakness and the broader market's resilience, making it crucial to watch for confirmation signals across all these correlated assets.
On-Chain Metrics and Market Sentiment: The Unseen Forces
While technical indicators provide a snapshot of price action, on-chain metrics offer a deeper look into the underlying health and sentiment of the Bitcoin network. Active addresses provide insight into network usage; a rising number of active addresses typically signals increasing adoption and network activity, which is a bullish fundamental factor. Conversely, a decline in active addresses, especially during price drops, can suggest waning interest or speculative activity cooling off. Whale movements – the transactions of large Bitcoin holders – are also critical. Significant accumulations by whales can signal confidence in future price appreciation, while large sell-offs can indicate distribution and potential short-term price weakness. Exchange flows are another key metric; a net inflow of BTC to exchanges often precedes selling pressure as holders move assets to trading platforms, whereas net outflows can suggest accumulation and holding behavior.
Currently, without specific on-chain data points provided in the market context, we must infer potential sentiment from price action and correlations. The recent price drop and the bearish leanings on shorter timeframes suggest that sentiment might be cautious, with traders potentially reducing exposure ahead of further clarity. The strong ADX readings across timeframes also point to directional conviction, but the conflicting signals between timeframes suggest that this conviction is not yet unified. If active addresses were to show a decline alongside the price drop, it would strengthen the bearish case. Conversely, if whale wallets were seen accumulating at these lower levels, it could signal a buying opportunity. The lack of specific on-chain data here means we rely more heavily on technicals and correlations, but in a real-time analysis, these on-chain metrics would be paramount in validating or refuting the technical signals.
Trade Scenarios: Mapping the Path Forward for BTCUSD
Given the mixed signals and the critical price levels we're observing, several scenarios are plausible for BTCUSD. The primary tension lies between the strong trend signals on shorter timeframes and the conflicting indicators across different periods. Patience appears to be the most prudent strategy for traders at this juncture, waiting for clearer confirmation rather than attempting to catch a falling knife or betting against a potential bounce without sufficient evidence.
Bearish Scenario: Testing the Lower Bounds
65% ProbabilityBullish Scenario: The Bounce Back
25% ProbabilityConsolidation Phase: The Waiting Game
10% ProbabilityThe Verdict: A Watchful Stance Amidst Uncertainty
The current technical landscape for BTCUSD is a complex tapestry woven with conflicting signals across different timeframes. While the 1-hour chart offers some bullish divergence, the 4-hour and daily charts present a more cautious, leaning-bearish outlook, particularly with the strong ADX readings indicating trend strength. The strengthening DXY adds another layer of pressure, suggesting that the path of least resistance might continue to be downwards in the short term, at least until the dollar shows signs of reversal. The mixed performance in equity markets, with the S&P 500 showing strength while the Nasdaq falters, further complicates the risk-on/risk-off narrative that often influences Bitcoin's price.
For traders, this environment calls for a disciplined approach. The 'WATCH_ZONE' decision reflects the current lack of a high-conviction setup. A clear signal would emerge from a decisive break of a key level. Specifically, a daily close below the $62,327 support level, confirmed by increasing volume and aligned bearish signals across multiple timeframes, would open the door for a more aggressive short position targeting lower levels. Conversely, a sustained hold above $62,530, followed by a confirmed breakout above the $62,724 resistance, would signal a potential shift in momentum, warranting a closer look at long opportunities. Until then, managing risk and waiting for clarity are paramount. The market is providing a clear test of support; how it resolves will dictate the next phase of BTCUSD's journey.
Frequently Asked Questions: BTCUSD Analysis
What happens if BTCUSD breaks below the $62,327 support level?
A decisive break below $62,327, especially on increased volume, would invalidate the immediate bullish potential and likely trigger further downside. This scenario would target the next support at $61,930.33, with a secondary target at $61,357, as selling pressure could intensify.
Should I consider buying BTCUSD at current levels around $62,530 given the mixed signals?
Buying at current levels is speculative due to conflicting indicators. A higher-probability setup would require confirmation, such as a confirmed hold above $62,530 followed by a breakout above $62,724 resistance, or a clear bounce from lower support levels like $61,930.
Is the RSI at 46.42 a sell signal for BTCUSD right now?
An RSI of 46.42 is in neutral territory, leaning bearishly. It doesn't signal an immediate 'sell' on its own but indicates a lack of strong buying momentum. It suggests caution for long positions and could precede further downside if other indicators align bearishly.
How will the strengthening DXY at 101.26 affect BTCUSD this week?
The strengthening DXY typically acts as a headwind for risk assets like BTCUSD. The current DXY level of 101.26 suggests continued pressure on Bitcoin, potentially capping upside moves and increasing the likelihood of downward price action until the dollar index shows signs of reversal.
Track markets in real-time
AI-powered analysis, technical indicators and real-time price data.
Join Our Telegram Channel
Breaking market news, AI analysis and trading signals instantly.
Join Channel