

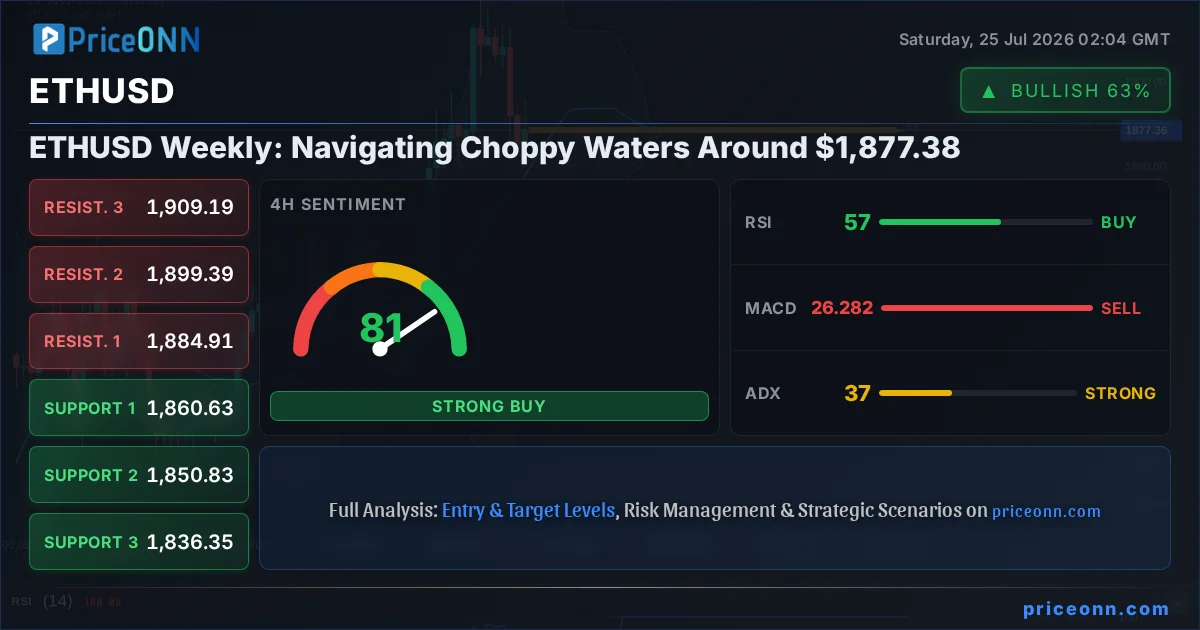
The cryptocurrency market is in a perpetual state of flux, and Ethereum (ETHUSD) is no exception. As we enter this weekend review, ETHUSD finds itself consolidating around the critical juncture of $1,877.38. This price point isn't just a number; it represents a delicate balance between bullish aspirations and bearish pressures, with a host of macroeconomic factors and on-chain metrics influencing its trajectory. The past week has been a microcosm of the broader market's indecision, marked by volatility in traditional assets and a cautious approach from crypto investors. Understanding where ETHUSD stands requires a deep dive into the technical indicators, the underlying market sentiment, and the crucial economic events that are shaping the financial landscape. This analysis aims to dissect the current positioning, explore potential scenarios, and provide clarity on what to watch in the coming week, drawing on PriceONN's data-driven insights.
- ETHUSD is currently trading around $1,877.38, hovering near key support levels.
- RSI at 39.48 on the 1H chart signals a bearish trend, while the 4H chart shows 56.88 and the 1D chart at 59.95, indicating a mixed but leaning bullish sentiment over longer timeframes.
- The MACD histogram on the 1H is negative, suggesting bearish momentum, but positive on the 1D, indicating potential underlying strength.
- Key support for ETHUSD lies at $1,868.34, while resistance is eyed at $1,891.84, according to 1H data.
- Correlation analysis shows DXY strengthening (100.7), potentially pressuring ETHUSD, while SP500 shows mixed signals (1H bullish, 1D bearish).
The Tug-of-War Around $1,877.38: A Technical Perspective
ETHUSD's current stance at approximately $1,877.38 is a testament to the complex interplay of forces shaping the crypto market. From a technical standpoint, the hourly chart paints a somewhat cautious picture, with an RSI reading of 39.48 suggesting a leaning towards bearish momentum. This indicator, which measures the magnitude of recent price changes to evaluate overbought or oversold conditions, is hovering in neutral territory but showing a downward inclination. When the RSI is below 50, it typically indicates that sellers have more control than buyers in the short term. This is further corroborated by the MACD histogram, which is currently negative on the 1H timeframe, indicating bearish momentum as the MACD line is below its signal line. The Bollinger Bands also show the price trading below the middle band, reinforcing the short-term downward pressure. The ADX at 29.09 on the 1H chart suggests a strong downward trend is in play for this timeframe, indicating that the current price action is not merely a minor fluctuation but part of a more established bearish move on the hourly scale. This confluence of bearish signals on the shortest timeframe warrants attention, especially for short-term traders looking for immediate directional cues.
However, zooming out to the 4-hour and daily charts reveals a more nuanced, and potentially more optimistic, outlook. On the 4H chart, the RSI climbs to 56.88, firmly within the neutral zone but trending upwards, suggesting that while short-term selling pressure exists, the medium-term sentiment is shifting towards bullishness. Similarly, the daily RSI at 59.95 reinforces this view, indicating a healthy upward bias that could overcome the short-term headwinds. The MACD on the daily chart is positive, with the MACD line above its signal line, a classic bullish indicator signaling strengthening upside momentum. This divergence between the hourly and longer-term timeframes is crucial. It suggests that the current dip might be a temporary correction within a larger uptrend rather than the start of a significant reversal. For swing traders and longer-term investors, these higher timeframe signals are often more significant, suggesting that dips could present buying opportunities if key support levels hold. The Stochastic indicator on the 1H chart, however, shows a K value of 26.28 and D value of 20.63, indicating a potential bullish crossover as %K > %D, which might signal an impending bounce from oversold conditions on this very short-term scale, conflicting with the RSI and MACD.
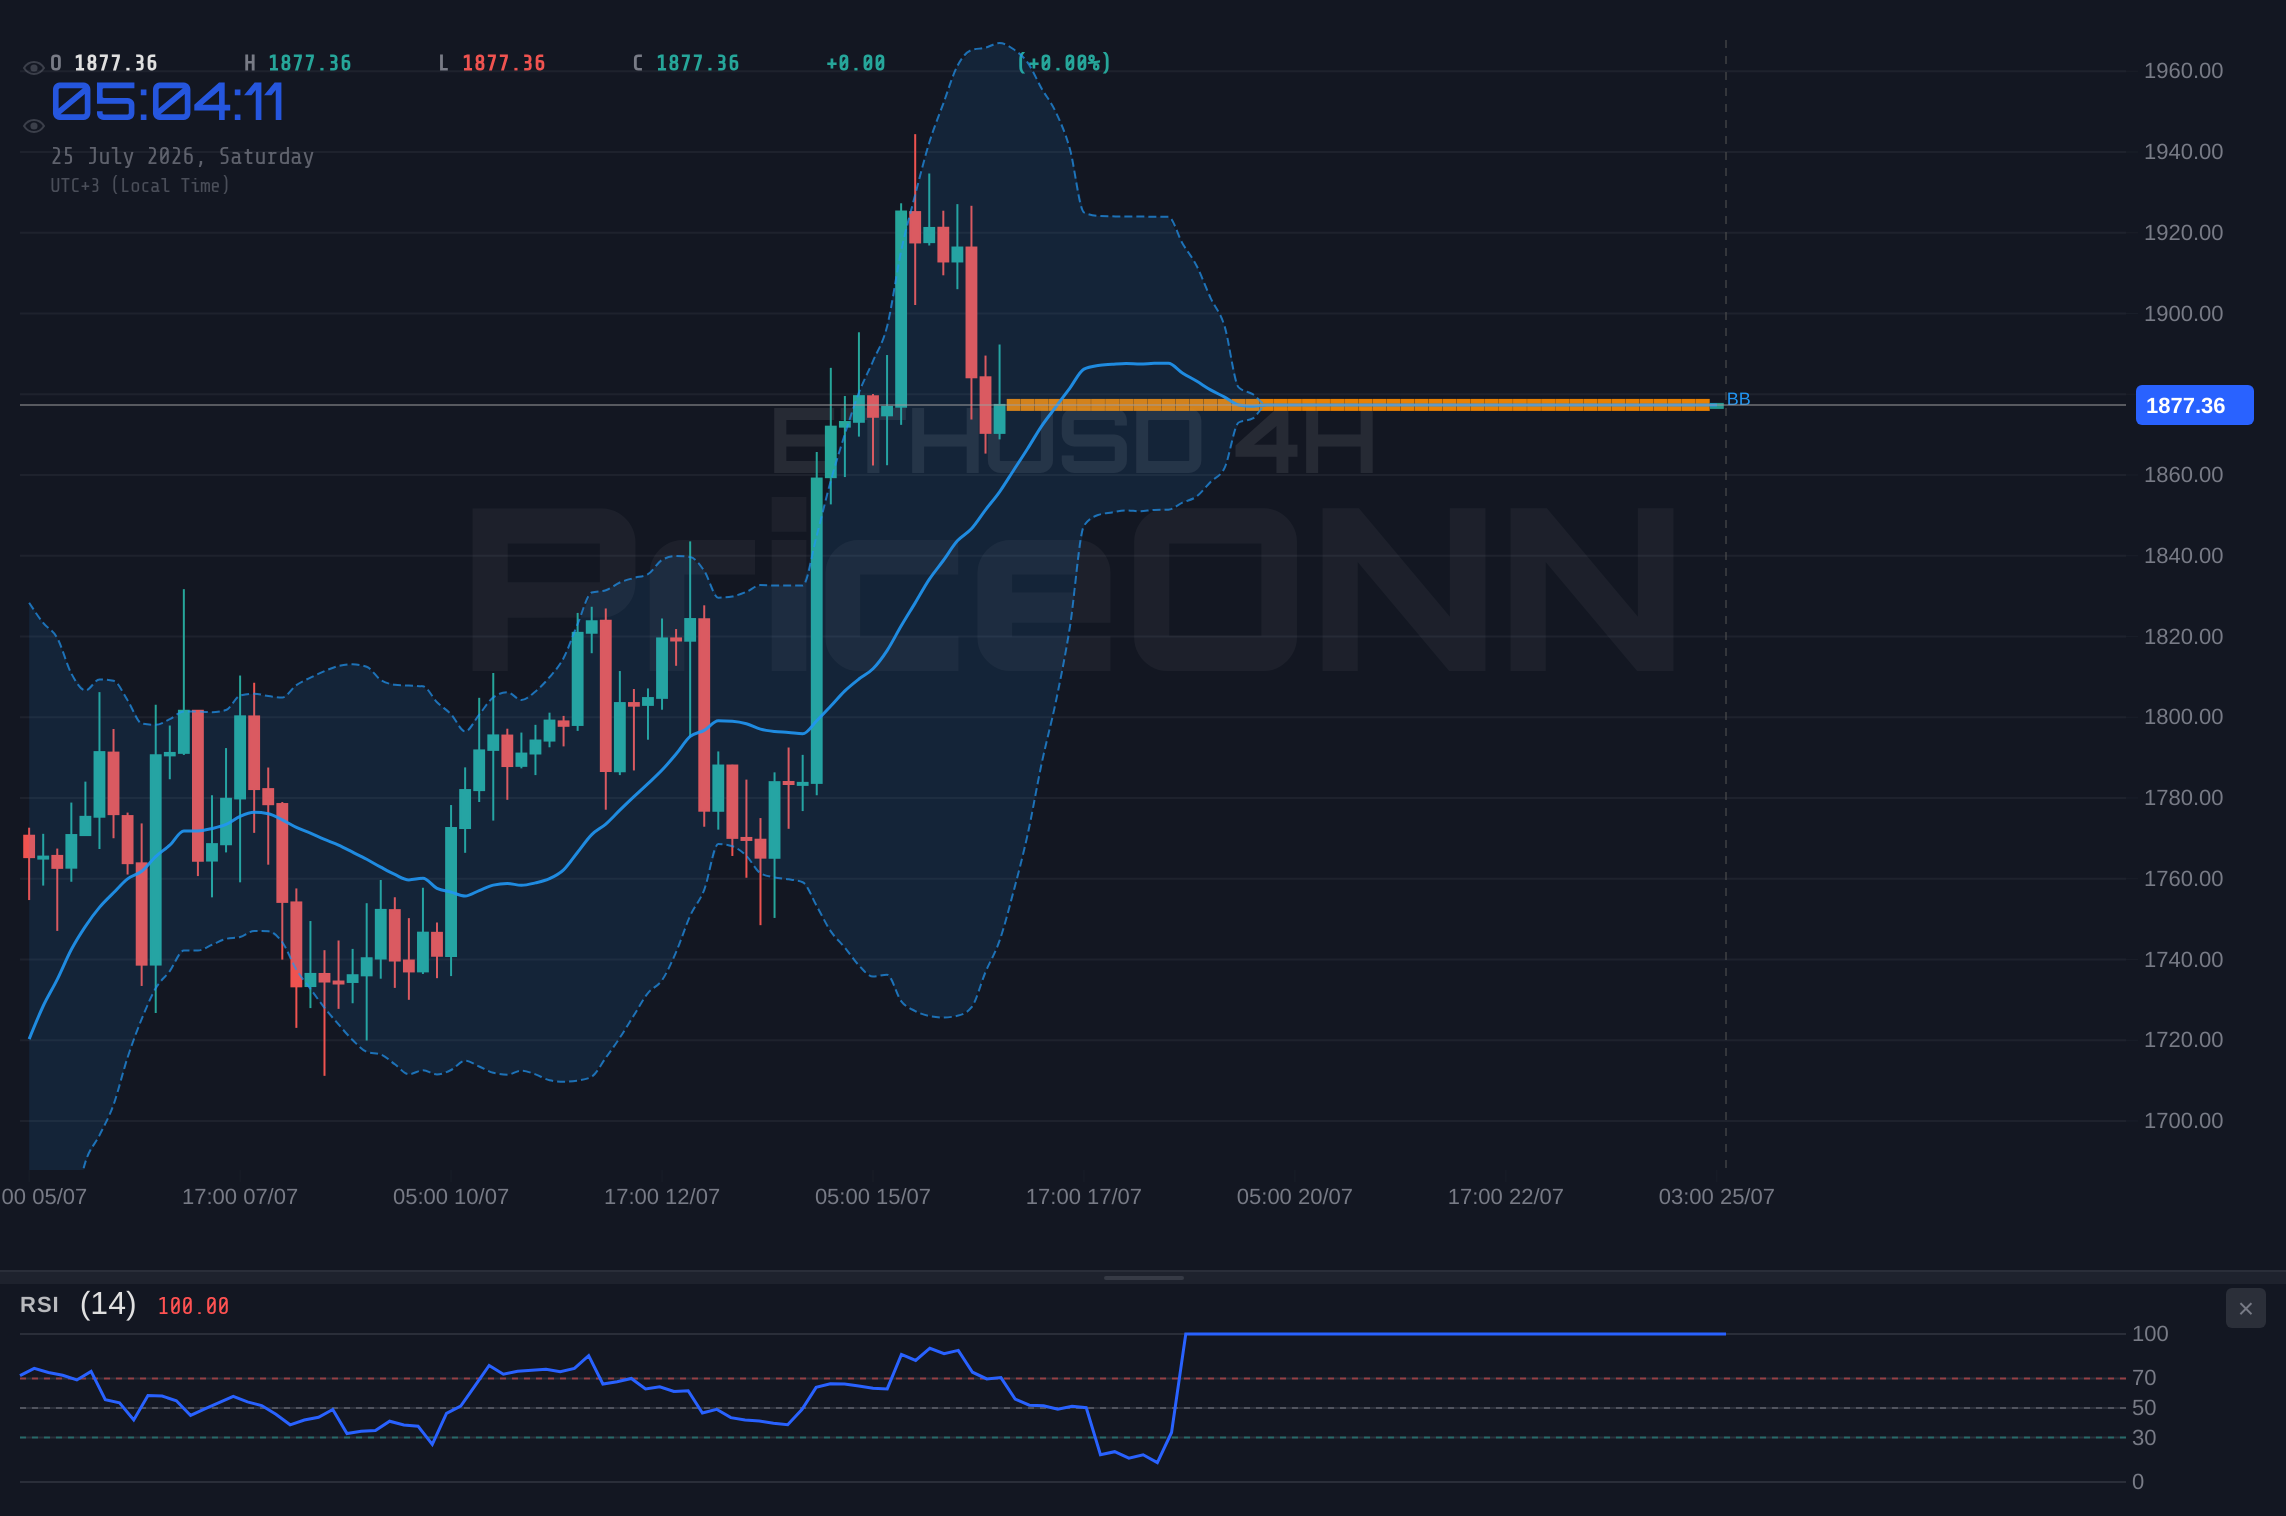
The Stochastic Oscillator on the 1H chart, with values of K=26.28 and D=20.63, presents an interesting divergence from the RSI and MACD on the same timeframe. While RSI points to bearish momentum and MACD shows negative momentum, the Stochastic is signaling a potential bullish crossover as the %K line is above the %D line. This suggests that ETHUSD might be approaching oversold territory on an hourly basis, potentially leading to a short-term bounce. For scalpers and day traders, this could be a signal to look for short-term buying opportunities, perhaps targeting the nearest resistance level. However, it's critical to remember that Stochastic signals can sometimes be premature, especially in strongly trending markets. The ADX on the 1H chart at 29.09 indicates a strong downward trend, which means that even if a bounce occurs, it might be short-lived and capped by the prevailing bearish momentum. The strength of the trend needs to be respected, and any bullish counter-trend trades should be managed with tight stop-losses. The conflicting signals between different indicators on the same timeframe highlight the current indecision and the need for careful confirmation before committing to a trade.
Delving deeper into the hourly indicators, the Bollinger Bands offer further context. Currently, ETHUSD is trading below the middle band, which is a bearish sign in the short term. The bands themselves are relatively wide, suggesting a degree of volatility, but not extreme expansion that would typically precede a major breakout or breakdown. The middle band, acting as a dynamic support or resistance, is currently around $1,884.91. A sustained move back above this level would be a crucial first step for any short-term bullish revival, potentially signaling a shift in momentum from the hourly bearish bias. Conversely, failure to reclaim this level and a subsequent move towards the lower band near $1,868.34 would reinforce the bearish outlook on the hourly chart. The interplay between the price action and the Bollinger Bands, especially in conjunction with the RSI and MACD, provides a multi-faceted view of the immediate pressures. It’s the confluence of these signals that offers the most reliable insights, rather than relying on a single indicator in isolation.
The Macroeconomic Crosscurrents: DXY, Yields, and Inflation Fears
Beyond the charts, ETHUSD, like all risk assets, is heavily influenced by the broader macroeconomic environment. The Dollar Index (DXY) is currently trading at 100.7, showing a slight upward bias. A strengthening dollar typically correlates with a weakening ETHUSD price, as it increases the cost of dollar-denominated assets for holders of other currencies and can signal a 'risk-off' sentiment where investors favor perceived safe-haven assets like the dollar. The DXY's upward move on the 1H chart, supported by RSI at 56.6 and Stochastic in overbought territory, suggests that dollar strength might be a headwind for ETHUSD in the short term. This aligns with the general principle that when the dollar strengthens, commodities and riskier assets often face downward pressure.
The recent surge in oil prices, with Brent crude nearing $90, is a significant factor that cannot be ignored. This rally, driven by geopolitical tensions and supply concerns, directly fuels inflation expectations. Central banks, particularly the Federal Reserve, are keenly watching inflation data. If inflation remains stubbornly high or resurges, it could force central banks to adopt a more hawkish stance, potentially leading to higher interest rates for longer. Higher interest rates increase the cost of capital, making speculative assets like cryptocurrencies less attractive compared to yield-bearing assets like bonds. The Fed's upcoming decisions and commentary will be critical. While the market is currently pricing in certain rate hike paths, any deviation from these expectations, especially a more aggressive stance to combat oil-driven inflation, could trigger significant volatility across all asset classes, including ETHUSD. This inflationary pressure is a key theme to monitor, as it directly impacts monetary policy and, consequently, asset valuations.
The correlation between ETHUSD and traditional equity markets, particularly the S&P 500 (SP500) and Nasdaq (Nasdaq100), remains a vital aspect of its price action. The SP500 is showing mixed signals, with a bullish trend on the 1H chart (RSI 70.95) but a bearish trend on the daily chart (RSI 45.35). This divergence suggests underlying weakness despite short-term optimism. The Nasdaq100, on the other hand, is showing a clearer bearish trend on both the 1H (RSI 32.77) and 4H (RSI 39.92) charts, indicating a broader tech sector selloff or consolidation. Given that ETHUSD often moves in tandem with these indices, especially during periods of heightened risk appetite or aversion, the weakness in Nasdaq100 is a concern. A sustained decline in major equity indices could spill over into the crypto market, putting additional downward pressure on ETHUSD, even if its own on-chain metrics appear relatively stable. Conversely, a recovery in equities, particularly tech stocks, could provide a tailwind for Ethereum.
On-Chain Activity and Ecosystem Health: Beyond the Price Tag
While price action captures immediate market attention, the underlying health of the Ethereum network, as reflected in on-chain metrics, provides a more fundamental perspective. Active addresses, a key indicator of network usage, offer insights into whether the network is gaining or losing traction. A rising number of active addresses typically correlates with increased demand and potential price appreciation, while a declining trend can signal waning interest. Similarly, transaction volumes provide a measure of network activity. Spikes in transaction volume, especially when accompanied by rising active addresses, can indicate organic growth and adoption. Conversely, high transaction counts with stagnant or falling active addresses might suggest speculative activity or network congestion rather than genuine user growth.
Whale movements – the transfer of large amounts of ETH by major holders – are closely watched. Significant inflows of ETH to exchanges from whale wallets can sometimes precede a sell-off, as these large holders may be looking to liquidate positions. Conversely, large outflows from exchanges to private wallets can signal accumulation and a belief in future price appreciation. Analyzing these flows provides a glimpse into the sentiment of the market's most influential players. Furthermore, the Total Value Locked (TVL) in Ethereum's Decentralized Finance (DeFi) ecosystem is a crucial metric for assessing the network's utility and demand. A growing TVL indicates increased participation in DeFi protocols, which drives demand for ETH as collateral, gas fees, and participation tokens. Conversely, a declining TVL might suggest capital flight from DeFi, possibly due to regulatory uncertainty, attractive yields elsewhere, or a general market downturn. The health of the NFT market, measured by trading volumes and floor prices of major collections, also contributes to the overall demand for ETH, as ETH is the primary currency for most NFT transactions.
Gas fees are another critical on-chain metric that reflects network demand and congestion. When gas fees spike significantly, it indicates high demand for block space, often driven by heavy trading activity, popular NFT mints, or intensive DeFi interactions. While high gas fees can be a sign of a vibrant network, they can also deter smaller users and traders, potentially leading to a slowdown in adoption and a shift to alternative Layer 1 solutions with lower fees. Monitoring gas fee trends, alongside network usage and TVL, helps paint a picture of Ethereum's current utility and its competitive positioning within the blockchain ecosystem. The ongoing development of Ethereum's scalability solutions, such as Layer 2 networks (e.g., Arbitrum, Optimism), also plays a role. Increased adoption and TVL on these Layer 2 solutions can alleviate congestion on the main Ethereum chain, potentially leading to lower gas fees and a better user experience, which is a long-term bullish factor for the Ethereum ecosystem.
Market Cycle Context and Historical Parallels
To truly understand ETHUSD's current position, we must contextualize it within the broader market cycle. We appear to be in a phase characterized by cautious optimism, following a period of significant downturn. The market has digested much of the negative news, but macroeconomic headwinds, particularly inflation and interest rate uncertainty, are preventing a full-blown risk-on rally. Historically, periods following major bear markets often see volatile consolidation phases where prices oscillate within defined ranges. These periods are crucial for accumulating strength before the next major upward move. During such phases, technical patterns like double bottoms, inverse head and shoulders, or prolonged accumulation ranges often form. The current price action around $1,877.38 could be part of such a consolidation, where support levels are tested repeatedly, but decisive breakdowns are avoided.
Looking back at previous Ethereum cycles, particularly the post-2018 bear market recovery and the lead-up to the 2021 bull run, we can find parallels. After the steep decline in 2018, ETH consolidated for an extended period, often trading sideways with significant volatility. Key support levels were defended, and while the path was not linear, underlying network development continued. This foundational work eventually contributed to the explosive growth seen in the subsequent bull cycle. The current environment, with its focus on technological upgrades (like the ongoing transition to Ethereum 2.0's proof-of-stake consensus and sharding) and increasing institutional interest, shares some similarities. However, the macroeconomic backdrop is different, with higher inflation and interest rates posing a greater challenge than in previous cycles. The market's sensitivity to Fed policy and global economic stability means that ETHUSD's path forward may be more constrained than in prior recovery phases. Understanding these historical patterns helps manage expectations and identify potential turning points, but it's crucial to acknowledge the unique current economic conditions.
Trading Scenarios: Mapping Potential ETHUSD Moves
Given the mixed signals from technical indicators and the uncertainty in the macroeconomic environment, several scenarios are plausible for ETHUSD. The key lies in identifying the triggers and invalidation levels for each. The current price action around $1,877.38 suggests a critical juncture, where a decisive move in either direction could initiate a more pronounced trend.
The Bearish Descent: Testing Lower Grounds
45% ProbabilityThe Sideways Shuffle: Range-Bound Consolidation
30% ProbabilityThe Bullish Rebound: Towards Higher Ground
25% ProbabilityThe bearish scenario seems most probable in the immediate short term, given the hourly technicals and the macro environment. A sustained drop below the $1,868.34 support level would likely trigger further selling pressure, potentially leading ETHUSD towards the $1,856.83 mark. This aligns with the bearish signals from the 1H RSI and MACD, and could be exacerbated if the DXY continues its upward trend or if equity markets show further weakness. The neutral scenario, a period of consolidation between $1,868.34 and $1,891.84, is also quite plausible, especially if key economic data releases offer no clear direction or if market participants adopt a wait-and-see approach ahead of major central bank announcements. This could lead to choppy, range-bound trading for the next few days. The bullish scenario, while currently less probable based on the hourly indicators, remains a possibility, particularly if ETHUSD can reclaim the middle Bollinger Band around $1,884.91 and break decisively above the $1,891.84 resistance. Such a move would likely require a shift in broader market sentiment, a weakening dollar, or positive news directly impacting the Ethereum ecosystem.
Correlation Analysis: DXY, Equities, and Oil's Influence
The relationship between ETHUSD and traditional markets is complex and often shifts. Currently, the Dollar Index (DXY) at 100.7 exhibits a strengthening trend on the 1H chart, potentially acting as a headwind for ETHUSD. If the DXY continues to climb, especially on the back of hawkish Fed expectations driven by inflation concerns, it could exert downward pressure on ETHUSD. This inverse correlation is a standard dynamic in risk asset markets – a stronger dollar often means less capital flowing into assets perceived as riskier or non-yielding, like cryptocurrencies.
Equity markets present a mixed picture. The SP500's 1H chart shows bullishness with an RSI of 70.95, nearing overbought territory, while its daily chart indicates a bearish trend with RSI at 45.35. This suggests short-term optimism tempered by longer-term concerns. The Nasdaq100, however, displays a clearer bearish sentiment across multiple timeframes, with hourly RSI at 32.77 and 4H RSI at 39.92. A sustained downturn in the tech-heavy Nasdaq could signal a broader 'risk-off' sentiment, which typically impacts ETHUSD negatively. If major tech stocks face significant selling pressure, capital might rotate away from speculative assets like ETHUSD towards safer havens. Therefore, monitoring the health of the SP500 and especially the Nasdaq100 is crucial for gauging the risk appetite of the broader market, which directly influences ETHUSD's potential upside.
The impact of oil prices, specifically Brent crude nearing $90, cannot be overstated. This rally directly contributes to inflationary pressures globally. Higher oil prices can lead to increased consumer costs, potentially forcing central banks like the Federal Reserve to maintain or even increase interest rates to combat inflation. This hawkish monetary policy stance is generally bearish for risk assets such as ETHUSD. If oil prices continue to surge, it could create a narrative of persistent inflation, leading to higher bond yields and a stronger dollar, all of which are negative factors for ETHUSD. Conversely, a significant pullback in oil prices could ease inflation concerns, potentially leading to a more dovish monetary policy outlook, which would be supportive for ETHUSD. The energy market's trajectory is, therefore, a critical macro driver to watch, acting as a barometer for inflation expectations and central bank reactions.
Different Trader Perspectives: What to Watch
For scalpers and day traders operating on the 1H timeframe, the immediate focus remains on the $1,868.34 support and $1,891.84 resistance levels. The conflicting signals between RSI, MACD, and Stochastic on the hourly chart suggest that quick, tactical trades might be in play. A break below $1,868.34 could offer a short-term bearish opportunity targeting $1,856.83, while a push above $1,891.84 might signal a temporary bounce towards $1,903.83. Patience and strict risk management are paramount, as the hourly trend is currently bearish. Confirmation through volume spikes or clear breaks of these immediate levels would be essential before entering any short-term positions.
Swing traders, who typically hold positions for days to weeks, should pay closer attention to the 4-hour and daily charts. The RSI readings of 56.88 (4H) and 59.95 (1D) suggest that the medium-to-longer-term trend might still be intact or recovering. The key is whether ETHUSD can hold above the critical support zone around $1,827.25 (1D Support 2). If this level holds and a daily close above $1,891.84 occurs, it could signal a resumption of the bullish trend, with targets potentially extending towards $1,956.29 (1D Resistance 1). Invalidation for this bullish thesis would be a decisive daily close below $1,827.25. The current price action near $1,877.38 presents a potential entry zone for swing traders looking for a bounce, provided they set tight stop-losses below the immediate hourly support.
Long-term investors, focusing on the bigger picture and fundamental strength, will look beyond short-term price fluctuations. They will be monitoring the continued development of Ethereum's ecosystem, particularly Layer 2 scaling solutions, the growth in DeFi TVL, and any significant institutional adoption news. From a technical perspective, the daily chart remains the most relevant. Holding the $1,827.25 support level is crucial for maintaining the long-term bullish structure. A decisive break below this level, especially on high volume, would signal a potential shift in the long-term trend, warranting a reassessment of positions. For these investors, the current choppy price action around $1,877.38 might be seen as a consolidation phase within a larger uptrend, offering accumulation opportunities at relatively attractive price points, especially if the broader crypto market narrative shifts towards a more risk-on sentiment and away from macroeconomic fears.
The Week Ahead: Key Events and Levels to Monitor
Looking ahead, the coming week will be heavily influenced by macroeconomic data releases and central bank commentary. With inflation data and Fed policy decisions in focus, volatility is likely to remain elevated. For ETHUSD, the immediate price action around $1,877.38 will be critical. The ability to hold above the $1,868.34 support level will be the first test for the bulls. A failure here could see a swift move towards $1,856.83. Conversely, a decisive break above $1,891.84, ideally accompanied by increasing volume and positive news flow, could open the door for a move towards $1,903.83 and potentially higher. Traders should closely watch the correlation with the DXY and equity markets; any significant shifts in these assets could provide early clues about ETHUSD's direction.
Specific levels to watch include: Support at $1,868.34, which needs to hold for any bullish continuation. A break below this could target $1,856.83. Resistance at $1,891.84 is the immediate hurdle. Clearing this level could lead to a test of $1,903.83. For longer-term investors, the daily support at $1,827.25 remains the critical line in the sand. A sustained hold above this level keeps the broader bullish thesis intact, while a break below could signal a more significant correction. The market sentiment, heavily influenced by inflation data and Fed expectations, will likely dictate whether ETHUSD can break out of its current range or whether it succumbs to selling pressure.
Frequently Asked Questions: ETHUSD Analysis
What happens if ETHUSD breaks below the $1,868.34 support level?
If ETHUSD closes decisively below $1,868.34 on the hourly chart, it would likely trigger further selling, potentially targeting the next support at $1,856.83. This scenario is supported by the current bearish momentum indicated by the 1H RSI and MACD, and could be amplified by a strengthening DXY.
Should I consider buying ETHUSD at current levels around $1,877.38 given the mixed signals?
For short-term traders, buying near $1,877.38 might be considered a tactical play targeting a bounce towards $1,891.84, but it carries risk due to the hourly bearish trend. A more prudent approach for swing traders might be to wait for confirmation, such as a hold of $1,868.34 or a break above $1,891.84, with a probability estimate favoring caution currently.
Is the RSI at 39.48 on the 1H chart a definitive sell signal for ETHUSD?
An RSI of 39.48 on the hourly chart indicates bearish momentum but is not yet in oversold territory. While it suggests sellers are in control in the short term, it's not a definitive sell signal on its own. Confirmation from MACD and price action breaking below key hourly support levels like $1,868.34 would strengthen the bearish case.
How might the upcoming Fed policy decisions impact ETHUSD's price around $1,877.38 this week?
If the Fed signals a more hawkish stance due to persistent inflation concerns (potentially fueled by oil prices), it could strengthen the DXY and put downward pressure on ETHUSD, making a break below $1,877.38 more likely. Conversely, a more dovish or neutral tone could ease these pressures, potentially supporting a move back towards resistance levels.
| Indicator | Value | Signal | Interpretation |
|---|---|---|---|
| RSI (14) | 39.48 | Bearish | Hourly RSI indicates bearish momentum, but daily RSI (59.95) suggests underlying strength. |
| MACD Histogram | -0.52 | Bearish | Negative on 1H, indicating bearish momentum. Positive on 1D, suggesting longer-term potential. |
| Stochastic | K=26.28, D=20.63 | Bullish Crossover | Hourly Stochastic shows a potential bullish crossover, suggesting a possible short-term bounce. |
| ADX | 29.09 | Strong Trend | Hourly ADX indicates a strong downward trend; any bounce must overcome this. |
| Bollinger Bands | Middle Band: 1884.91 | Below Middle Band | Price below middle band on 1H suggests bearish pressure; reclaiming it is key. |
Track markets in real-time
AI-powered analysis, technical indicators and real-time price data.
Join Our Telegram Channel
Breaking market news, AI analysis and trading signals instantly.
Join Channel