

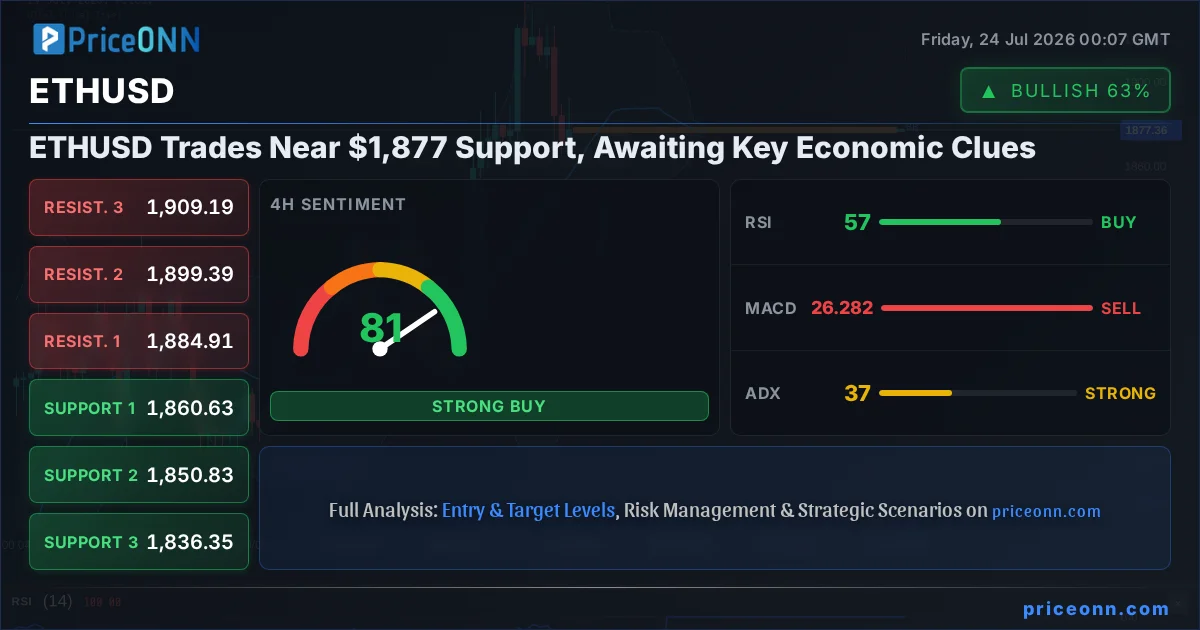
The cryptocurrency market is in a fascinating state of flux, and nowhere is this more evident than with Ethereum (ETHUSD). Currently trading precariously close to a key support level at $1,877.38, the second-largest digital asset is at a critical juncture. This price point isn't just a number; it represents a battleground where bulls and bears are vying for control, with macroeconomic undercurrents and upcoming economic data releases poised to dictate the next significant move. Understanding the interplay between these fundamental drivers and the technical landscape is paramount for navigating the current market chop.
- ETHUSD is currently trading at $1,877.38, testing significant support.
- RSI at 39.48 on the 1H chart signals a downward trend, while the 1D chart shows a higher RSI of 59.95, indicating mixed signals.
- The DXY is at 100.7, influencing forex and gold, and by extension, crypto's correlation.
- Upcoming ECB and potential Fed policy shifts are key macro drivers to watch.
The Tug-of-War at $1,877: What the Charts Say
Looking at the 1-hour ETHUSD chart, the immediate picture is one of bearish momentum. The Relative Strength Index (RSI) at 39.48 suggests sellers have been in the driver's seat, although it's not yet in oversold territory. The Moving Average Convergence Divergence (MACD) is showing negative momentum, with the MACD line below its signal line, reinforcing the short-term downtrend. Bollinger Bands are also indicating a bearish bias, with the price trading below the middle band. However, the Stochastic Oscillator is flashing a potential buy signal with %K (26.28) crossing above %D (20.63), hinting at a possible short-term bounce. The Average Directional Index (ADX) at 29.09 confirms a strong downtrend, but its relatively lower value compared to longer timeframes suggests this short-term strength might be waning or consolidating. The overall signal on this timeframe leans towards 'SELL' with 2 buy signals, 6 sell signals, and 0 neutral.
Diving deeper into the 4-hour timeframe, the trend shifts slightly. The ADX here is 36.73, still indicating a strong trend, but the overall trend strength is noted as 'UP' (94%). The RSI at 56.88 is in neutral territory, showing a rising tendency, which aligns with a potential recovery. The MACD, however, still shows negative momentum, and the Stochastic Oscillator (K=18.24, D=57.76) is firmly in bearish territory, suggesting further downside pressure. The Bollinger Bands remain above the middle band, supporting a bullish inclination. Despite the mixed signals between the 1-hour and 4-hour charts, the 4-hour timeframe shows a stronger overall 'BUY' signal (5 buy, 3 sell, 0 neutral), suggesting that while short-term headwinds exist, the medium-term picture might be more optimistic.
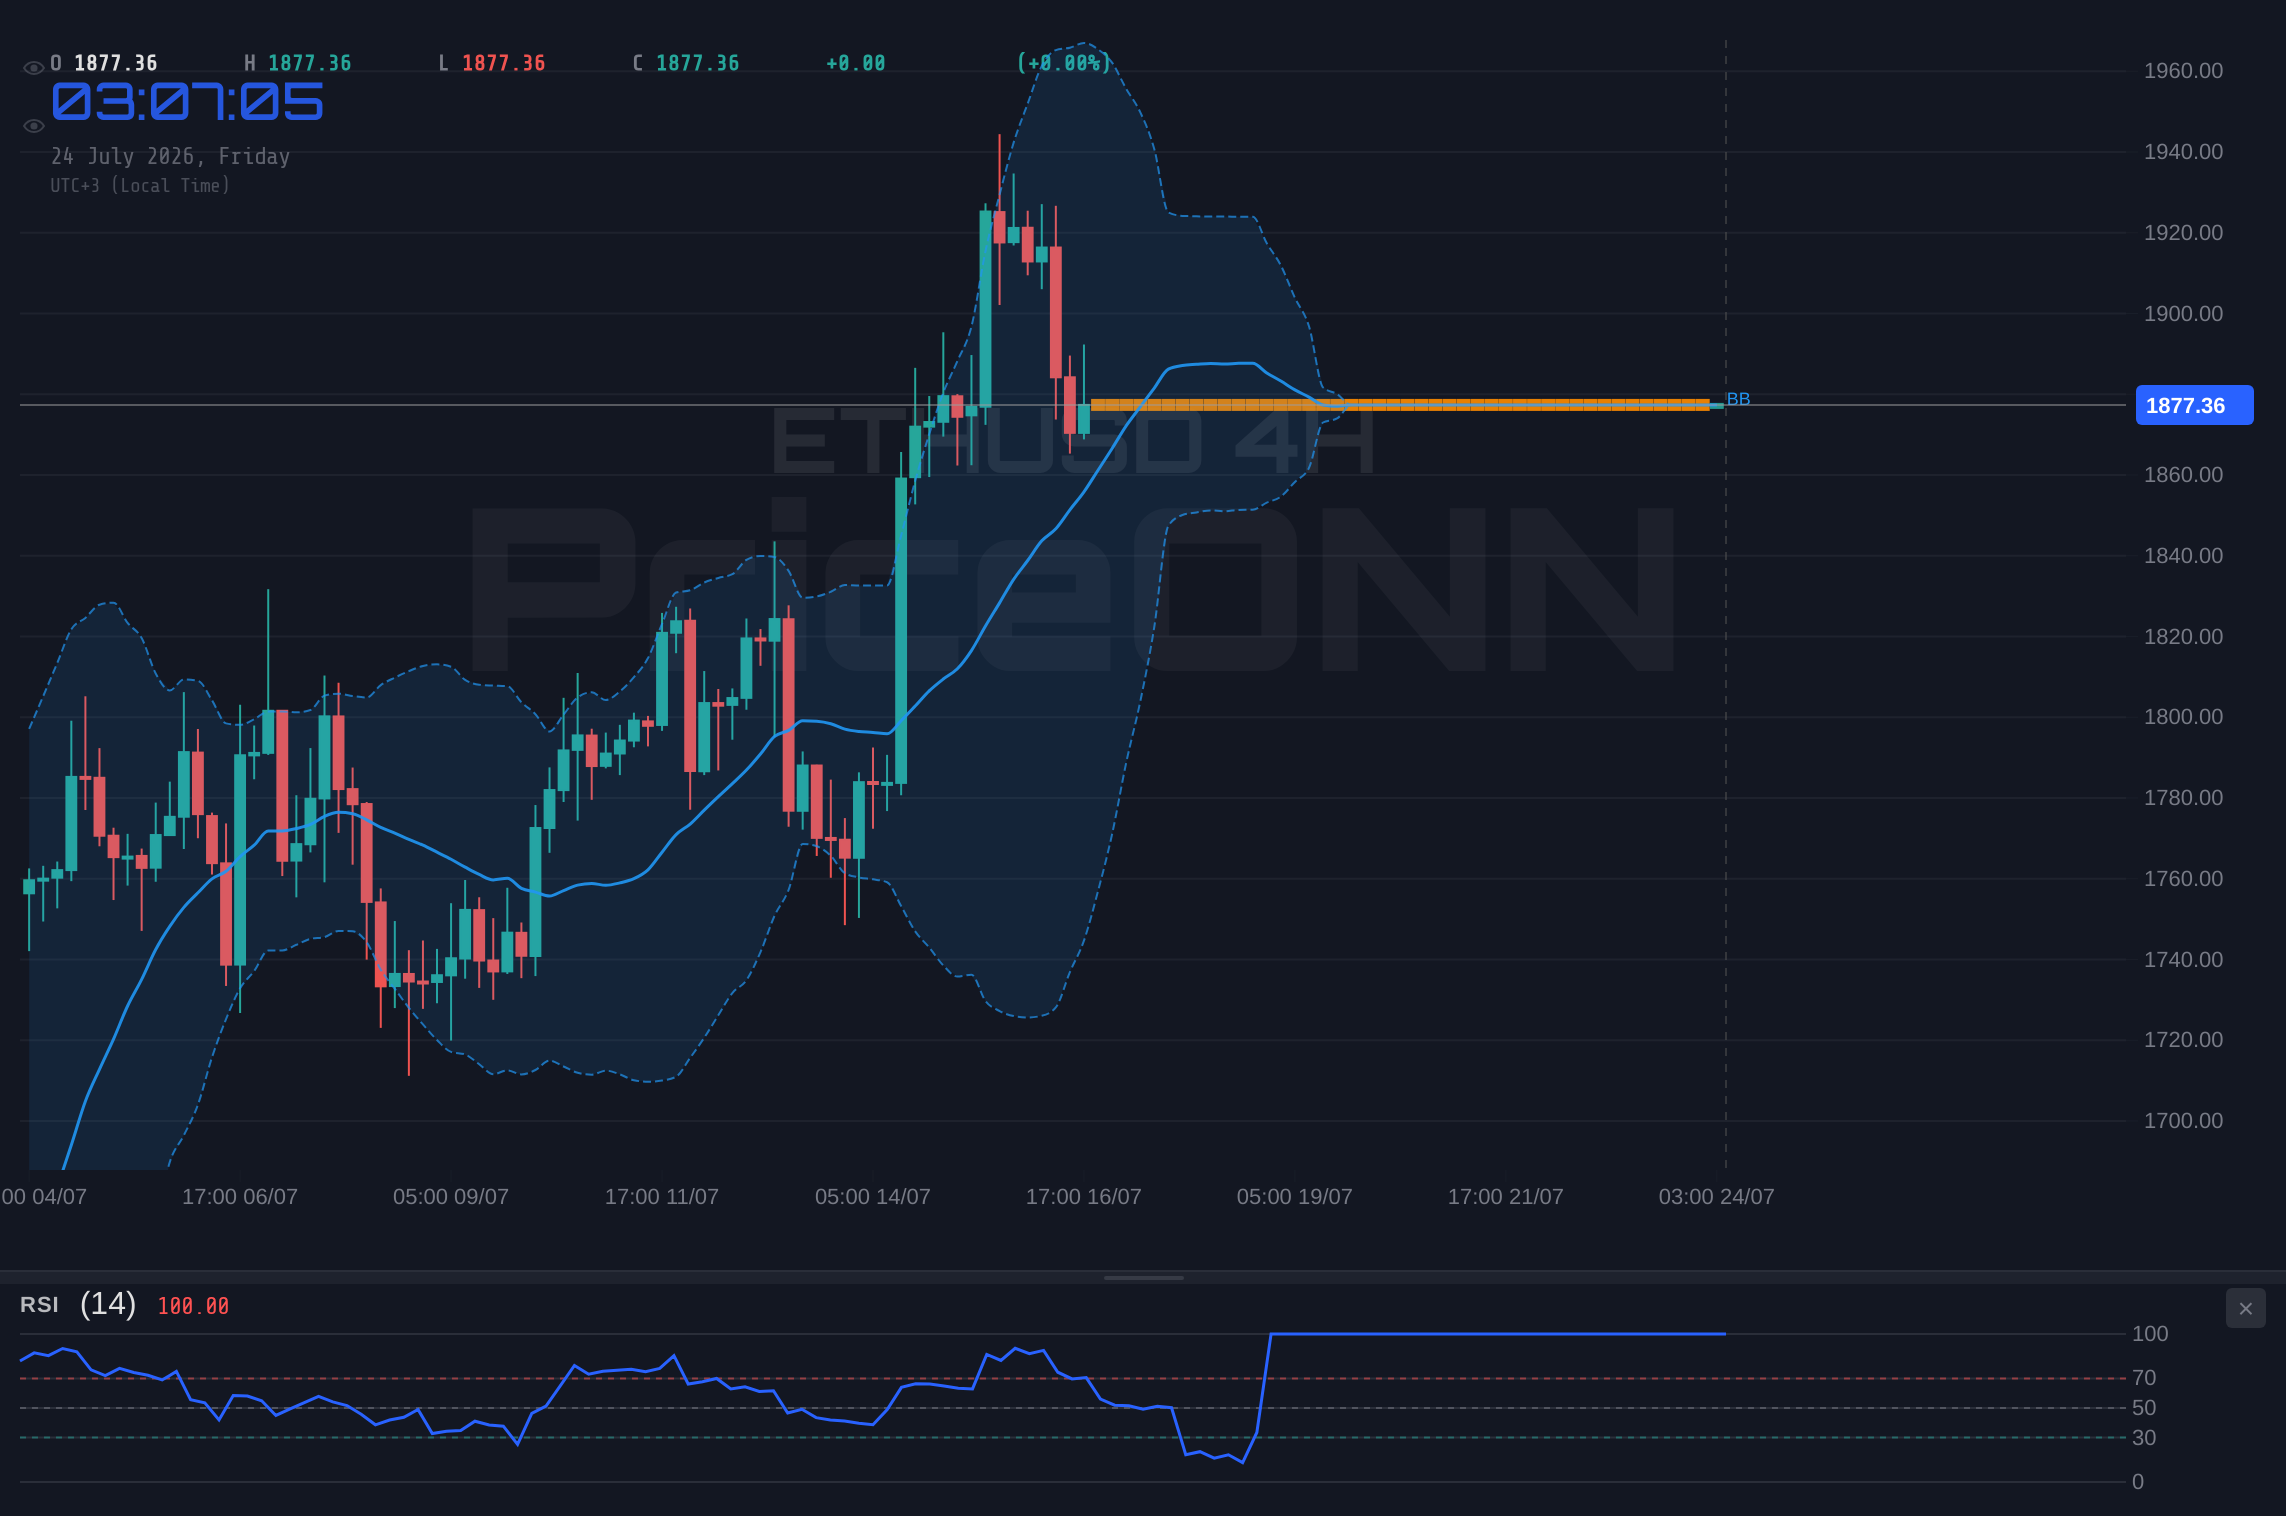
The daily chart presents a more constructive outlook for Ethereum. The RSI at 59.95 is comfortably in neutral territory, trending upwards, which is a positive sign for potential continuation. The MACD is showing positive momentum, with the MACD line above its signal line, indicating that buying pressure might be building. The Stochastic Oscillator (K=84.55, D=79.73) is in overbought territory, signalling that further upside might be limited in the short term without a pullback, but it also confirms strong bullish sentiment. The Bollinger Bands are above the middle band, reinforcing the bullish trend. The ADX at 22.66 suggests a moderately strong uptrend. The overall signal on the daily chart is a strong 'BUY' (7 buy, 1 sell, 0 neutral), indicating that from a longer-term perspective, Ethereum is in a favorable position, provided it can hold above current support levels.
The Macroeconomic Crosscurrents: Why DXY and Oil Matter
The Dollar Index (DXY) is currently at 100.7, showing a slight upward trend on the 1-hour chart and a neutral stance across other timeframes. A strengthening dollar typically puts pressure on risk assets like Ethereum, as it increases the cost of holding non-dollar denominated assets and signals a potential shift towards safer investments. The DXY's current position around 100.7 presents a mild headwind for ETHUSD, especially if it were to push higher. However, the mixed signals on the DXY across different timeframes suggest it might not be a dominant driver at this exact moment, but its influence cannot be ignored, particularly if central bank divergence widens.
The energy markets are also sending ripples through the financial system. Brent crude oil is trading at $83.79, showing a slight downtrend on the 1-hour chart but a generally bullish sentiment on the 4-hour and daily charts. The recent escalation in the Middle East, as reported by news outlets, has kept oil prices elevated, fueling inflation concerns. Higher oil prices often translate to higher inflation expectations, which can influence central bank policy. This is particularly relevant for the European Central Bank (ECB), which recently held rates steady at 2.25% but is closely watching energy shocks and inflation spillovers. The market is digesting the implications of persistent energy costs on global growth and monetary policy, which indirectly impacts risk appetite for assets like ETHUSD.
The correlation between oil prices, inflation, and central bank actions is a critical piece of the puzzle. If elevated oil prices contribute to sticky inflation, it could force central banks like the Federal Reserve to maintain a hawkish stance or even consider further tightening, despite potential slowdowns in other economic indicators. This scenario would likely strengthen the dollar further and put additional pressure on risk assets. Conversely, if inflation shows signs of abating despite oil prices, central banks might pivot towards a more accommodative policy, which could boost risk sentiment and benefit Ethereum. The recent news highlights that while oil prices are climbing, broader markets are resisting a full 'risk-off' shift, suggesting a complex interplay of factors at play.
Central Banks and the Path Forward: What to Watch
The European Central Bank's recent decision to hold rates steady, while closely monitoring inflation spillovers from energy prices, is a key event. EURUSD is showing mixed signals across timeframes, with a neutral stance on the daily chart. While the ECB opted for a hold, the market is keenly focused on future policy guidance. Any hint of a more hawkish tone, especially in response to renewed inflation risks stemming from oil, could strengthen the Euro and influence other currency pairs, including USDJPY, which is currently in a strong upward trend near 162.429. The divergence in central bank policy remains a significant theme; for instance, the Bank of Japan's accommodative stance continues to weigh on the Yen.
Looking ahead, the market's attention will undoubtedly turn to the Federal Reserve. While no immediate policy meeting is scheduled, statements from Fed officials and upcoming economic data will be scrutinized for clues on future interest rate policy. The interplay between inflation data (like CPI and PCE), employment figures (NFP), and growth indicators (GDP, PMI) will be crucial. If these data points suggest persistent inflation, the Fed might be compelled to delay rate cuts or even signal potential tightening, which would likely boost the DXY and weigh on ETHUSD. Conversely, any signs of cooling inflation or a significant economic slowdown could pave the way for a Fed pivot, creating a more favorable environment for risk assets.
The recent performance of major indices like the SP500 (trading at 6572.87 with a bullish 1H trend but bearish daily trend) and Nasdaq100 (at 29164.86, showing a strong bearish 1H trend) reflects this uncertainty. A risk-off sentiment in equities, driven by inflation fears or policy uncertainty, often spills over into the crypto market. However, the strong bullish signals on the daily charts for both BTCUSD and ETHUSD suggest underlying resilience or accumulation happening at these levels. The ability of these indices to stabilize or resume their uptrend will be a significant indicator of overall market sentiment and risk appetite, directly impacting Ethereum's trajectory.
Navigating the Uncertainty: Strategy and Risk Management
Given the current technical setup and the macroeconomic backdrop, caution is warranted. While the daily chart for ETHUSD presents a bullish picture with a strong 'BUY' signal, the short-term 1-hour chart is showing bearish momentum. The key support at $1,877.38 is being tested, and a break below it could trigger further selling pressure, potentially targeting the next support levels identified on the 4-hour chart around 1860.63 and 1850.83. The ADX readings across timeframes highlight that while trends exist, their strength and direction can be conflicting, making precise timing crucial.
For traders, the current environment calls for patience and a focus on risk management. The conflicting signals between short-term bearishness and longer-term bullish indicators suggest a period of consolidation or a potential reversal is in play. A decisive move above the immediate resistance at 1891.84 on the 1-hour chart, coupled with sustained strength above the 4-hour middle Bollinger Band, could signal a resumption of the uptrend. Conversely, a close below $1,877.38 on the daily chart would invalidate the bullish thesis and open the door for further downside, potentially towards the 1836.35 support level on the 4-hour chart.
The market is currently in a delicate balance, influenced by a mix of technical signals, geopolitical tensions affecting oil prices, and anticipation of central bank policy shifts. The DXY's movement, equity market performance, and upcoming economic data releases will all play a crucial role in shaping ETHUSD's path. While the long-term outlook remains cautiously optimistic, short-term traders should be prepared for volatility and prioritize risk management, waiting for clearer signals or decisive breakouts/breakdowns before committing significant capital. The market always gives a second chance; patience will be rewarded.
Bullish Scenario: Reclaiming the Highs
35% ProbabilityNeutral Scenario: Consolidation Around Support
40% ProbabilityBearish Scenario: Support Breakdown
25% ProbabilityFrequently Asked Questions: ETHUSD Analysis
What happens if ETHUSD breaks below the $1,877.38 support level?
A break below $1,877.38 would invalidate the current bullish short-term outlook and could trigger further selling. The next key support levels to watch on the 4-hour chart would be around $1,860.63 and then $1,850.83. This scenario becomes more likely if upcoming economic data is weak or central banks signal a more hawkish stance.
Is RSI at 39.48 a sell signal for ETHUSD right now?
On the 1-hour chart, an RSI of 39.48 indicates bearish momentum but is not yet in oversold territory. While it suggests downward pressure, it's not a direct 'sell' signal in isolation. The daily RSI at 59.95 offers a more bullish perspective, highlighting conflicting signals across timeframes that require further confirmation before a decisive trade.
How will the ECB's policy decision affect ETHUSD this week?
The ECB's decision to hold rates steady, while monitoring inflation, creates uncertainty. If the ECB signals a hawkish bias due to energy price shocks, it could strengthen the Euro and potentially weaken the USD. A weaker dollar, in turn, could indirectly support ETHUSD, but this effect might be muted if risk sentiment remains subdued due to broader macroeconomic concerns.
Should I buy ETHUSD at current levels of $1,877.38 given the mixed technical signals?
Buying at $1,877.38 carries risk due to short-term bearish indicators and the test of support. A more prudent approach might be to wait for confirmation, such as a decisive close above $1,891.84 resistance, or to enter on a confirmed bounce from support with clear risk management in place, such as a tight stop-loss below the current level.
Track markets in real-time
AI-powered analysis, technical indicators and real-time price data.
Join Our Telegram Channel
Breaking market news, AI analysis and trading signals instantly.
Join Channel