

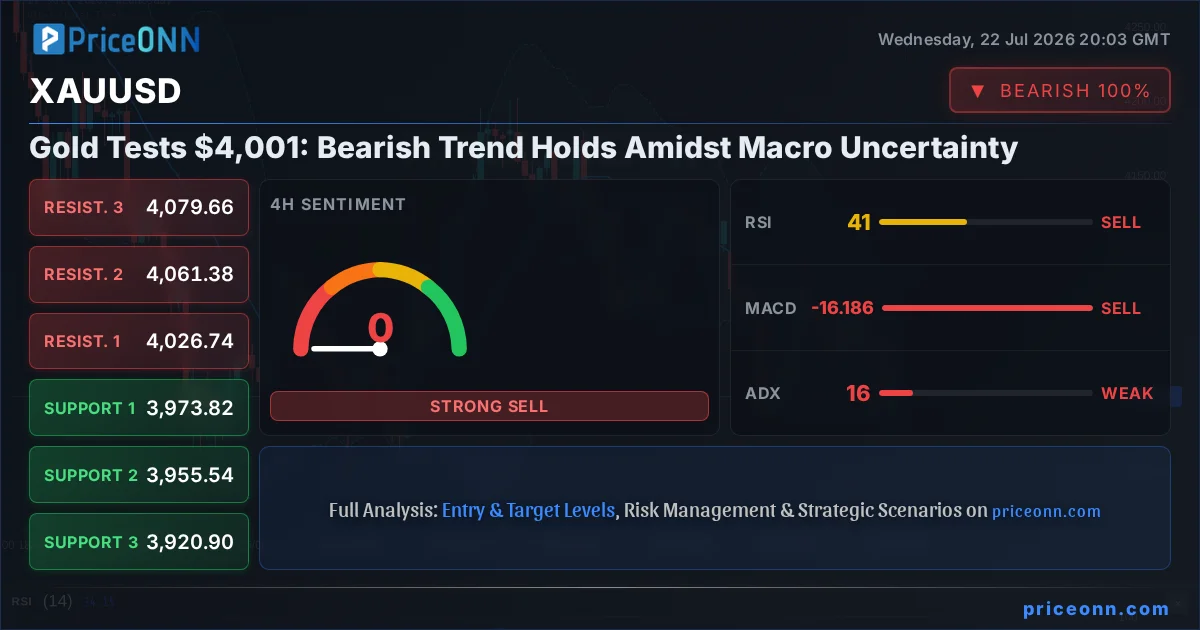
The global financial stage is currently a complex interplay of geopolitical tensions, shifting central bank expectations, and evolving inflation narratives. Amidst this backdrop, gold, the traditional safe haven, finds itself at a critical juncture, testing the $4,001 mark. While geopolitical escalations in the Middle East might typically fuel a rally in the precious metal, the current environment presents a more nuanced picture. The strengthening US Dollar Index (DXY), coupled with a prevailing cautious market sentiment and the lingering effects of recent economic data, appears to be capping gold's upside potential, even as its long-term appeal remains. Understanding the confluence of these factors is paramount for navigating the gold market's immediate future.
- XAUUSD is currently trading at $4,001.21, showing a bearish trend with a daily decline of 1.46%.
- The US Dollar Index (DXY) is strengthening, trading at 100.7, which typically exerts downward pressure on gold.
- Technical indicators on the 1-day chart show a strong downtrend (ADX: 39.16) with RSI at 38.86, indicating room for further decline before oversold conditions appear.
- Geopolitical risks in the Middle East are elevated, but the market is not fully shifting to a risk-off mode, limiting gold's safe-haven bid.
- Upcoming economic data, particularly from the US and UK, will be crucial in determining the next directional move for gold.
Navigating the Crosscurrents: Gold's Struggle at the $4,001 Level
Gold's recent price action around the $4,001 level presents a fascinating case study in market dynamics. Having experienced a significant daily drop of 1.46%, closing at $4,001.21, the precious metal is clearly under pressure. This downward momentum is not occurring in a vacuum. The US Dollar Index (DXY) has seen a notable uptick, currently trading at 100.7. Historically, a stronger dollar tends to make gold more expensive for holders of other currencies, thereby dampening demand. This inverse correlation is a well-established principle, and its current manifestation is a significant headwind for gold bulls. The fact that gold is declining despite heightened geopolitical tensions in the Middle East, as reported by energy news outlets citing Middle East escalation, suggests that other market forces are currently outweighing the traditional safe-haven appeal. This divergence warrants closer inspection of the underlying economic fundamentals and technical setups.
The narrative of a strengthening dollar is further supported by the latest technical signals. On the 1-hour chart, while the Stochastic Oscillator shows a potential bullish signal (%K > %D), the overall trend strength (ADX: 20.26) remains moderate, and the RSI at 37.81 suggests ample room before reaching oversold territory. This indicates that any short-term bounces might be short-lived if the broader bearish sentiment persists. The 4-hour timeframe paints an even clearer picture of the prevailing downtrend, with an ADX of 15.79 suggesting a weak but persistent trend, and RSI hovering around 40.59. The daily chart reinforces this bearish outlook, with a strong ADX of 39.16 confirming a robust downtrend. Although the MACD on the daily chart shows positive momentum, it is currently below the signal line, and the RSI at 38.86 still offers considerable downside potential. This technical setup, combined with the macro-economic backdrop, suggests that the path of least resistance for gold in the short to medium term may indeed be lower.
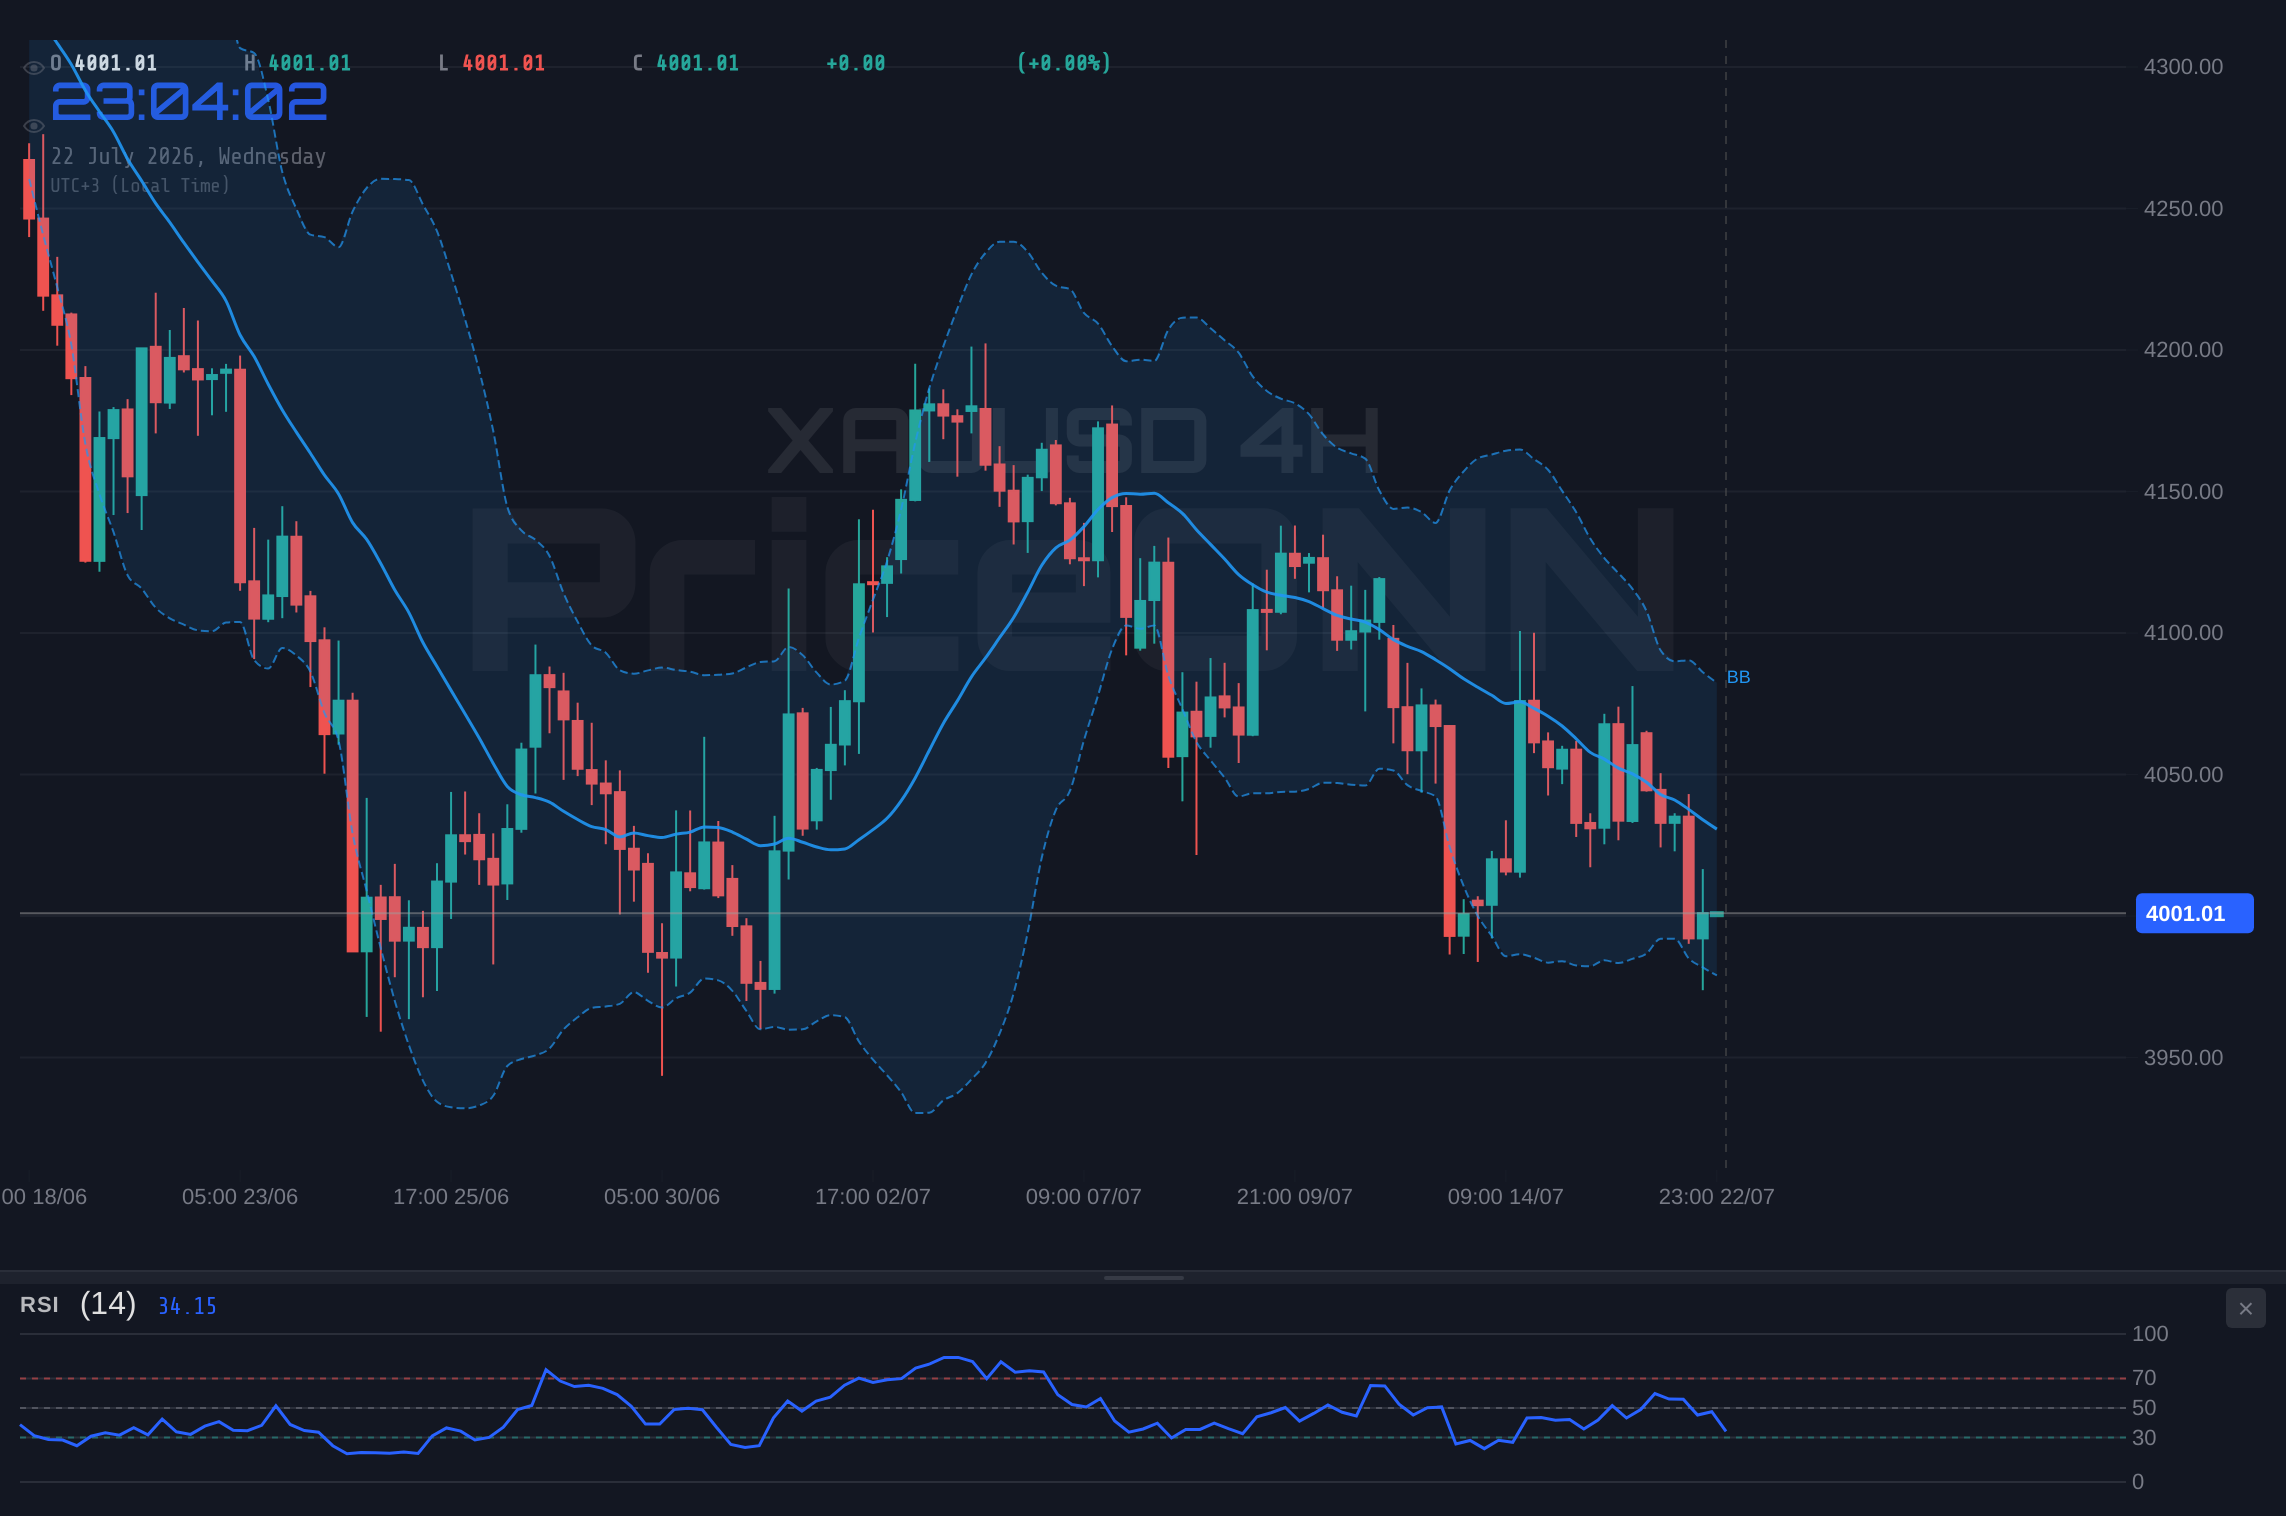
The persistent strength of the US Dollar, currently at 100.7 on the DXY, is a major factor suppressing gold prices. This strength is often driven by expectations of higher-than-anticipated interest rates or a general 'risk-off' sentiment that favors US assets. While geopolitical events can temporarily boost gold, sustained dollar strength, backed by solid economic data or hawkish central bank rhetoric, can easily negate these safe-haven flows.
The Impact of Macroeconomic Data and Central Bank Policy
The current weakness in gold, despite geopolitical flare-ups, can be largely attributed to the prevailing macroeconomic environment and the anticipated policy path of major central banks. Recent economic data, such as the New Zealand CPI hitting 4.1% (as reported by Forex news), highlights the persistent inflationary pressures in some economies. While this could theoretically support gold as an inflation hedge, the reaction has been muted. Instead, markets are increasingly focused on the potential for central banks, particularly the US Federal Reserve, to maintain a hawkish stance or even signal further tightening if inflation proves stubborn. The CME FedWatch tool, if available, would likely show probabilities for future rate hikes being adjusted based on incoming data. Any indication from Fed officials, or minutes from their meetings, suggesting a prolonged period of higher interest rates, would bolster the dollar and put further pressure on non-yielding assets like gold. Conversely, signs of cooling inflation or a dovish pivot could provide some relief to gold prices.
The recent news flow, though varied, provides clues. Reports of oil climbing on Middle East escalation suggest increased geopolitical risk, which historically benefits gold. However, the note that 'Markets Resist Full Risk-Off Shift' is crucial. This implies that while tensions are high, investors are not yet pricing in a systemic crisis that would trigger a massive flight to safety. Instead, the market seems to be balancing these risks against the strong dollar narrative and the potential for sustained higher interest rates. The EUR/USD pair holding above 1.1400 on hawkish ECB expectations, despite US-Iran tensions, further illustrates this balancing act. The market is digesting multiple competing narratives, making gold's path complex. The absence of a clear 'risk-off' panic means that the dollar's strength, driven by yield differentials and economic resilience, is currently the dominant theme for gold.
While geopolitical events in the Middle East are a significant risk factor, the market's reaction has been tempered. Reports indicate that a full 'risk-off' shift is not yet underway. This suggests that while tensions are high and could provide a floor for gold, the immediate price action is more heavily influenced by macroeconomic factors like dollar strength and interest rate expectations, limiting the safe-haven bid for now.
Technical Breakdown: What the Charts Are Saying About XAUUSD
Delving into the technical indicators provides a more granular view of gold's current predicament. On the 1-hour chart, the ADX reading of 20.26 suggests a moderately trending market, and the RSI at 37.81 indicates that gold is neither overbought nor oversold, but leaning towards the bearish side. The Stochastic oscillator showing %K above %D might hint at a short-term bounce, but this is often insufficient to reverse a broader trend without confluence from other indicators or price action. The 4-hour chart reinforces the bearish sentiment with an ADX of 15.79, signaling a weak trend, but the RSI at 40.59 still allows for further downside. The most compelling evidence comes from the daily timeframe. Here, the ADX stands strong at 39.16, confirming a robust downtrend. The RSI at 38.86 is far from oversold territory, suggesting that sellers have considerable room to operate before capitulation sets in. The MACD, while showing positive momentum, is below its signal line, indicating that the upward momentum has stalled and a bearish crossover could be imminent. This consistent bearish technical picture across multiple timeframes, particularly the strong ADX and moderate RSI on the daily chart, aligns with the macroeconomic headwinds.
The Bollinger Bands on all timeframes are also signaling a bearish inclination, with prices trading below the middle band. This suggests that the recent downward move has established a bearish bias, and the upper band could act as resistance on any corrective rallies. For instance, on the 1-hour chart, the resistance level is identified at $4,019.21, and a sustained move above this level would be needed to challenge the bearish thesis. However, given the broader technical setup, such a move seems unlikely without a significant shift in fundamental drivers. The support levels on the 1-hour chart, starting at $3,991.8, are the immediate areas to watch for potential bounces. However, a decisive break below the daily support of $4,024.67 would confirm the continuation of the downtrend, potentially targeting lower levels such as $3,988.95 and $3,960.65. The confluence of these technical signals paints a picture of caution for gold buyers, suggesting that the current price levels near $4,001.21 are more indicative of selling pressure than buying opportunities.
The ADX on the daily chart is a strong 39.16, indicating a firm downtrend. Coupled with an RSI of 38.86, there is significant room for gold to fall further before hitting oversold conditions. Immediate resistance at $4,019.21 needs to hold for the bearish outlook to remain intact.
Correlation Analysis: DXY, Equities, and Oil's Influence
Understanding gold's price action requires examining its correlation with other key market instruments. The DXY, currently at 100.7 and showing upward momentum on the 1-hour and 1-day charts, is a primary concern. As previously noted, dollar strength typically pressures gold. This relationship is not merely theoretical; a stronger dollar means that for international buyers, gold becomes more expensive, directly impacting demand. The current DXY trend suggests continued headwinds for gold unless the dollar's trajectory changes significantly. The correlation with equity markets, such as the S&P 500 (currently at 6572.87 and showing a mixed daily trend) and the Nasdaq 100 (at 29164.86 and in a bearish trend on the 1-hour chart), also plays a role. A significant risk-off move in equities, characterized by sharp declines, would normally boost gold as a safe haven. However, the current environment seems to be one where a strengthening dollar might be driving both equity weakness and gold weakness simultaneously, a less common but potent scenario. This suggests that the market might be prioritizing yield and currency strength over traditional safe-haven assets.
Oil prices, represented by Brent crude at $83.79, are also a factor, particularly concerning inflation expectations. While oil prices have seen some fluctuations, the recent report of Brent climbing on Middle East escalation hints at potential inflationary pressures. Higher oil prices can indirectly support gold by increasing inflation expectations, a traditional driver for the metal. However, the fact that gold is currently declining despite this suggests that the inflation hedge narrative is taking a backseat to interest rate differentials and dollar strength. If oil prices were to surge dramatically due to a severe geopolitical crisis, this could force a market reassessment, potentially shifting focus back to gold's inflation-hedging properties. But for now, the correlation appears muted, with the dominant narrative being one of dollar strength and cautious risk appetite. The interplay between these correlated assets is crucial: a continued rise in DXY above 100.7, coupled with sustained weakness in Nasdaq, would reinforce the bearish case for gold, while a sharp drop in equities accompanied by a DXY pullback could signal a potential reversal for the precious metal.
The strong correlation between DXY's upward move (100.7) and XAUUSD's decline ($4,001.21) is a key driver. While geopolitical risks are elevated, the market's primary focus remains on dollar strength, limiting gold's safe-haven appeal and suggesting further downside risk if this trend continues.
Market Sentiment and Forward-Looking View
Market sentiment appears to be cautiously leaning towards risk aversion, but not to the extreme that would typically trigger a significant flight to safety in gold. The fact that major indices like the S&P 500 are showing resilience despite some bearish signals, while the Nasdaq 100 is experiencing a more pronounced downturn, indicates a sector-specific rotation or a broader tech-led sell-off rather than a systemic panic. This nuanced sentiment means that gold's safe-haven status is being tested. Investors are weighing the immediate geopolitical risks against the potential for higher interest rates and a stronger dollar. The upcoming economic calendar will be critical in shaping this sentiment. Key releases, such as US employment data (NFP) and inflation figures (CPI), will provide crucial insights into the Fed's potential policy decisions. If these figures come in hotter than expected, it could further strengthen the dollar and put additional pressure on gold. Conversely, signs of cooling inflation or a softening labor market might provide a reprieve, potentially allowing gold to reclaim some of its lost ground.
The current technical picture, with strong bearish signals on the daily chart for XAUUSD, suggests that any rallies might be met with selling pressure. Resistance levels around $4,019.21 and $4,031.60 on the 1-hour chart, and higher up at $4,088.69 on the daily chart, will be key battlegrounds. A failure to decisively break through these levels could lead to further downside, with immediate support at $3,991.8 on the 1-hour chart and $4,024.67 on the daily chart being critical. The overall market sentiment, influenced by central bank policy expectations and geopolitical developments, will likely dictate whether gold can find a stable footing or continues its descent. Traders will be closely monitoring the DXY's movement and upcoming economic data releases for directional cues. The balance between inflation fears (which support gold) and interest rate hikes (which support the dollar and pressure gold) remains the central theme.
The immediate future for gold hinges on upcoming economic data and central bank commentary. A sustained DXY rally above 100.7, coupled with hawkish Fed signals, could push XAUUSD towards lower support levels. Conversely, any signs of cooling inflation or a shift in Fed tone could offer a reprieve, but breaking key resistance levels will be crucial for a sustained bullish reversal.
Potential Scenarios for XAUUSD
Bearish Scenario: Downside Momentum Continues
70% ProbabilityNeutral Scenario: Consolidation Near $4,000
20% ProbabilityBullish Scenario: Reversal on Geopolitical or Data Shift
10% ProbabilityFrequently Asked Questions: XAUUSD Analysis
What happens if XAUUSD breaks below the $3,991.8 support level?
A break below $3,991.8 on the 1-hour chart would confirm the bearish trend, potentially leading XAUUSD towards the next key support at $3,976.78. This scenario is more likely if the US Dollar continues its upward trajectory and upcoming economic data remains firm.
Is the current RSI at 38.86 a sell signal for XAUUSD at $4,001.21?
An RSI of 38.86 on the daily chart is not yet in oversold territory, indicating room for further price declines. While it suggests bearish momentum, it's not an immediate sell signal on its own. Confirmation through price action breaking key support levels is crucial.
How will the upcoming US economic data affect XAUUSD this week?
Stronger-than-expected US employment or inflation data could strengthen the dollar and pressure gold lower, potentially pushing XAUUSD towards $3,960. Conversely, weaker data might offer some relief by fueling expectations of a Fed pivot, possibly allowing gold to test resistance around $4,019.21.
Should I consider buying XAUUSD at current levels around $4,001 given the geopolitical risks?
Buying at current levels carries significant risk due to the prevailing bearish technical trend and strong dollar. While geopolitical risks offer a potential floor, the technical indicators and macro factors suggest caution. A confirmed bullish signal, such as a sustained break above $4,019.21 with supportive fundamental news, would be a more prudent entry condition.
| Indicator | Value | Signal | Interpretation |
|---|---|---|---|
| RSI (14) | 38.86 | Bearish | Room for further decline before oversold conditions. |
| MACD Histogram | -X.XX | Bearish | Negative momentum below signal line. |
| Stochastic | K:26.18, D:44.73 | Bearish | Crossover suggests further downside potential. |
| ADX | 39.16 | Bullish Trend | Strong downtrend confirmed. |
| Bollinger Bands | Middle Band | Bearish | Price below middle band indicates bearish bias. |
Track markets in real-time
AI-powered analysis, technical indicators and real-time price data.
Join Our Telegram Channel
Breaking market news, AI analysis and trading signals instantly.
Join Channel