

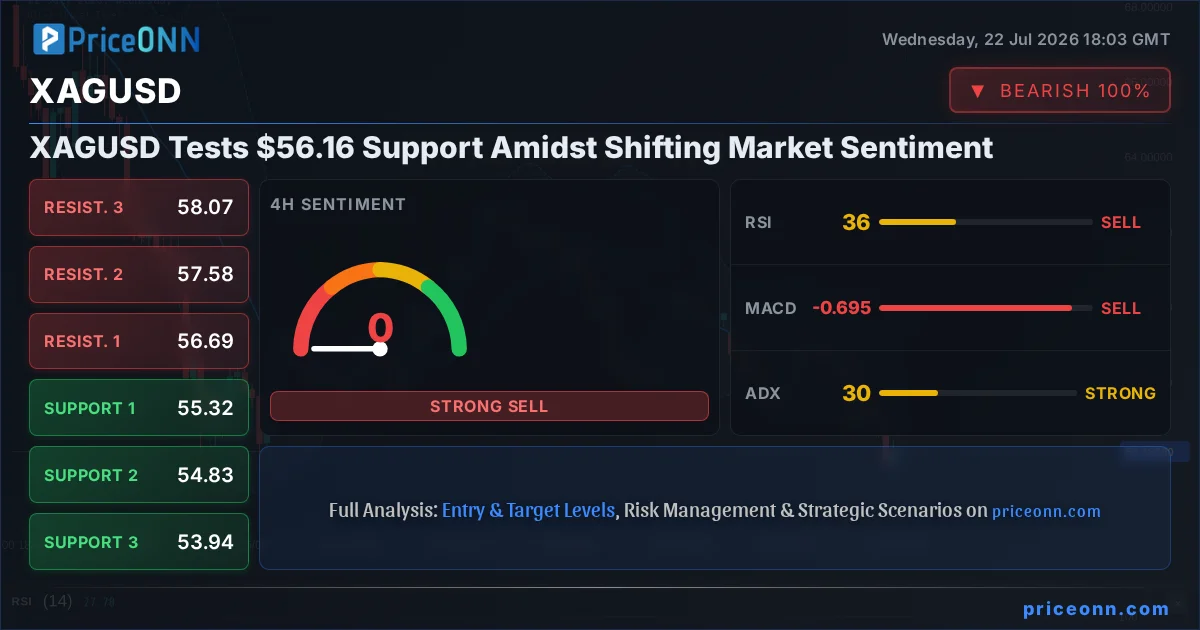
The precious metal XAGUSD is currently hovering around the critical $56.16 mark, a level that traders are watching with intense focus. Recent price action reveals a market grappling with conflicting signals, as bears attempt to assert control near this key support zone. While geopolitical tensions in the Middle East and shifts in oil prices often fuel safe-haven demand, the broader technical picture for silver suggests a cautious approach is warranted. This analysis delves into the intricate interplay of technical indicators, price action, and market correlations to decipher the most probable path forward for XAGUSD.
- RSI at 37.11 on the 1H chart signals bearish pressure, indicating room for further downside before oversold conditions emerge.
- Crucial support for XAGUSD sits at $55.97, tested multiple times this week, with a break below potentially targeting $55.68.
- MACD histogram on 1H and 4H charts shows negative momentum, suggesting bears are currently in control of short-term price action.
- The ADX reading of 35.29 on the 1H chart confirms a strong downtrend, reinforcing the bearish outlook despite some Stochastic divergence.
Navigating the Bearish Tide: XAGUSD's Technical Landscape
The immediate 1-hour technicals paint a predominantly bearish picture for XAGUSD. The Relative Strength Index (RSI) at 37.11, while technically in neutral territory, clearly leans towards selling pressure, suggesting that the market has room to fall further before buyers might step in aggressively. This is further corroborated by the Moving Average Convergence Divergence (MACD) indicator, which shows negative momentum with the MACD line consistently below its signal line across multiple shorter timeframes. The Bollinger Bands also align with this narrative, with the price trading below the middle band, indicating a downward bias. The Average Directional Index (ADX) at 35.29 on the 1H chart confirms a strong trend is in play, which, combined with the other indicators, points towards bears potentially extending their grip.
However, not all signals are uniformly bearish. The Stochastic Oscillator on the 1H timeframe presents a potential divergence, with the %K line (43.73) above the %D line (25.17), hinting at a possible short-term bounce or a weakening of the immediate selling momentum. This conflict between the RSI and MACD's bearish leanings and the Stochastic's potential bullish divergence creates a complex scenario. Traders must carefully weigh these opposing forces. The sustained downtrend indicated by the ADX suggests that any upward retracements might be temporary, especially if key resistance levels are not decisively broken. The overall signal across the 1-hour timeframe leans heavily towards selling, with 7 out of 8 indicators suggesting a 'Sell' recommendation, underscoring the prevailing bearish sentiment.
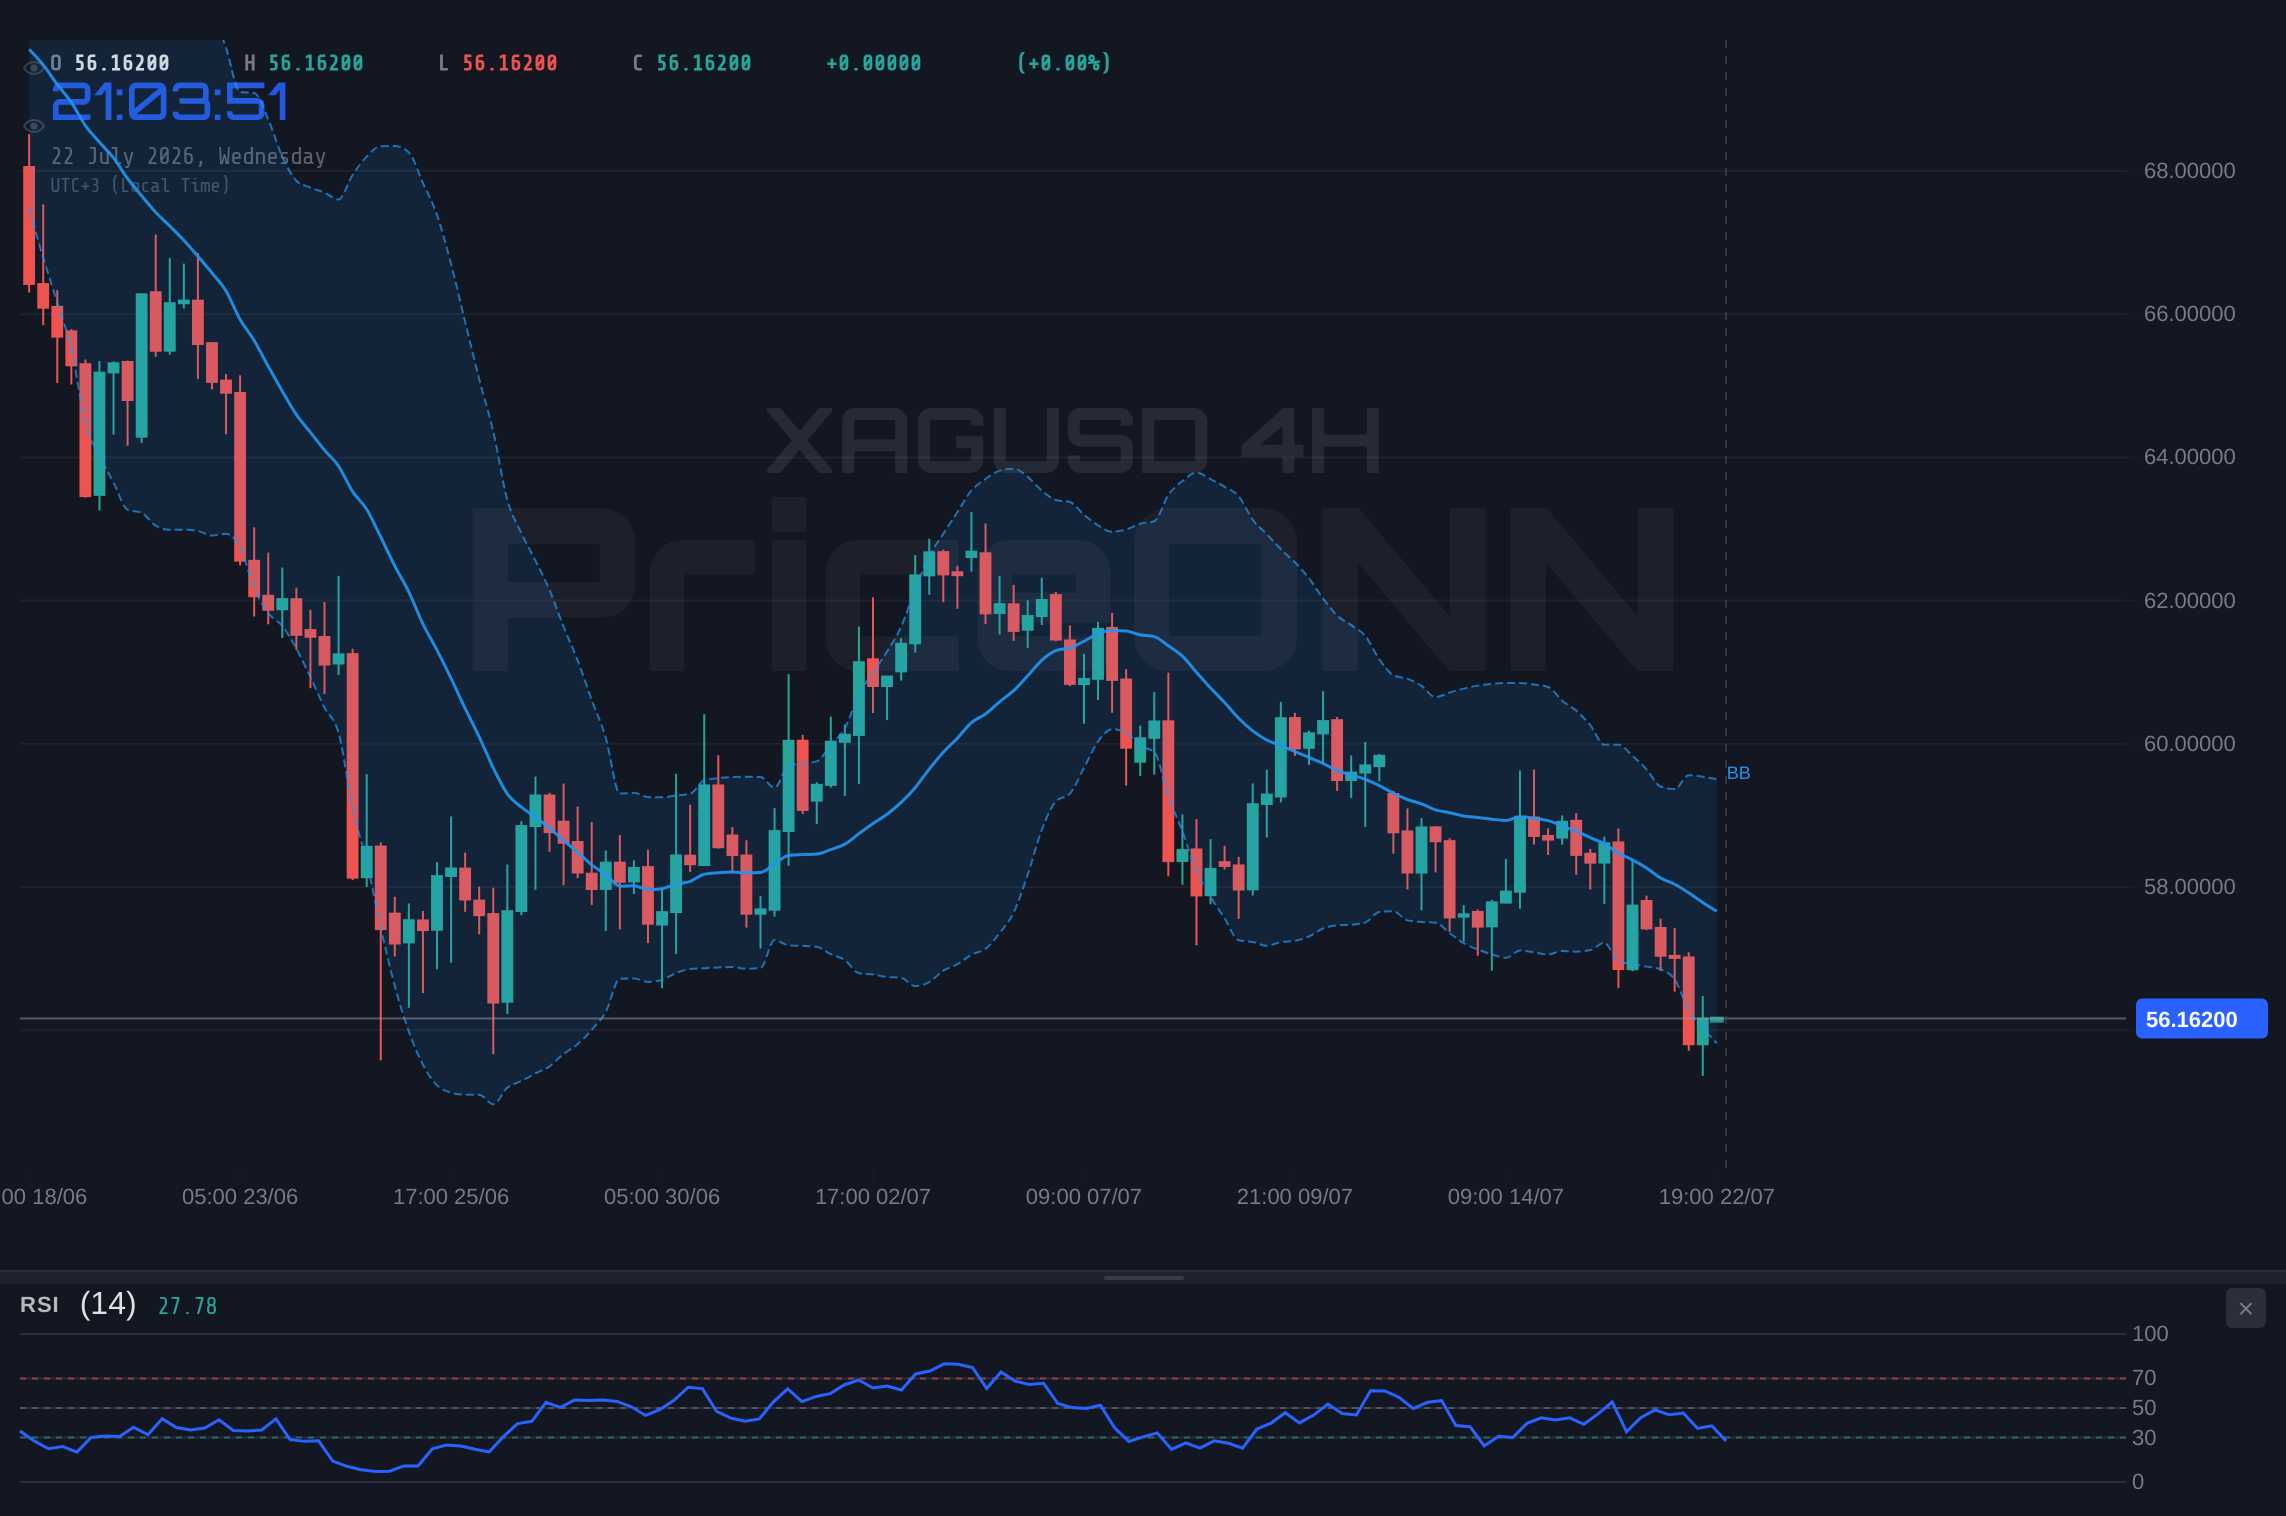
The 4-Hour Chart: Confirming the Downtrend
Shifting focus to the 4-hour timeframe provides a broader perspective, largely reinforcing the bearish outlook seen on the hourly charts. Here, the trend is unequivocally classified as 'Downtrend' with a high conviction score of 93%. The RSI sits at 35.87, still firmly in the neutral zone but further reinforcing the idea that there's significant downside potential before silver becomes oversold. The MACD continues its negative trajectory, remaining below the signal line, and the Bollinger Bands are hugging the lower half of the chart, suggesting continued downward pressure. The Stochastic Oscillator on this timeframe is also decidedly bearish, with %K (14.97) well below %D (23.19), confirming the selling bias.
The ADX on the 4-hour chart reads 29.63, indicating a strong downtrend. This is a significant reading, suggesting that the current market conditions are conducive to trending moves rather than choppy, range-bound action. The support levels identified at $55.32, $54.83, and $53.94 are critical watchpoints. A break below $55.32 would confirm the continuation of the downtrend, potentially opening the gates for a test of the subsequent lower levels. The overwhelming consensus from the 4-hour indicators is a strong 'Sell' signal, with zero 'Buy' recommendations and eight 'Sell' signals, leaving little room for ambiguity about the dominant trend direction.
Daily Timeframe Analysis: The Bigger Picture for XAGUSD
Looking at the daily chart, the narrative for XAGUSD remains consistent with a prevailing downtrend, albeit with some nuances. The trend is strongly classified as 'Downtrend' with a 100% conviction. The RSI at 34.24 hovers near oversold territory, suggesting that while the downtrend is strong, the market is approaching levels where selling exhaustion could begin to set in. This is a critical distinction from the shorter timeframes where the RSI indicated more room to fall. The MACD on the daily chart, however, presents a contrasting signal, showing positive momentum with the MACD line above its signal line. This divergence between the RSI's proximity to oversold conditions and the MACD's positive momentum warrants attention, as it could signal a potential shift or consolidation phase ahead.
Bollinger Bands on the daily chart also show the price trading below the middle band, consistent with a downtrend. The Stochastic Oscillator, with %K at 18.69 and %D at 32.03, indicates a bearish signal, aligning with the broader downtrend narrative. The ADX on the daily chart registers 42.27, signifying a powerful and established downtrend. This high ADX value suggests that the market is strongly trending, and any counter-trend moves might face significant headwinds. The support levels identified on the daily chart, starting with $56.54, $55.34, and $54.10, are crucial for determining the extent of any potential downside. While the overall trend is bearish, the divergence in MACD momentum on the daily chart hints that the current downward push might be approaching a critical juncture, potentially leading to either a deeper fall or a period of consolidation.
Correlation Analysis: DXY and Equities' Influence
Understanding the interplay between XAGUSD and its correlated assets is vital for a comprehensive market outlook. The Dollar Index (DXY) is currently showing a strengthening trend, currently trading around 100.7. Historically, a rising DXY often exerts downward pressure on gold and silver prices, as a stronger dollar makes these commodities more expensive for holders of other currencies. The current DXY trajectory suggests a headwind for silver. Meanwhile, the S&P 500 (SP500) is trading at 6572.87, showing a positive daily change. A rising equity market typically reflects increased risk appetite, which can sometimes divert capital away from safe-haven assets like precious metals. Conversely, a sharp downturn in equities, as seen with the Nasdaq 100 currently trading at 29164.86 with a significant daily loss, often fuels demand for safe havens, potentially offering some support to silver.
The current market environment presents a mixed correlation picture. While the DXY's strength is a bearish factor for XAGUSD, the performance of major indices like the S&P 500 and Nasdaq 100 adds complexity. The Nasdaq's decline suggests a potential increase in risk aversion, which theoretically should benefit silver. However, the dominant bearish technical signals across silver's own charts seem to be overshadowing this safe-haven correlation for now. Oil prices, currently seeing Brent at $83.79 and WTI at $79.59, are also relevant. Elevated oil prices can signal inflationary pressures, which traditionally supports precious metals. However, the current downward move in oil suggests a potential easing of inflation concerns, which could remove another supporting pillar for silver. This complex web of correlations means that traders need to monitor these external factors closely, as they could easily shift the balance of power.
Fundamental Drivers and Geopolitical Undercurrents
Beyond the charts, fundamental factors and geopolitical events are constantly shaping the landscape for XAGUSD. Heightened geopolitical tensions in the Middle East remain a persistent underlying risk, often leading to increased demand for safe-haven assets. However, the market's reaction seems muted recently, suggesting that current price levels may have already factored in some of these risks, or that other macro drivers are currently taking precedence. The recent news regarding oil prices climbing on Middle East escalation, yet markets resisting a full risk-off shift, exemplifies this nuanced environment. Investors appear hesitant to fully embrace safe havens unless the geopolitical situation deteriorates significantly.
Economic data releases also play a crucial role. While specific upcoming events weren't detailed in the provided data, any significant shifts in inflation reports (like the New Zealand CPI hitting 4.1%), central bank policy expectations (such as hawkish ECB expectations mentioned for EUR/USD), or employment figures can rapidly alter the market's risk sentiment and, consequently, the demand for silver. For instance, if inflation proves more persistent than expected, it could bolster the case for precious metals as an inflation hedge. Conversely, signs of cooling inflation or aggressive central bank tightening could dampen enthusiasm for non-yielding assets like silver. The current technical weakness in XAGUSD suggests that these fundamental factors, if bearish, are currently outweighing any potential safe-haven bids.
Scenario Analysis: Charting Potential Futures for XAGUSD
Bearish Scenario: Downside Continuation
65% ProbabilityNeutral Scenario: Consolidation Around $56.16
25% ProbabilityBullish Scenario: Support Holds, Reversal Attempt
10% ProbabilityFrequently Asked Questions: XAGUSD Analysis
What happens if XAGUSD breaks below the $55.97 support level?
A break below $55.97 would likely confirm the bearish trend, potentially leading to a test of the $55.68 support level. This would invalidate any short-term bullish divergence and reinforce the bears' control.
Is RSI at 37.11 a sell signal for XAGUSD right now?
An RSI of 37.11 on the 1-hour chart indicates bearish momentum rather than an immediate oversold condition. While it suggests room for further downside, traders should watch for confirmation from MACD and ADX before initiating a short position.
How will the rising DXY affect XAGUSD at current levels?
The current DXY level around 100.7 indicates a strengthening dollar, which typically puts pressure on silver prices. This correlation suggests that continued dollar strength could hinder any potential recovery for XAGUSD, reinforcing the bearish outlook around the $56.16 mark.
Should I consider buying XAGUSD if it holds $55.97 support?
Holding $55.97 support is a potential trigger for a bullish scenario, but it carries only a 10% probability based on current technicals. A buy order would require confirmation of a strong bullish reversal signal and a clear break above immediate resistance at $56.52.
Track markets in real-time
AI-powered analysis, technical indicators and real-time price data.
Join Our Telegram Channel
Breaking market news, AI analysis and trading signals instantly.
Join Channel