

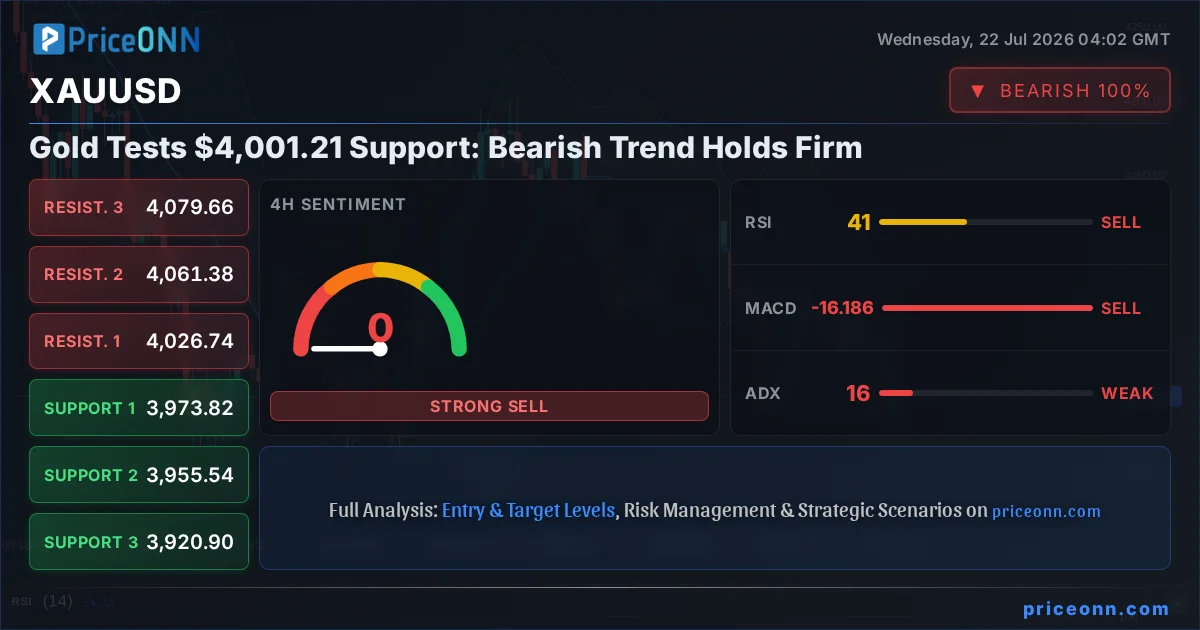
The gold market is at a critical juncture, with the precious metal currently trading around the $4,001.21 mark. This level represents a significant test for the bulls, as the broader technical picture suggests a persistent bearish trend is in play. Having seen a notable daily decline of -1.46%, gold is grappling with downside pressure, making the $4,001.21 support level a focal point for traders and analysts alike. The interplay between short-term consolidation signals and the overarching downtrend creates a complex trading environment, demanding careful observation of key technical indicators and market correlations to navigate potential price action.
- RSI at 37.81 on the 1H chart signals weakening momentum, but not yet oversold territory.
- The critical support level for XAUUSD is currently holding at $3,991.8, with a close below this potentially accelerating the bearish trend.
- MACD histogram is negative across 1H and 4H, indicating bearish momentum is dominant in the short to medium term.
- The strong correlation with a rising DXY (currently at 100.7) is exerting downward pressure on gold prices.
Navigating the Bearish Tide: XAUUSD's Current Predicament
The recent price action in XAUUSD paints a picture of a market under pressure. With the current price hovering at $4,001.21, a significant drop of -1.46% on the day, the bears appear to be firmly in control. This downward momentum is not an isolated event but rather a continuation of a broader bearish trend, particularly evident on the 4-hour and daily charts where trend strength is rated at 83% and 95% respectively. The inability of gold to sustain higher prices, as indicated by the daily range from $3,973.8 to $4,065.47, suggests a lack of buying conviction. Traders are closely watching the immediate support at $3,991.8. A decisive break below this level could trigger further liquidations, pushing the price towards the next significant floor at $3,976.78. The prevailing sentiment leans towards caution, with the general signal across multiple timeframes leaning towards 'SELL'. This makes any upward moves suspect, likely to be viewed as opportunities for short-sellers to enter or add to positions.
The correlation with the US Dollar Index (DXY), currently at 100.7, is a significant factor. As the DXY strengthens, it typically exerts downward pressure on gold, which is priced in dollars. This inverse relationship is a well-established market dynamic, and with the dollar showing signs of upward momentum, gold faces an uphill battle. The current technical readings further reinforce this bearish outlook. Across the 1-hour and 4-hour charts, the MACD indicator is painting a negative picture, sitting below its signal line, confirming bearish momentum. While the 1-day MACD shows positive momentum, it's crucial to note that this can often be a lagging indicator, and the shorter-term signals are currently more dominant in dictating immediate price action. The Bollinger Bands also support the bearish narrative, with prices trading below the middle band on all observed timeframes, indicating downward pressure.
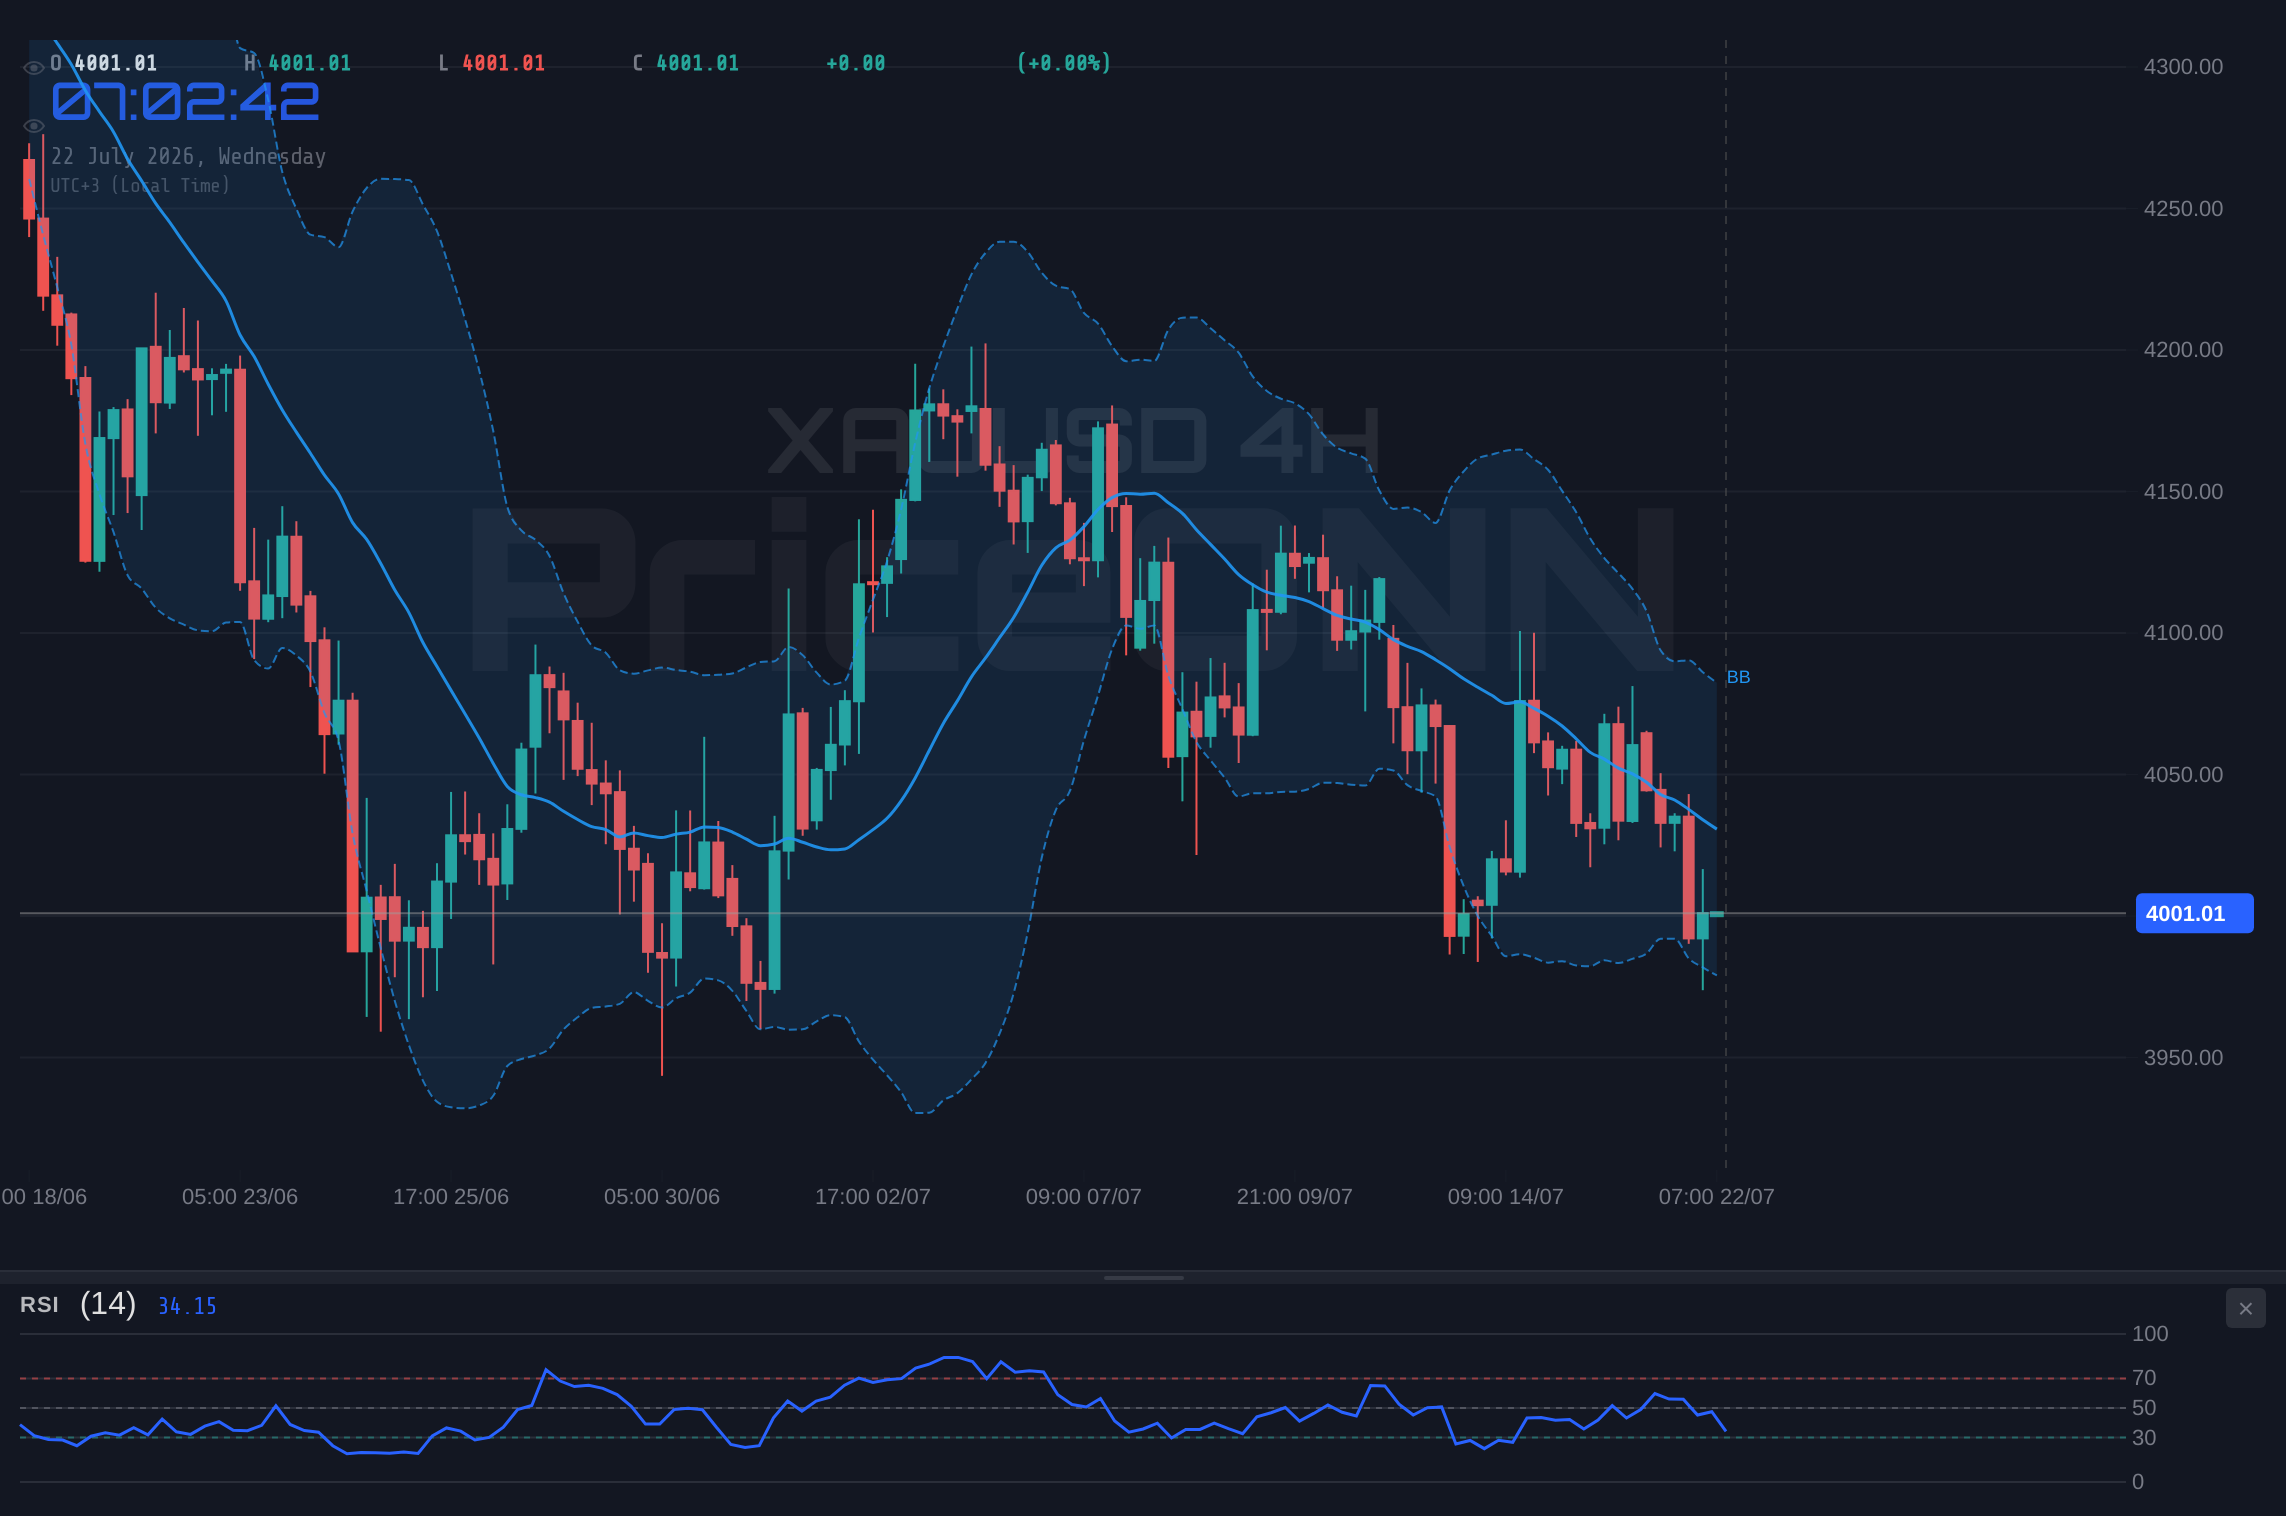
The $3,991.8 level is critical for XAUUSD in the short term. A sustained break below this support could accelerate the downward move, targeting $3,976.78 and potentially lower. Traders should monitor this level closely for signs of capitulation or a potential bounce.
The Bull Case: Searching for Cracks in the Bearish Facade
Despite the prevailing bearish sentiment, a closer look at the technical indicators reveals some potential cracks that could support a bullish reversal. On the 1-hour chart, the Stochastic Oscillator is flashing a potential buy signal with %K (40.52) crossing above %D (37.27). While this indicator is in the neutral zone and not signaling extreme oversold conditions, such divergences can sometimes precede a short-term bounce. Furthermore, the 1-day MACD indicator is showing positive momentum, suggesting that while shorter-term trends are down, the longer-term picture might still hold some bullish undercurrents. This conflict between short-term bearish signals and longer-term bullish momentum is what creates market tension and presents opportunities for discerning traders.
The RSI(14) readings across the timeframes, while generally pointing downwards, are mostly hovering in the neutral zone (37.81 on 1H, 40.59 on 4H, 38.86 on 1D). These levels are not yet indicative of extreme oversold conditions that would typically signal a strong reversal. However, they do suggest that the selling pressure might be losing some steam. If gold can find a solid footing around the $3,991.8 support and perhaps even test the $3,976.78 level without a significant breakdown, it could set the stage for a corrective rally. Such a rally would likely target the first resistance level at $4,019.21, followed by $4,031.6. For this bullish scenario to gain traction, we would need to see a clear break above these resistance levels, ideally accompanied by increasing volume and a shift in momentum indicators across multiple timeframes. The ADX, currently showing moderate to strong trend strength (20.26 on 1H, 15.79 on 4H, 39.16 on 1D), indicates that a sustained move would require significant commitment from buyers.
While the dominant trend is bearish, a bullish divergence on the Stochastic Oscillator (1H) and positive MACD momentum (1D) offer glimmers of hope for a short-term bounce. Confirmation above $4,019.21 resistance is key.
The Bear Case: Following the Trend Downwards
The bearish argument for XAUUSD is compelling, largely supported by the consistent technical data across multiple timeframes. The 4-hour and daily charts clearly indicate a downtrend, with trend strength indicators like ADX showing robust readings (15.79 on 4H, 39.16 on 1D). This suggests that the current downward move has significant momentum behind it. The fact that gold is trading below its middle Bollinger Band on all observed timeframes further solidifies the bearish outlook, indicating that the path of least resistance is currently downwards. The general 'SELL' signals aggregating across the 1H and 4H timeframes, with 7 out of 8 indicators pointing to a sell, underscore the dominance of bearish sentiment in the immediate trading horizons.
Key support levels are being tested, and a failure to hold them could lead to a cascading effect. The immediate support at $3,991.8 is critical. If this level gives way, the next targets are $3,976.78 and $3,964.39. The RSI, while not in oversold territory, is trending downwards, reflecting the selling pressure. A reading below 30 would typically signal oversold conditions, but the current levels around the high 30s suggest there is still room for prices to fall before finding significant buying interest. The MACD indicator on the 1-hour and 4-hour charts is below its signal line, confirming negative momentum. This suggests that downward price action is likely to continue in the short to medium term. The correlation with the strengthening DXY at 100.7 further bolsters the bear case, as a stronger dollar typically weighs on gold prices. The overall confluence of bearish indicators and trend strength makes the downside the more probable path in the absence of a significant bullish catalyst.
Technical Confluence: Where Do the Indicators Point?
Examining the technical indicators provides a nuanced view, but the overall weight leans towards caution. On the 1-hour chart, we see a mix: the Stochastic offers a potential buy signal, but RSI (37.81) and ADX (20.26) suggest further downside or at least a lack of strong upward momentum. The MACD is also bearish. The 4-hour chart presents a more uniformly bearish picture: RSI (40.59) is trending down, MACD is bearish, Stochastic is giving a sell signal, and ADX (15.79) indicates a weakening but still present downtrend. The daily chart, while showing positive MACD momentum, also has a bearish Stochastic signal and a strong ADX (39.16), indicating a powerful downtrend is in play. The general signal across these timeframes is predominantly 'SELL', with only a few conflicting signals that do not yet constitute a strong bullish case.
The ADX values are particularly telling. While the 4-hour ADX at 15.79 suggests a weaker trend, the daily ADX at 39.16 points to a strong existing downtrend. This divergence in trend strength across timeframes highlights the choppy nature of the current market, but the higher timeframe strength cannot be ignored. For a bullish reversal to gain credibility, we would need to see a clear break and hold above the resistance at $4,019.21, with confirming signals from RSI moving above 50 and MACD turning decisively positive across multiple charts. Conversely, a break below $3,991.8 would validate the bearish thesis and likely accelerate selling pressure, aligning with the strong daily trend.
The Verdict: Await Confirmation Above Key Resistance
The current technical landscape for XAUUSD presents a bearish bias, primarily driven by the sustained downtrend on higher timeframes and the strengthening US dollar. The price at $4,001.21 is teetering on a crucial support level ($3,991.8). While there are minor bullish divergences in some indicators like the 1-hour Stochastic and the daily MACD, these are not yet strong enough to override the prevailing bearish momentum. The market is currently exhibiting characteristics of a 'WATCH_ZONE' scenario, as indicated by the low ADX on the 4-hour chart and conflicting signals across different timeframes. This suggests that the market is consolidating before a potential move, and it is risky to take a strong directional stance without further confirmation.
A valid bullish setup would require a decisive close above the immediate resistance at $4,019.21 on at least the 4-hour timeframe. Such a move would invalidate the current bearish trend on shorter timeframes and could open the door for a test of higher levels, potentially towards $4,031.6. Confirmation would ideally come with increased trading volume and a shift in momentum indicators like the RSI moving above 50 and the MACD histogram turning positive. Until then, the risk remains skewed to the downside, with a break below $3,991.8 support likely to trigger further declines. Traders are advised to exercise patience and wait for a clear signal, rather than attempting to catch a falling knife or betting against a potentially re-energizing trend.
Bearish Continuation: Downside Risk Dominates
70% ProbabilityConsolidation and Indecision: The Waiting Game
20% ProbabilityBullish Reversal: A Glimmer of Hope
10% ProbabilityThe key is to observe the price action around the $3,991.8 support. A failure here could lead to a rapid decline, while holding it might set up a short-term corrective rally. Confirmation is paramount.
Frequently Asked Questions: XAUUSD Analysis
What happens if XAUUSD breaks below the $3,991.8 support level?
A decisive break below $3,991.8 would likely trigger further selling pressure, invalidating the short-term consolidation. This could lead to a rapid decline targeting the next support levels at $3,976.78 and potentially $3,964.39, aligning with the broader bearish trend.
Should I buy XAUUSD at current levels around $4,001.21 given the Stochastic divergence?
Buying at current levels is risky due to the dominant bearish trend and the proximity to support. While the 1H Stochastic shows a potential bounce signal, confirmation above $4,019.21 resistance is needed. Until then, the probability favors further downside or choppy price action.
Is the RSI at 37.81 a sell signal for XAUUSD?
An RSI of 37.81 on the 1H chart indicates bearish momentum but is not yet in oversold territory. It suggests selling pressure is present but not extreme. It aligns with the broader bearish trend, but a sustained move below 30 would be a stronger sell signal, while a move back above 50 could indicate a shift.
How will the rising DXY at 100.7 affect XAUUSD this week?
The rising DXY at 100.7 exerts downward pressure on XAUUSD due to their typical inverse correlation. This strengthens the bearish case for gold, making it harder for prices to rally unless there's a significant shift in market sentiment or a specific geopolitical event driving safe-haven demand for gold over the dollar.
| Indicator | Value | Signal | Interpretation |
|---|---|---|---|
| RSI (14) | 37.81 | Neutral | Weakening momentum, not oversold |
| MACD Histogram | -3.52 | Bearish | Negative momentum |
| Stochastic %K | 40.52 | Neutral | Potential divergence, but not extreme |
| ADX | 20.26 | Neutral | Moderate trend strength, could go either way |
| Bollinger Bands | Below Middle Band | Downward pressure indicated | |
Track markets in real-time
AI-powered analysis, technical indicators and real-time price data.
Join Our Telegram Channel
Breaking market news, AI analysis and trading signals instantly.
Join Channel