

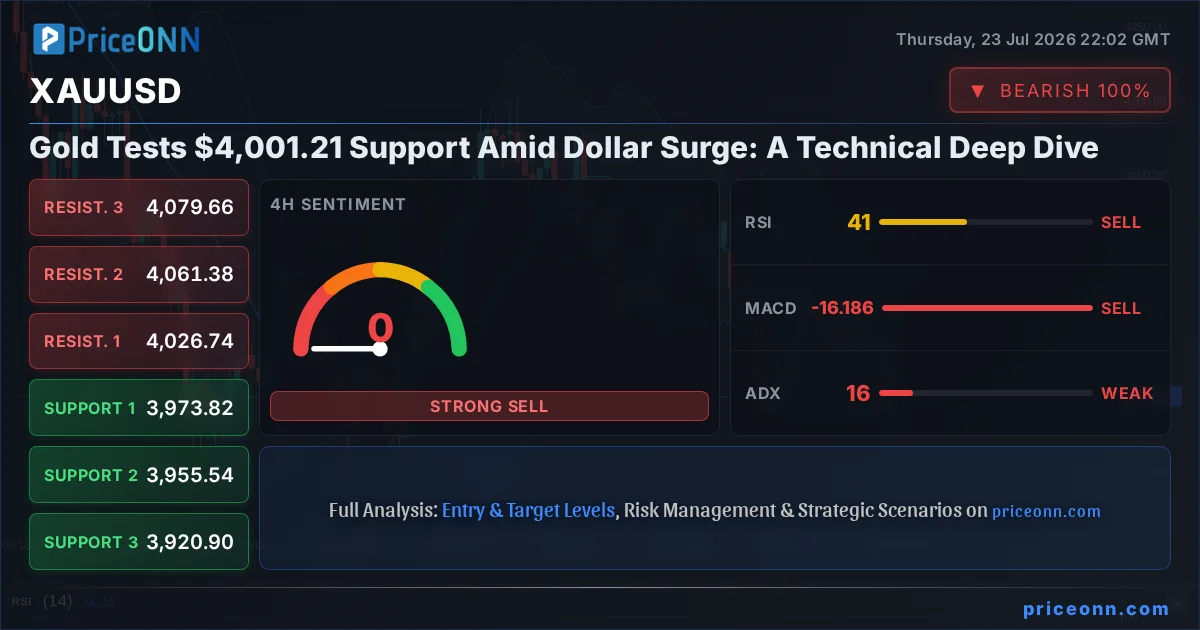
Gold just did something the bulls have been waiting months for – it's testing a significant support level at $4,001.21. But is this a buying opportunity, or just a pause before the next leg down? The current market environment, marked by a surging Dollar Index (DXY) and a complex interplay of inflation concerns and geopolitical tensions, paints a nuanced picture for the precious metal.
- RSI at 37.81 on the 1H chart signals waning bearish momentum, but the overall trend remains down.
- Critical support for XAUUSD sits at $3,991.8, tested intraday; a break below $3,976.78 could accelerate declines.
- The MACD histogram shows negative momentum, indicating selling pressure, while Stochastic offers a potential near-term bounce signal (%K > %D).
- The strong upward trend in the DXY (currently 100.7) is a major headwind for gold, pressuring prices amid rising Treasury yields.
The precious metal has been under considerable pressure, shedding 1.46% or $59.19 on the day, closing at $4,001.21. This decline is occurring despite ongoing geopolitical escalations in the Middle East, which typically bolster safe-haven demand for gold. The narrative seems to be dominated by a resurgent US dollar, fueled by expectations surrounding Federal Reserve policy and a repricing of risk assets across global markets. The divergence between gold’s traditional safe-haven status and its current price action underscores the complexity of today's trading landscape. Understanding this dynamic is paramount for any trader looking to navigate the gold market effectively.
The Dollar's Grip on Gold
The Dollar Index (DXY) has been on a tear, currently sitting at 100.7. This strength is a significant headwind for gold, as a stronger dollar typically makes dollar-denominated assets like gold more expensive for holders of other currencies, thereby reducing demand. The live API data shows the DXY has risen 0.21% today, indicating robust momentum. This correlation is not just theoretical; it's a primary driver of price action. When the dollar strengthens, as it is doing now, it often signals increased demand for dollar-denominated assets or a flight to safety within the US financial system, pulling capital away from commodities like gold. The market sentiment appears to be favoring the greenback, potentially due to sticky inflation data and hawkish undertones from central bankers, even as oil prices surge.
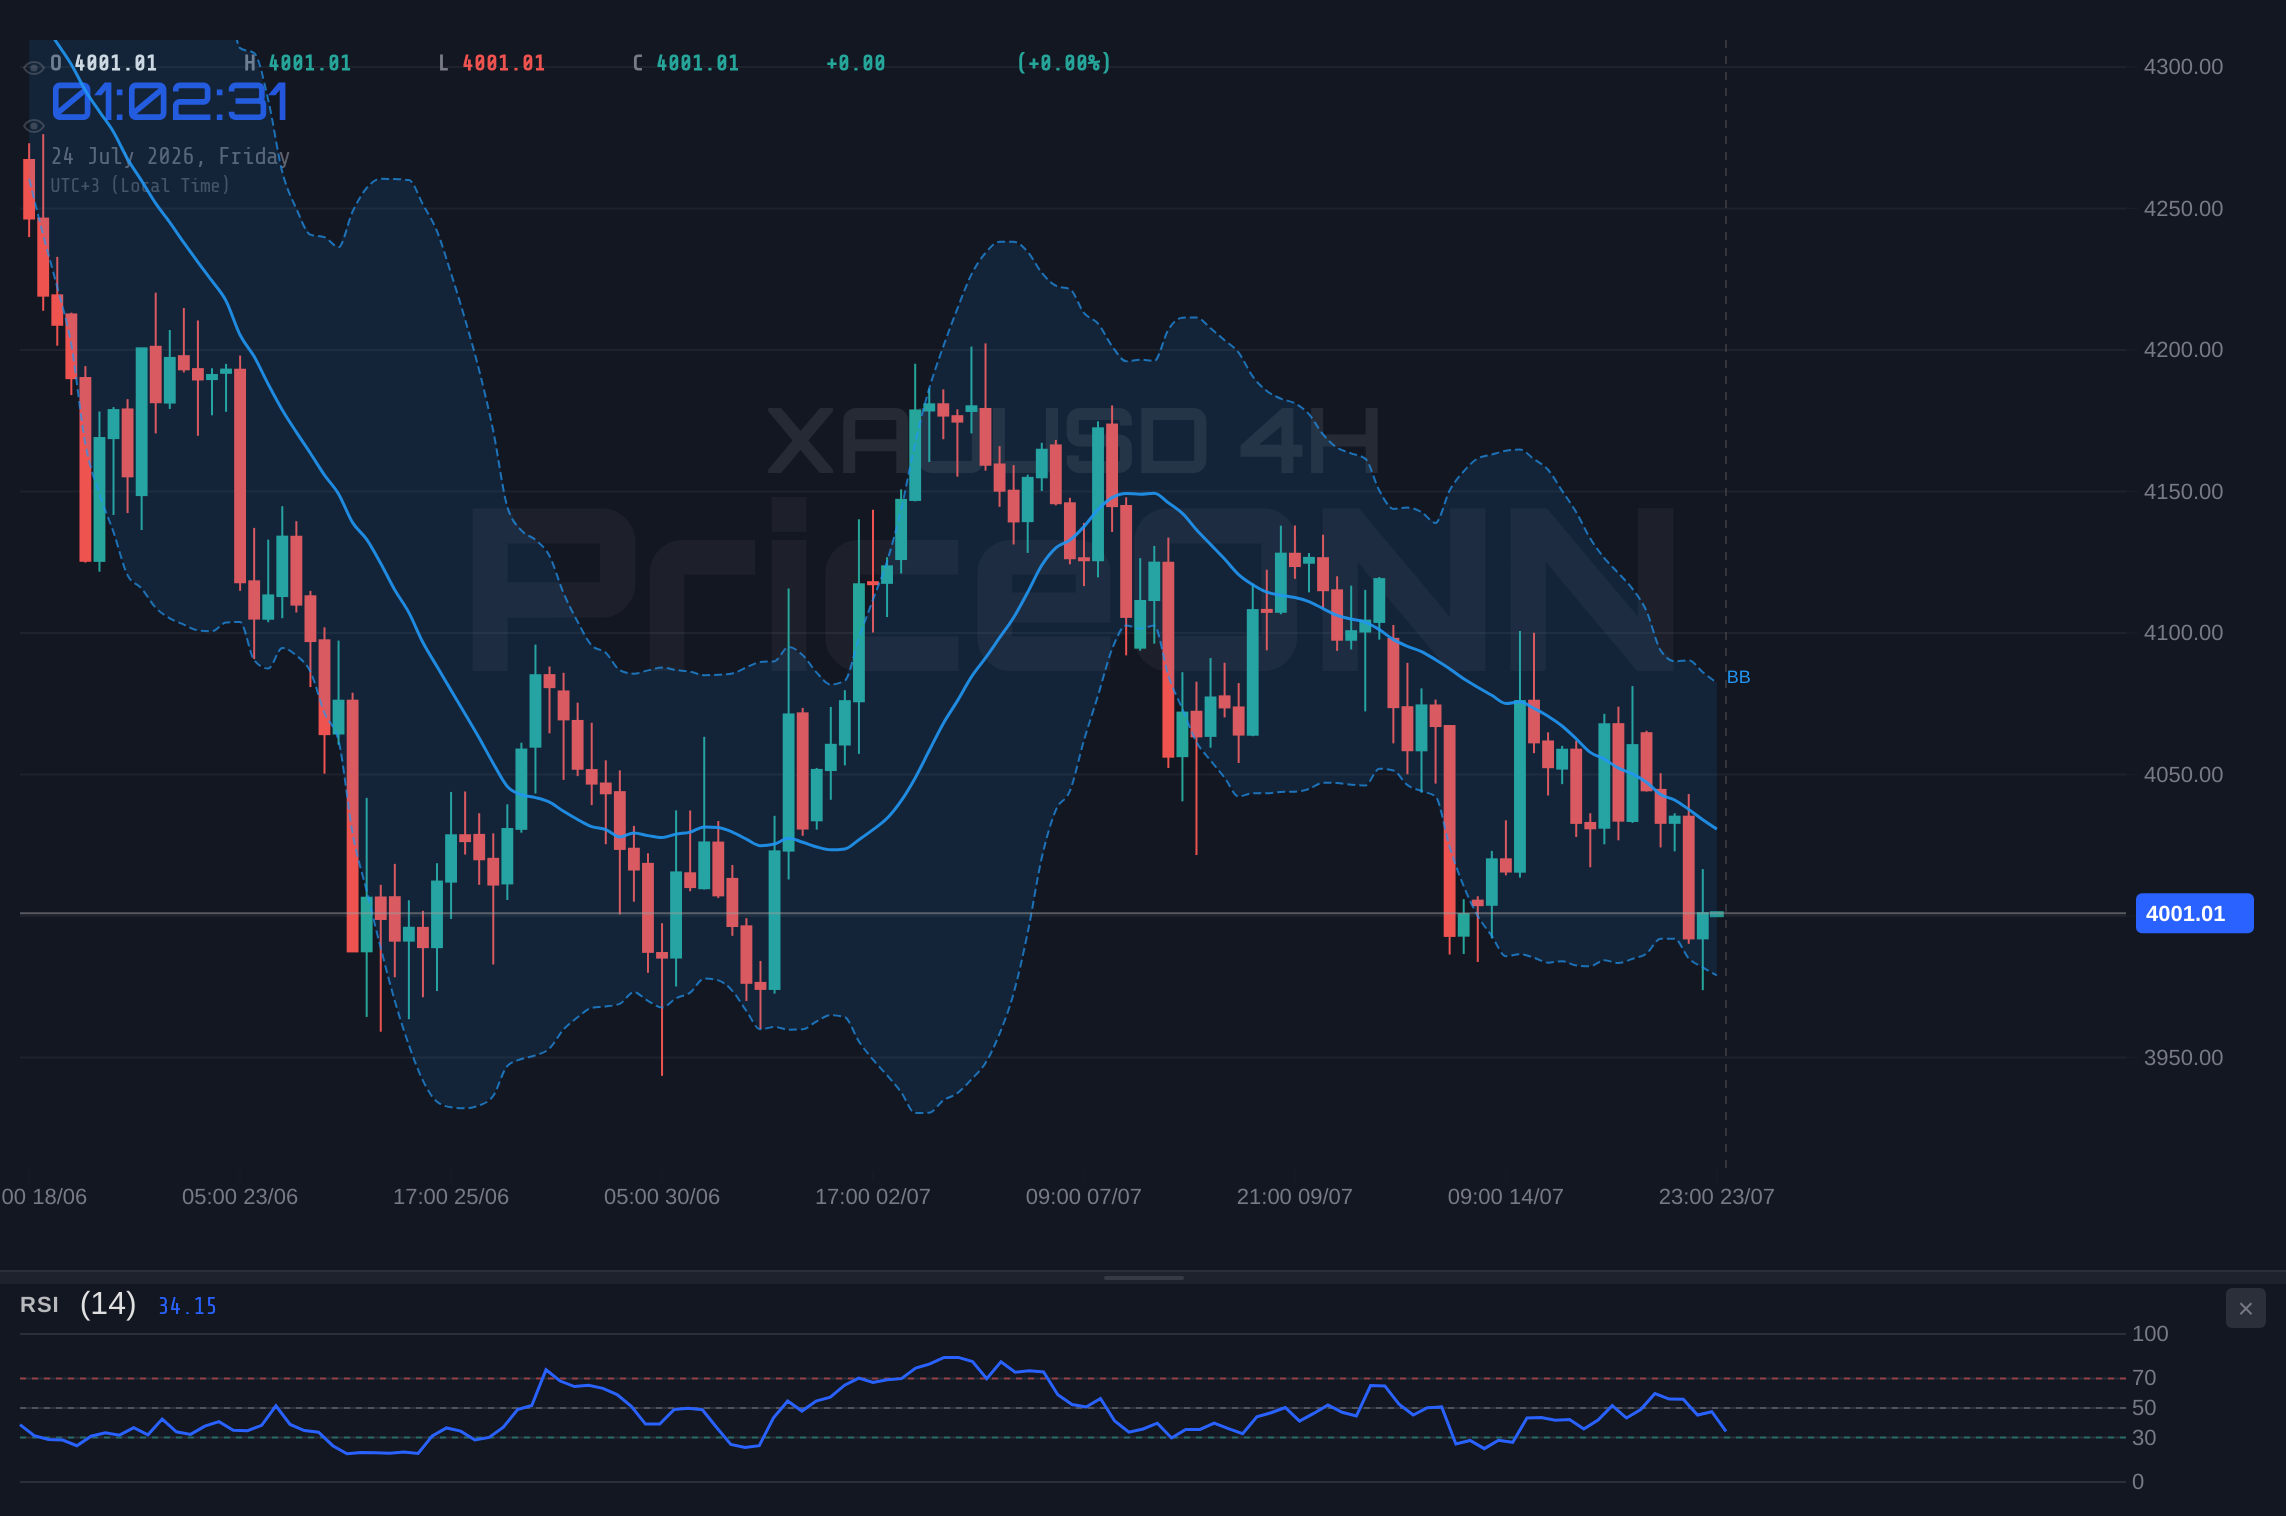
The DXY's ascent is putting pressure on multiple fronts. On the 1-hour chart, the DXY shows a neutral trend with 50% strength, but its RSI at 56.6 and Stochastic in the overbought region (K=86.15, D=82.01) suggest further upside potential. The 4-hour chart, however, presents a more cautious view with a neutral trend and RSI at 46.15, indicating a potential pause. Yet, the daily chart also points to a neutral trend, with RSI at 51.34. Despite these mixed signals across timeframes, the immediate upward pressure from the DXY above 100.7 is undeniable, creating a challenging environment for gold. This dollar strength is a key factor to watch as it directly impacts the purchasing power and attractiveness of gold on the global stage.
Technical Breakdown: XAUUSD's Current Stance
Looking at XAUUSD on the 1-hour chart, the trend is currently neutral with a strength of 50%. The immediate support level to watch is $3,991.8. If this level fails, the next significant support lies at $3,976.78, followed by $3,964.39. On the resistance side, $4,019.21 is the first hurdle, with $4,031.6 and $4,046.62 acting as further upside objectives. The RSI(14) is at 37.81, sitting in neutral territory but leaning towards a bearish sentiment, reflecting the recent price drop. However, the Stochastic oscillator provides a glimmer of hope for bulls, with %K at 40.52 crossing above %D at 37.27, suggesting a potential short-term upward correction.
The MACD indicator paints a bearish picture on the 1-hour chart, showing negative momentum with the MACD line below its signal line. This suggests that sellers are currently in control, at least in the short term. The Bollinger Bands are also positioned below the middle band, reinforcing the bearish bias. The ADX, a measure of trend strength, is at 20.26, indicating a moderately strong downtrend is in play. The overall signal for the 1H timeframe leans towards a 'SELL', with 7 sell signals against 1 buy signal. This confluence of indicators suggests that while a short-term bounce is possible, the overarching trend remains bearish, and any upward moves could be met with selling pressure.
On the 4-hour chart, the picture darkens further. The trend is firmly established as 'Downtrend' with a strength of 83%. Support levels are found at $3,973.82, $3,955.54, and $3,920.9. Resistance is capped at $4,026.74, $4,061.38, and $4,079.66. The RSI(14) is at 40.59, still in neutral territory but reinforcing the downward pressure. The MACD continues to show negative momentum, and the Stochastic oscillator (%K=18.51, %D=31.25) is in oversold territory with a clear bearish signal (%K
The daily chart provides the broadest perspective, and it confirms the dominant downtrend. The trend strength is at a formidable 95%. Key support levels are identified at $4,024.67 (which is being tested), $3,988.95, and $3,960.65. Resistance is formidable, with $4,088.69, $4,116.99, and $4,152.71 standing as significant barriers to any sustained recovery. The RSI(14) is holding at 38.86, reinforcing the bearish lean, while the MACD shows positive momentum, which is a divergence from the shorter timeframes. However, the Bollinger Bands remain below the middle band, and the Stochastic oscillator (%K=26.18, %D=44.73) offers a bearish signal. The ADX at 39.16 signifies a strong trend, and the overall signal is 'SAT' (7 sell, 1 buy). This daily view reinforces the idea that the current dip, while perhaps offering short-term trading opportunities, is part of a larger bearish structure.
Correlations and Macroeconomic Undercurrents
The strength in the DXY is not happening in a vacuum. It often correlates with rising Treasury yields, which increase the opportunity cost of holding non-yielding assets like gold. While specific yield data isn't provided, the general market trend of rising yields due to inflation concerns and central bank hawkishness is a well-documented phenomenon. The surge in oil prices, with Brent Crude nearing $100 and WTI at $79.59, adds another layer of complexity. Higher oil prices historically fuel inflation expectations, which can, in turn, support gold as an inflation hedge. However, the current market reaction suggests that the immediate driver is dollar strength and a broader repricing of risk, overshadowing gold's inflation-hedging properties for now.
Recent news highlights this tension. Reports indicate that oil is climbing on Middle East escalation, but markets are resisting a full risk-off shift. This suggests that while geopolitical risks are present, the dominant narrative is still dollar strength. The European Central Bank (ECB) holding rates steady, as reported, while watching energy shocks and inflation spillovers, adds to the global monetary policy uncertainty. For EURUSD, this meant a recovery as the dollar weakened slightly, but the overall trend for gold remains dictated by the DXY's strength. The fact that gold has defied higher oil and yields, as noted in some market commentary, suggests a potential regime shift or a temporary decoupling, but the immediate technicals and the DXY's dominance cannot be ignored.
The Path Forward: What Traders Should Watch
The current technical setup for XAUUSD presents a challenging environment. The daily trend strength of 95% in favor of a downtrend is a powerful signal. However, the 1-hour Stochastic is showing a potential bullish divergence, suggesting that a short-term bounce is possible. This creates a 'WATCH_ZONE' scenario, where caution is paramount. A valid setup for aggressive bulls would require more than just a Stochastic crossover. We need to see a clear break and hold above the immediate resistance at $4,019.21, ideally with increasing volume and a confirmation from other indicators like the RSI moving out of oversold territory and MACD showing signs of turning positive. Until then, any upside moves should be treated with skepticism.
For bears, the path seems clearer, but patience is still key. The immediate support at $3,991.8 is holding intraday, but the underlying trend is bearish. A decisive close below this level, followed by a test and failure at $3,976.78, would confirm the continuation of the downtrend. The ADX at 20.26 on the 1H chart indicates a trend is present, and the daily ADX at 39.16 points to a strong trend. The risk/reward for short positions improves significantly on a breakdown of the key support levels. The overarching message from the data is that while short-term fluctuations might occur, the primary trend remains down, and traders should be looking for confirmation before committing to either side.
Scenario Analysis and Trade Strategy
Given the current technical picture, the most probable scenario involves consolidation or a continued bearish trend, with a lower probability for a bullish reversal in the immediate term. The ADX readings across multiple timeframes (1H: 20.26, 4H: 15.79, 1D: 39.16) suggest a market that is either ranging or in a strong trend, but the mixed signals from oscillators like Stochastic and RSI create ambiguity. Therefore, a 'WATCH_ZONE' approach is the most prudent strategy right now.
Bearish Scenario: Trend Continuation
65% ProbabilityNeutral Scenario: Consolidation and Volatility
25% ProbabilityBullish Scenario: Short-Term Bounce
10% ProbabilityNavigating the Uncertainty
The interplay between a strong dollar, rising yields, and geopolitical risks creates a complex trading environment. While gold's traditional role as a safe haven might suggest resilience, the current technical indicators and the dominant trend suggest caution. The DXY's current level at 100.7, supported by positive momentum across multiple timeframes, presents a significant challenge. Traders must remain vigilant, respecting the current price action and waiting for clear signals before committing significant capital. The key is to manage risk effectively and wait for setups that offer a favorable risk/reward ratio.
Frequently Asked Questions: XAUUSD Analysis
What happens if XAUUSD breaks below the $3,991.8 support level?
A break below $3,991.8 would likely confirm the continuation of the bearish trend identified across multiple timeframes. The next key level to watch would be $3,976.78, and a failure to hold that could accelerate declines towards $3,964.39. This scenario is supported by the negative momentum on the MACD and the overall downtrend signal.
Should I consider buying XAUUSD at current levels around $4,001.21 given the Stochastic crossover?
While the 1-hour Stochastic showing %K above %D might suggest a short-term bounce, it's a low-probability scenario (10%) given the dominant bearish trend. A more prudent approach would be to wait for confirmation, such as a decisive close above $4,019.21, before considering any bullish positions. Chasing short-term signals against the prevailing trend carries significant risk.
Is the RSI at 37.81 a sell signal for XAUUSD right now?
An RSI reading of 37.81 on the 1-hour chart indicates a bearish lean but is not yet in oversold territory (typically below 30). While it reflects the recent selling pressure, it's the confluence of other bearish indicators like MACD and the overall downtrend on the daily chart that solidifies the bearish outlook. The RSI suggests room for further downside or consolidation before any potential reversal.
How will the strong DXY at 100.7 affect XAUUSD in the coming days?
The current DXY level of 100.7, with upward momentum indicated across timeframes, poses a significant challenge for gold. A strong dollar typically increases the cost of gold for foreign buyers and signals a preference for dollar-denominated assets, putting downward pressure on XAUUSD. Until the DXY shows clear signs of weakening, gold may struggle to find sustained upside momentum.
Track markets in real-time
AI-powered analysis, technical indicators and real-time price data.
Join Our Telegram Channel
Breaking market news, AI analysis and trading signals instantly.
Join Channel