

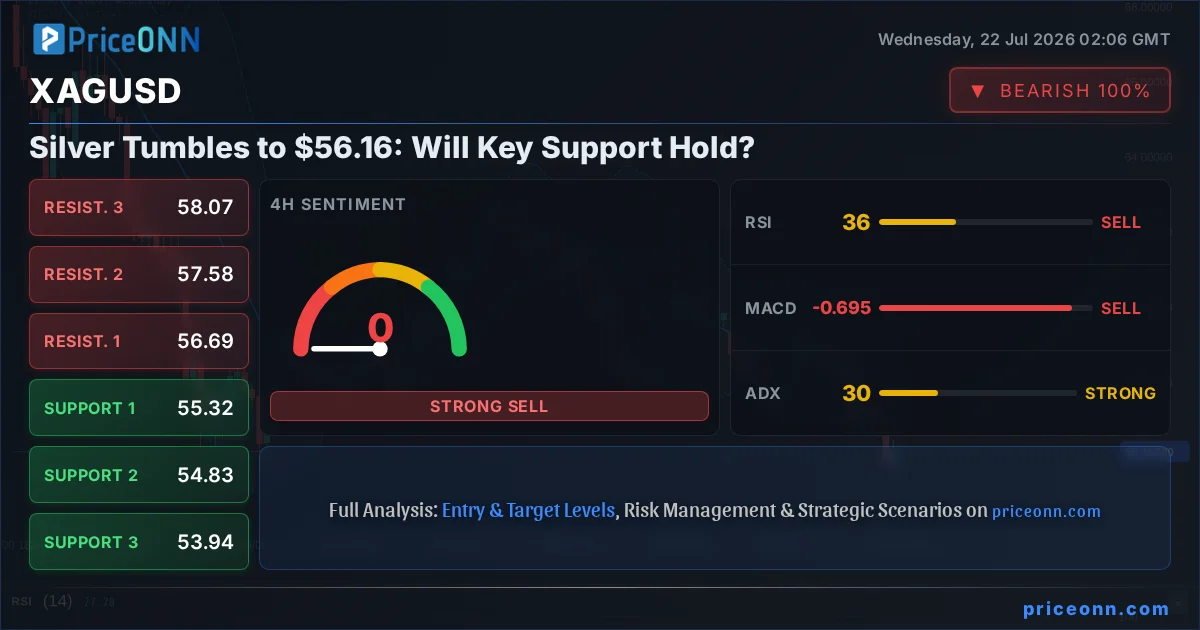
The narrative around silver has taken a sharp turn, and frankly, it’s a pivotal moment for traders watching this complex asset. Silver, currently priced at $56.16, is not just a metal; it’s a barometer of industrial demand, inflation expectations, and safe-haven flows. Today, we’re seeing a significant pullback, with the price testing crucial support levels. This isn't just noise; it's a clear signal that the market is reassessing its position, and understanding the forces at play is paramount for anyone with skin in the game.
- Silver’s RSI at 37.11 on the 1H chart signals waning bearish momentum, but the overall trend remains downward.
- The critical support level for XAGUSD sits at $55.97, a level that has seen significant price action historically.
- With the DXY index at 100.70 and trending upwards, a stronger dollar continues to exert downward pressure on silver prices.
- The Nasdaq 100's recent drop to 29164.86 indicates a risk-off sentiment, potentially increasing demand for safe-haven assets like gold, but silver seems to be bucking this trend for now.
The Dollar's Grip Tightens as Silver Faces Headwinds
The broader market context is crucial here. The US Dollar Index (DXY) is showing renewed strength, currently trading at 100.70 and trending upwards on multiple timeframes. This strength is a significant headwind for commodities priced in dollars, including silver. As the dollar strengthens, it becomes more expensive for holders of other currencies to buy dollar-denominated assets, typically leading to reduced demand. The DXY's upward trajectory, supported by positive momentum on the 1H and 4H charts, suggests that this pressure on silver is likely to persist in the short term. This inverse correlation is a well-understood dynamic in financial markets, and traders are keenly watching how this plays out. The current DXY level of 100.70 acts as a constant reminder of the greenback's influence, putting silver under the microscope as it navigates these challenging conditions.
Adding to the complex picture is the performance of major stock indices. The Nasdaq 100, a key indicator of risk appetite, has seen a notable decline, trading down to 29164.86. This move signals a shift towards risk-off sentiment in the broader market. Typically, such a sentiment benefits safe-haven assets like gold. However, silver’s behavior is more nuanced. While it can act as a store of value, its significant industrial component means it's also sensitive to economic growth prospects. A risk-off environment often correlates with a slowdown in industrial activity, which can dampen silver's appeal despite its safe-haven characteristics. This divergence in behavior between gold and silver, especially during periods of heightened market uncertainty, is something seasoned traders pay close attention to. The fact that silver is currently falling while gold might be showing resilience (as indicated by its price action which is also under pressure but within a different context) highlights its unique position in the market.
The relationship between silver and oil prices also warrants attention. Crude oil, currently at $83.79 for Brent and $79.59 for WTI, is experiencing its own set of pressures, with both benchmarks showing daily declines. Oil prices are often seen as a proxy for inflation expectations and global demand. A dip in oil prices could suggest weakening demand or a de-escalation of geopolitical tensions that were previously supporting energy costs. For silver, a decline in oil prices can be a double-edged sword. On one hand, lower energy costs might reduce production expenses for silver miners. On the other hand, it can reinforce the narrative of slowing global economic growth, which negatively impacts industrial metals like silver. The current downward trend in oil prices, coupled with silver's own decline, paints a picture of caution regarding global economic momentum. This interplay between energy markets and precious metals is a constant theme, and understanding these correlations is vital for a comprehensive market outlook.
Navigating Silver's Technical Landscape: A Deep Dive
Turning our focus to the charts, the technical picture for XAGUSD is decidedly bearish across multiple timeframes, though subtle signals hint at potential shifts. On the 1-hour chart, the trend is neutral with a power of 50%, but the overall signal leans towards 'SELL'. The RSI(14) is at 37.11, indicating that while the asset is not yet oversold, the selling pressure is significant. This RSI reading suggests there's room for further downside before a potential bounce, but it also means that any immediate upward momentum might be met with resistance.
The MACD indicator on the 1-hour chart confirms the bearish sentiment, showing negative momentum with the MACD line below its signal line. This is a classic sign of weakening price action. However, the Stochastic Oscillator offers a conflicting signal: K=43.73 and D=37.27, with %K > %D, suggesting a potential upward move or at least a pause in the selling. This divergence between MACD and Stochastic is common in choppy markets and highlights the need for caution. The ADX at 35.29 indicates a strong downtrend, reinforcing the bearish outlook on this shorter timeframe. The overall 'SELL' signal from the 1H timeframe indicators, despite the conflicting Stochastic, underscores the prevailing bearish sentiment.
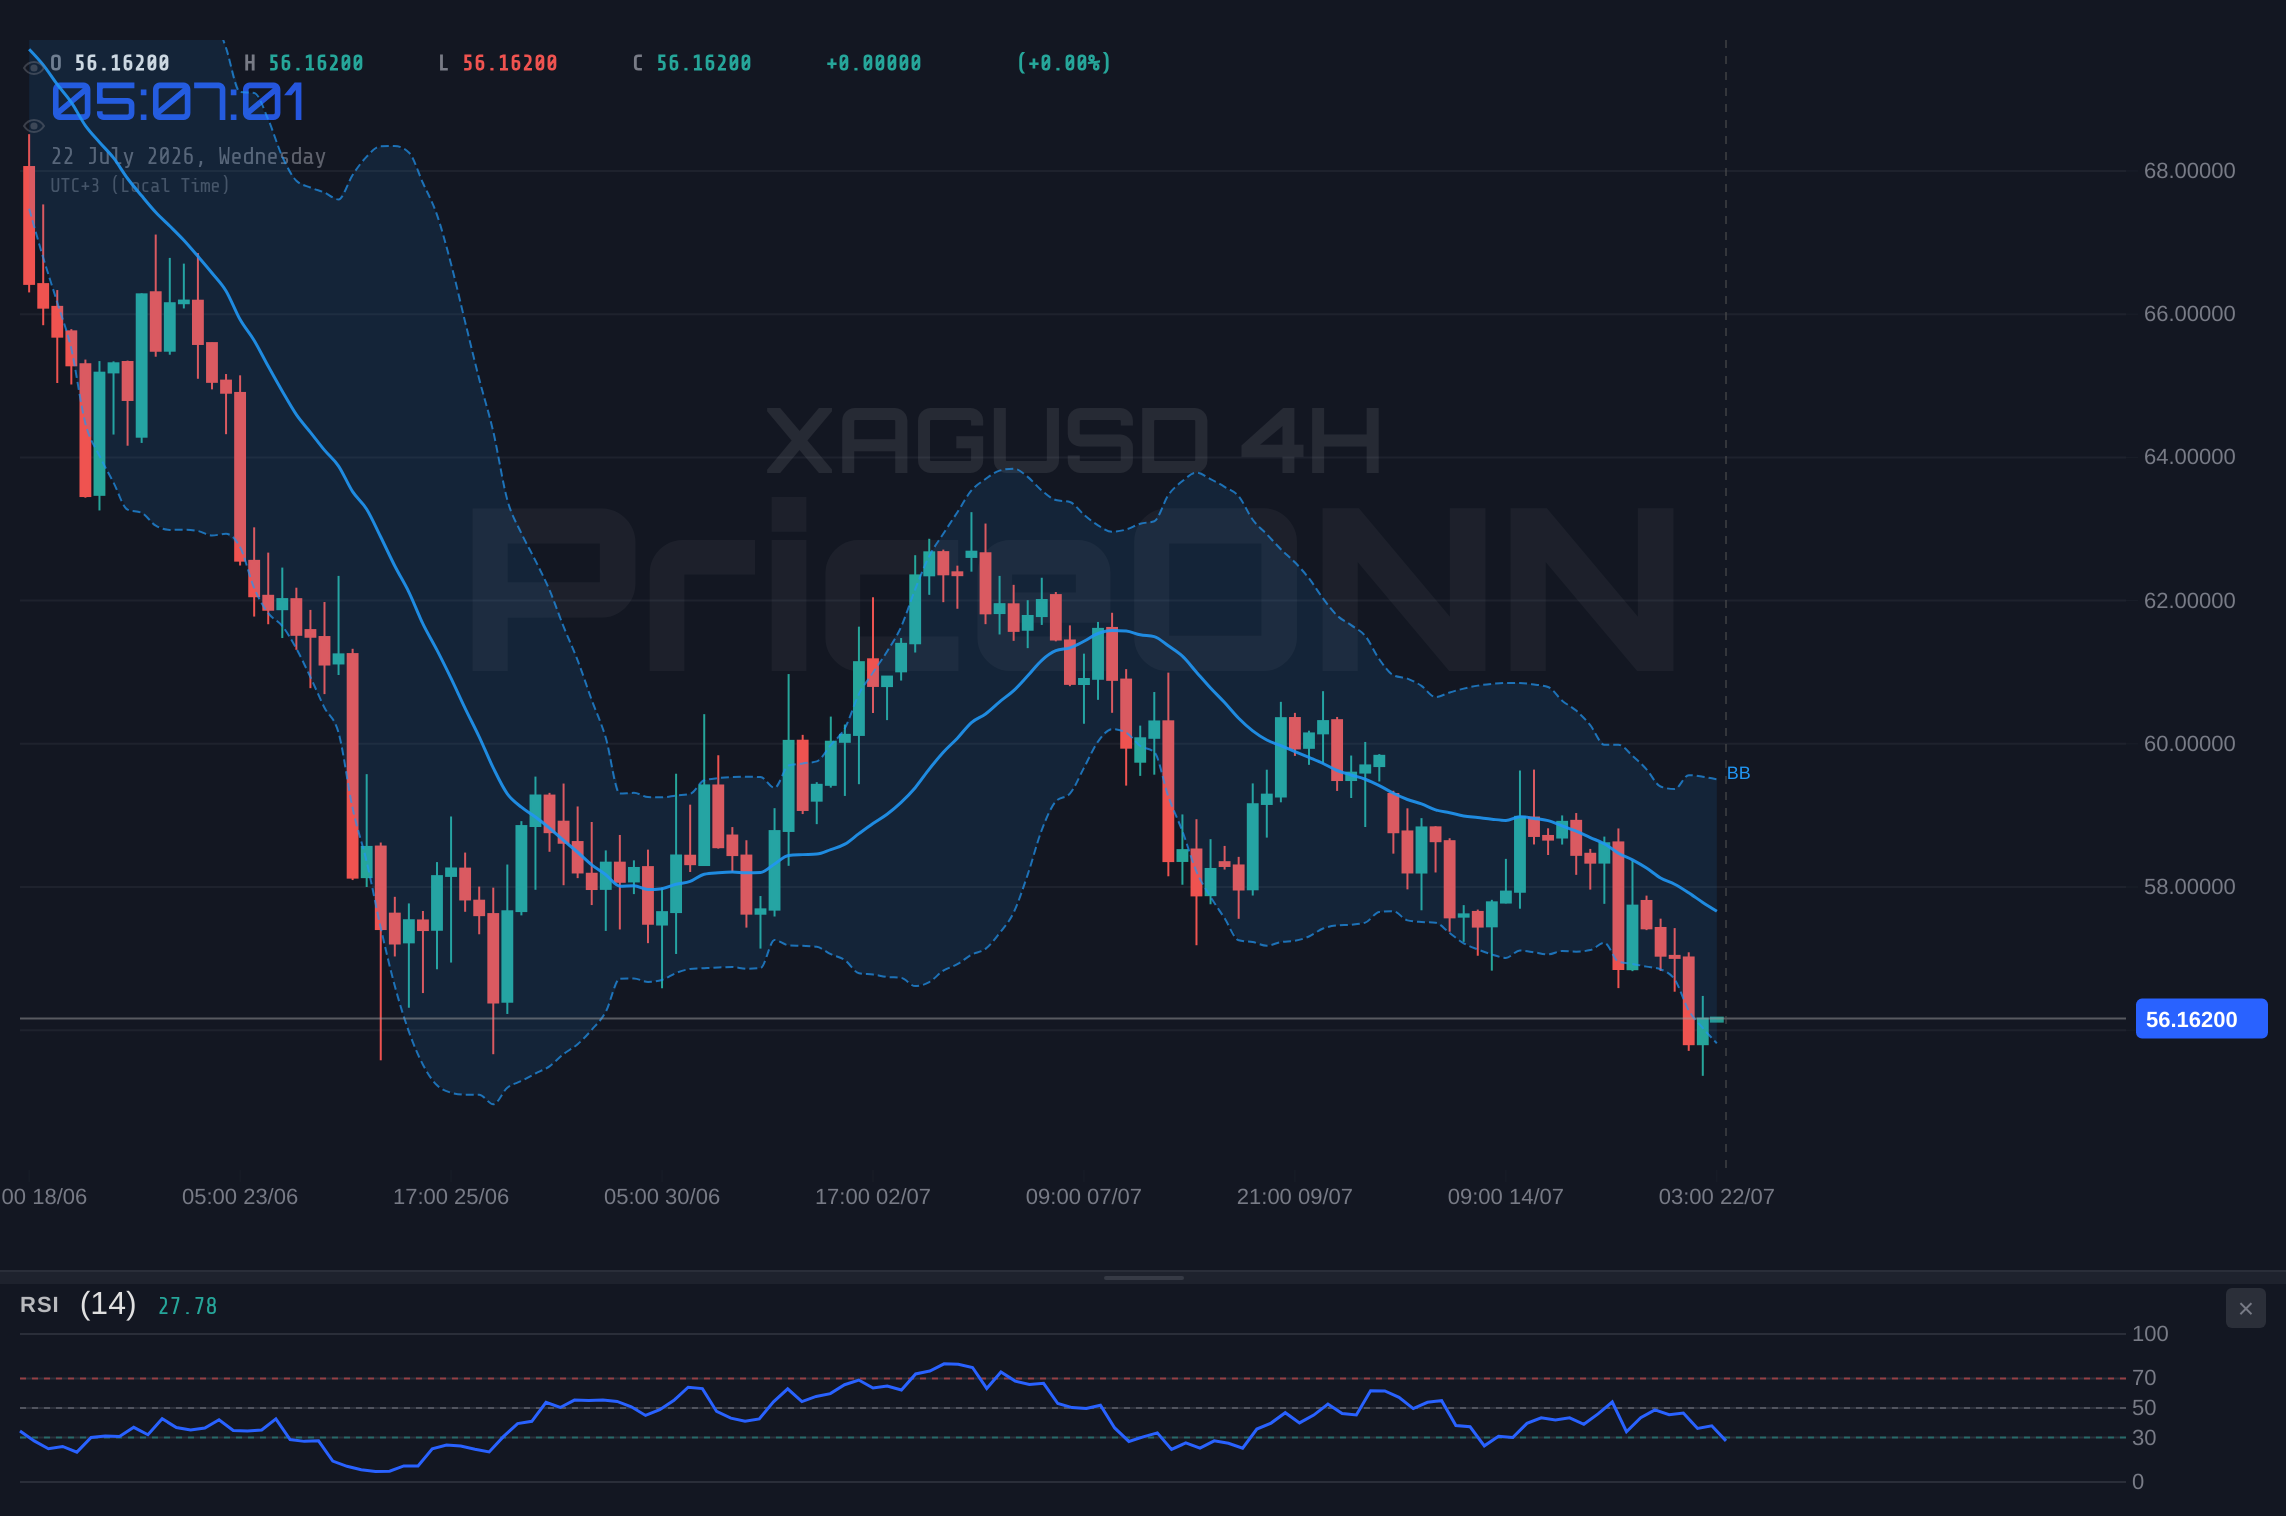
Stepping back to the 4-hour chart, the trend solidifies into a clear 'Downtrend' with a power of 83%. Here, the indicators paint a more uniformly bearish picture. The RSI(14) is at 40.59, still in neutral territory but trending downwards, aligning with the broader bearish sentiment. The MACD continues to show negative momentum, and the Stochastic Oscillator (K=18.51, D=31.25) is firmly in oversold territory with a clear 'SELL' signal (%K
The Bollinger Bands on the 4H chart are also positioned below the middle band, indicating a bearish bias. The ADX value of 15.79 suggests a weaker trend on this timeframe compared to the 1H, implying that the market might be consolidating or losing momentum for a sustained downtrend. However, the overwhelming 'SELL' signal across most indicators on this timeframe cannot be ignored. The key support level to watch on the 4H chart is 3973.82. A break below this could signal a further acceleration of the downtrend, targeting lower levels.
The daily timeframe provides the most robust view of the prevailing trend. Here, XAGUSD is in a strong 'Downtrend' with a power of 95%. The RSI(14) stands at 38.86, indicating a significant distance from overbought conditions and suggesting ample room for further price declines. The MACD on the daily chart, however, shows positive momentum with the MACD line above its signal line. This is a point of divergence from the shorter timeframes and could suggest that while the overall trend is down, there might be underlying buying interest emerging or a potential for a bounce. The Stochastic Oscillator (K=26.18, D=44.73) aligns with the bearish trend, providing a 'SELL' signal as %K is below %D.
The Bollinger Bands on the daily chart are trading below the middle band, confirming the bearish bias. The ADX value of 39.16 signifies a strong, established trend. This strong trend, combined with the daily RSI and Stochastic signals, points towards continued downward pressure. The support level at 4024.67 is critical on the daily chart. A decisive break below this level would likely confirm the continuation of the downtrend and open the door for further significant price depreciation. Despite the conflicting MACD signal on the daily chart, the overall technical confluence across multiple timeframes strongly suggests that the path of least resistance for silver remains to the downside in the immediate term.
The confluence of bearish technical signals and a strengthening US Dollar presents a significant risk for silver. Traders should exercise caution and implement strict risk management protocols. Upcoming economic data releases, particularly those related to inflation and central bank policy, could introduce volatility.
Market Corridors and Key Levels: Where the Battle Lines Are Drawn
The immediate battleground for silver is around the support level of $55.97 on the 1-hour chart. This is the first line of defense for the bulls. A decisive break below this level, supported by strong volume and continued weakness in the dollar, could accelerate the move towards the next support at $55.68. On the flip side, if silver manages to hold above $55.97, we could see a short-covering rally, potentially pushing the price back towards the resistance at $56.52. This level is significant as it represents the upper boundary of the current trading range on the 1H chart.
On the 4-hour chart, the crucial support is $55.32. A failure to hold this level would be a strong bearish signal, potentially leading to a sharp decline towards $54.83 and even $53.94. These lower support levels represent significant price floors where substantial buying interest has emerged in the past. Conversely, if the price can break decisively above the 4-hour resistance at $56.69, it would signal a potential shift in momentum, with the next resistance target at $57.58.
The daily timeframe offers a broader perspective on these levels. The immediate daily support is at $56.54, which is currently being tested. A close below this level would be a significant bearish development, paving the way for a test of $55.34 and potentially $54.10. These levels represent important historical price points where major trend shifts have occurred. On the resistance side, the daily level at $58.99 is the first significant hurdle for any potential recovery. A break above this, followed by a sustained move above $60.23, would be required to invalidate the current bearish outlook and signal a more substantial bullish reversal. The interplay between these support and resistance levels, viewed across different timeframes, dictates the short-to-medium term trajectory of silver prices.
Trade Scenarios: Mapping the Path Forward
Bearish Scenario: Downside Momentum Persists
65% ProbabilityNeutral Scenario: Consolidation Around Key Levels
25% ProbabilityBullish Scenario: Unexpected Reversal
10% ProbabilityThe Trader's Edge: What to Watch Now
The current market environment for silver is complex, characterized by a strong dollar, weakening risk appetite, and conflicting technical signals. The immediate focus remains on the $56.16 price level and the critical support at $55.97. A break below this support could trigger a more aggressive sell-off, aligning with the prevailing bearish sentiment on shorter timeframes. However, the divergence in signals, particularly the conflicting Stochastic and MACD readings on different charts, suggests that the market is not yet fully committed to a direction. Traders should be looking for confirmation: a decisive break of support with increasing volume, or a sustained move back above key resistance levels like $56.52.
For those who have been tracking silver’s price action, the current levels present a challenging but potentially rewarding environment. The ADX values across the charts, ranging from 15.79 on the 4H to 39.16 on the daily, indicate that while a strong trend is present on the daily, shorter timeframes show more muted trending behavior. This suggests that while the overall direction might be down, the immediate path could be choppy. Patience is key; waiting for a clear breakout or breakdown scenario, rather than trying to anticipate the move, will likely offer a better risk-reward ratio. Remember, the market always provides a second chance, and disciplined trading based on confirmed signals is the most reliable path to success.
Frequently Asked Questions: XAGUSD Analysis
What happens if XAGUSD breaks below the $55.97 support level?
A break below $55.97 would invalidate the neutral scenario and likely trigger a bearish move, targeting $55.68 and potentially $55.32 on the 4-hour chart. This would confirm the downtrend indicated by daily ADX at 39.16.
Should I buy XAGUSD at $56.16 levels given the conflicting Stochastic and MACD signals?
Buying at current levels is speculative given the bearish overall trend and the DXY strength. A more prudent approach would be to wait for a clear signal, such as a confirmed bounce from $55.97 support or a decisive break above $56.52 resistance, with probabilities favoring the downside currently.
Is the RSI at 37.11 a sell signal for XAGUSD on the 1H chart?
An RSI of 37.11 is not technically 'oversold' but indicates significant selling pressure. While it suggests room for further downside before a potential bounce, it's not a direct sell signal itself. It aligns with the bearish momentum confirmed by the MACD.
How will the strong DXY at 100.70 affect XAGUSD this week?
The rising DXY exerts consistent downward pressure on silver, making it more expensive for non-dollar buyers. This macro factor reinforces the bearish technical outlook for XAGUSD and limits potential upside rallies until the dollar trend reverses.
| Indicator | Value | Signal | Interpretation |
|---|---|---|---|
| RSI (14) | 37.11 | Bearish | Neutral zone, falling |
| MACD Histogram | -0.25 | Bearish | Negative momentum |
| Stochastic | K:43.73, D:37.27 | Bullish Divergence | %K > %D, potential bounce |
| ADX | 35.29 | Strong Trend | Strong downtrend (1H) |
| Bollinger Bands | Middle Band | Bearish Bias | Below mid-band |
Key Levels
Track markets in real-time
AI-powered analysis, technical indicators and real-time price data.
Join Our Telegram Channel
Breaking market news, AI analysis and trading signals instantly.
Join Channel