

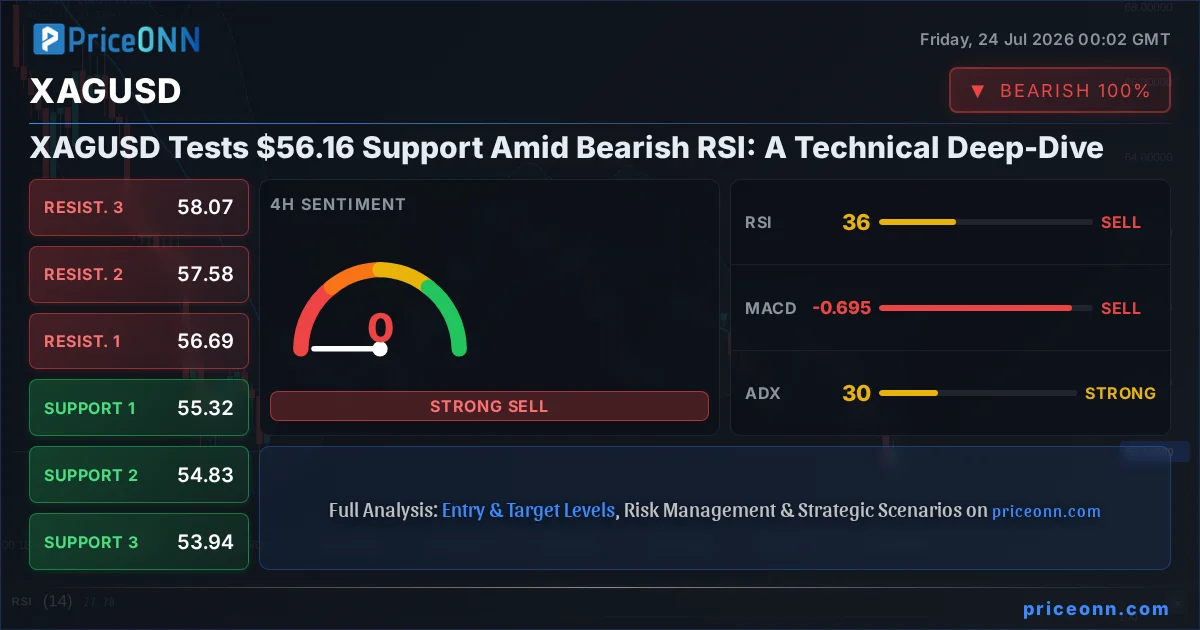
Silver, or XAGUSD, is currently navigating a critical juncture, trading at precisely $56.16. This price point is not just a number; it represents a confluence of technical signals and market sentiment that demands close examination. The recent downward pressure, underscored by a daily change of -2.73%, has brought the precious metal to a crucial support level. But is this a mere pause before the next leg up, or the beginning of a more significant downturn? This deep-dive analysis aims to unravel the complexities of the XAGUSD chart, dissecting indicator readings, price action, and market correlations to paint a clear picture for traders and investors navigating these choppy waters. Understanding the interplay between the current price, historical support, and future resistance is paramount in formulating a robust trading strategy.
- XAGUSD is testing support at $56.16 with a bearish RSI reading of 37.11 on the 1-hour chart, indicating potential for further downside.
- The 1-hour trend is strongly bearish (93% strength), with key support at $55.97 and resistance at $56.52.
- The 4-hour chart also shows a dominant downtrend (100% strength), with support at $55.32 and resistance at $56.69, though Stochastic is showing a bullish crossover.
- The daily chart confirms a strong downtrend (100% strength) with support at $56.54 and resistance at $58.99, but MACD shows positive momentum.
- The Dollar Index (DXY) is currently at 100.7, showing mixed signals across timeframes, which can influence silver's direction.
The immediate 1-hour timeframe presents a stark picture for XAGUSD. A strong bearish trend, with a power rating of 93%, dominates this short-term outlook. The current price of $56.16 is teetering precariously close to the first support level at $55.97. The RSI(14) reading of 37.11, while in the neutral zone, clearly leans towards bearish sentiment, suggesting that sellers have the upper hand in this immediate timeframe. Furthermore, the MACD indicator is painting a bearish picture, with its histogram firmly in negative territory and the MACD line sitting below the signal line. This indicates negative momentum is building. Adding to the bearish narrative, the Bollinger Bands show the price trading below the middle band, a classic sign of downward pressure. However, a glimmer of hope for the bulls emerges from the Stochastic oscillator, which shows a bullish crossover (%K at 43.73 crossing above %D at 25.17). This divergence, while currently outnumbered by bearish signals, suggests that the selling pressure might be nearing exhaustion in the very short term, potentially leading to a minor bounce or consolidation before the next directional move is confirmed. The ADX at 35.29 confirms a strong trend, but its directionality is key.
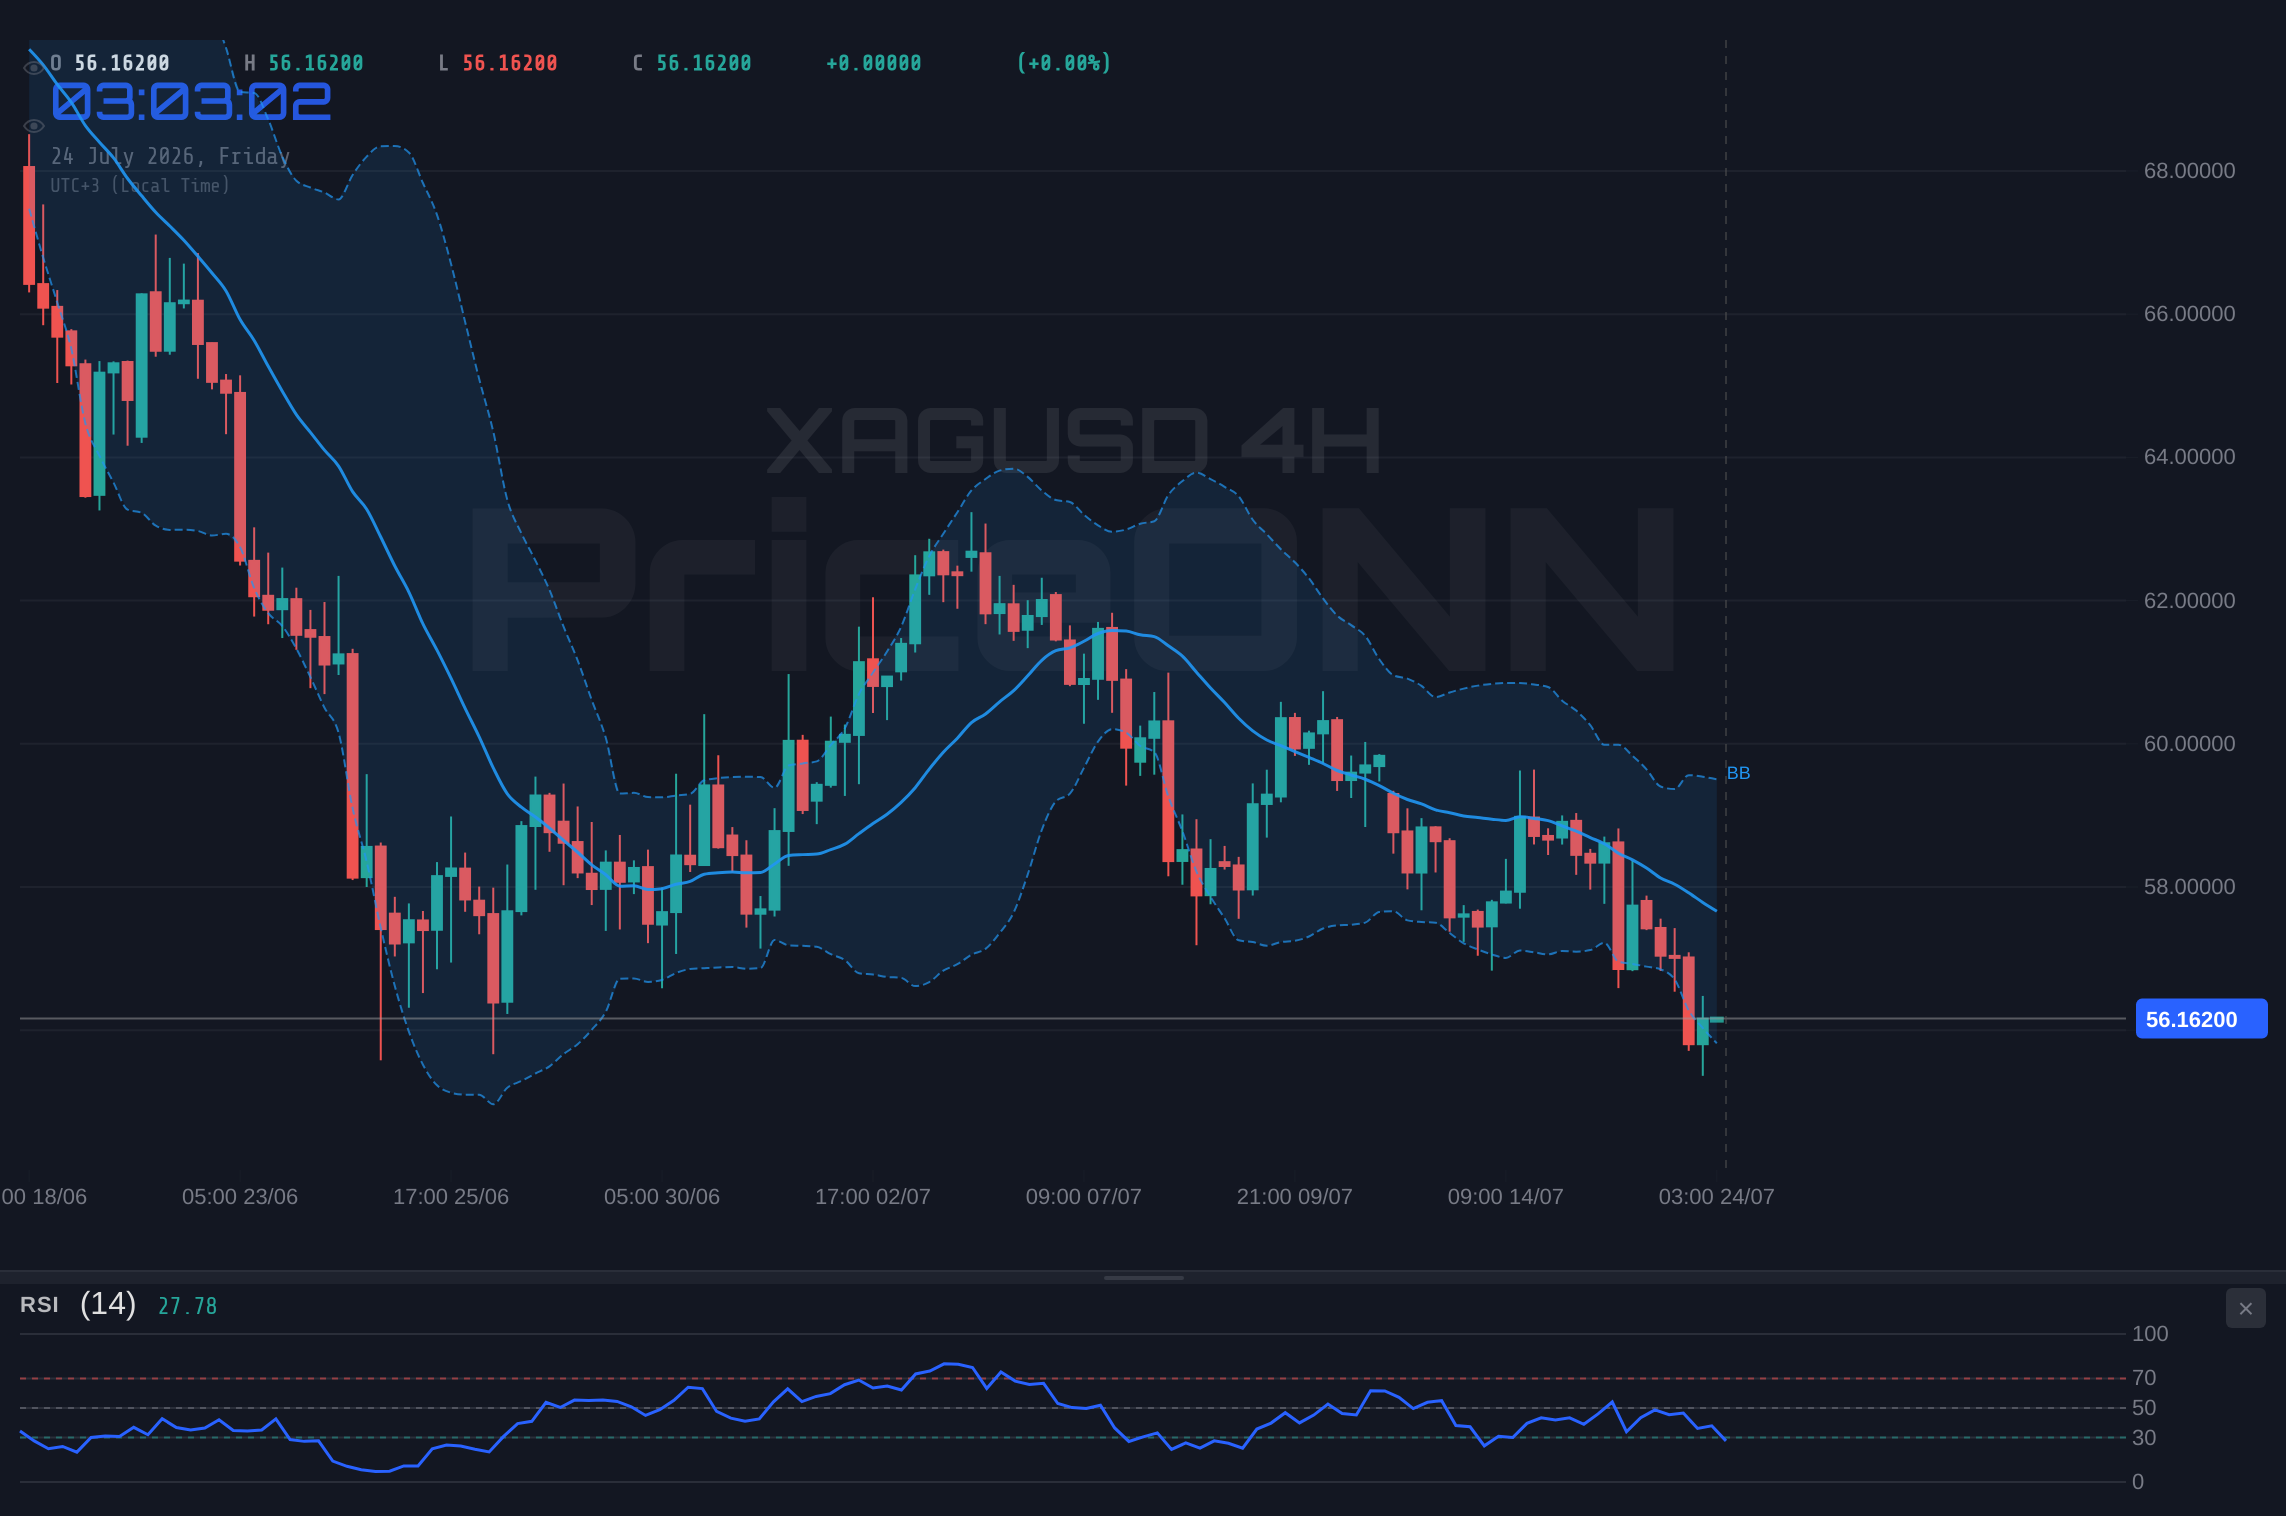
Delving deeper into the 4-hour chart reveals a more entrenched bearish sentiment for XAGUSD. Here, the trend strength is at a maximum 100%, indicating a dominant downtrend. The current price of $56.16 finds itself above the immediate support at $55.97 but well within the range of the next significant support at $55.32. Resistance is eyed at $56.69, a level that must be broken for any bullish thesis to gain traction. The RSI(14) on this timeframe is at 35.87, reinforcing the bearish leanings, though it's still some distance from oversold territory. The MACD continues its negative momentum, with the MACD line below the signal line, further cementing the prevailing downtrend. Bollinger Bands also confirm this, hugging the lower side of the middle band. Interestingly, the Stochastic oscillator here presents a contrasting signal: %K at 14.97 is below %D at 23.19, indicating a bearish signal that aligns with the overall trend. However, the ADX value of 29.63, while indicating a strong trend, is lower than the 1-hour reading, suggesting the trend's conviction might be slightly waning on this timeframe, or at least consolidating its strength. This mixed signal from Stochastic, against a backdrop of strong bearish indicators, warrants careful observation.
The Daily Grind: Long-Term Trend and Conflicting Signals
Shifting focus to the daily chart, the picture for XAGUSD becomes more complex, presenting a potential battleground for bulls and bears. The trend here is also decidedly bearish, holding a 100% strength rating. The current price of $56.16 is positioned between the first daily support at $56.54 and the next significant level at $55.34. Resistance is firmly placed overhead, with the initial hurdle at $58.99. The RSI(14) at 34.24 continues the bearish narrative, indicating significant room before entering oversold territory, implying further downside potential is not ruled out. However, a notable divergence appears with the MACD. On the daily timeframe, the MACD histogram is positive, and the MACD line is above the signal line, suggesting positive momentum is building. This is a stark contrast to the shorter timeframes and could signal a potential shift in underlying strength, or at least indicate that the current bearish momentum might be losing steam on a longer-term perspective. The Bollinger Bands remain below the middle band, aligning with the overall bearish trend. The Stochastic oscillator, with %K at 18.69 and %D at 32.03, provides a bearish signal, reinforcing the short-term downtrend. Yet, the ADX at 42.27 highlights a very strong trend, which, combined with the positive MACD momentum, creates a scenario of conflicting signals that traders must navigate with extreme caution. This strong daily trend, despite the positive MACD, suggests that any bullish recovery would need significant force to overcome.
The interplay between XAGUSD and its correlated assets provides crucial context. The Dollar Index (DXY), currently at 100.7, is exhibiting mixed signals across timeframes. On the 1-hour chart, the DXY shows a bullish trend with RSI at 56.6 and Stochastic in the overbought zone, suggesting potential dollar strength. Conversely, the 4-hour chart displays a neutral trend with RSI at 46.15, and the daily chart also shows a neutral trend with RSI at 51.34. This mixed DXY picture can translate into volatility for silver, as a strengthening dollar typically exerts downward pressure on dollar-denominated commodities like gold and silver. However, the recent news flow, particularly the surge in Brent crude prices nearing $100 and the resulting inflation risks, adds another layer of complexity. Higher oil prices often correlate with higher inflation expectations, which historically can boost demand for precious metals like silver as an inflation hedge. The ECB's recent decision to hold rates unchanged, while closely watching energy shocks and inflation spillovers, adds to the uncertainty in the broader market. This confluence of a mixed dollar, rising energy prices, and central bank caution creates a complex environment where silver's price action is influenced by multiple, sometimes opposing, forces.
Navigating the Levels: Support, Resistance, and the Path Forward
The critical support levels for XAGUSD on the 1-hour chart are $55.97, $55.68, and $55.42. A decisive break below $55.97 would confirm the immediate bearish bias and could accelerate a move towards $55.68. On the other hand, resistance lies at $56.52, $56.77, and $57.06. For any bullish reversal to gain credibility, XAGUSD must convincingly break and hold above the $56.52 resistance level. The 4-hour chart presents more substantial support at $55.32, $54.83, and $53.94. The resistance levels here are $56.69, $57.58, and $58.07. A break below the $55.32 support on this timeframe would signal a deeper correction. The daily chart offers significant psychological and technical barriers. Support is found at $56.54 (acting as immediate resistance on the 1H chart), $55.34, and $54.10. Resistance looms at $58.99, a level that, if breached, could signal a more substantial bullish turnaround, followed by $60.23 and $61.43. The current price of $56.16 sits in a precarious position, with the immediate 1-hour resistance at $56.52 acting as the first line of defense for the bears and the first hurdle for the bulls.
The prevailing technical indicators paint a predominantly bearish picture on shorter timeframes, but the longer-term daily chart introduces elements of potential conflict. The 1-hour and 4-hour charts are heavily skewed towards selling, with strong downtrend signals from ADX, bearish RSI readings, and negative MACD momentum. However, the daily MACD showing positive momentum and the Stochastic oscillator on the 1-hour chart exhibiting a bullish crossover cannot be entirely ignored. This suggests that while the immediate pressure is downwards, there might be underlying strength building that could challenge the bears. The ADX values across timeframes (35.29 on 1H, 29.63 on 4H, and 42.27 on 1D) indicate strong trending conditions overall, but the nuances between these readings are important. The high ADX on the daily chart, coupled with positive MACD, suggests a strong trend that is perhaps facing internal conflict or a potential shift. This is the kind of environment where price action around key levels becomes paramount.
Considering the trade recommendation of a "FULL_TRADE_PLAN" with a 5/8 score, the analysis leans towards a bearish bias, given the dominant downtrend signals across multiple timeframes, particularly the 100% strength on the 4-hour and daily charts. The ADX readings confirm strong trending conditions, making the current price action highly significant. The conflict between the short-term bearish indicators and the longer-term positive MACD momentum on the daily chart suggests that the market is at a critical juncture. The $56.16 price level is pivotal. A failure to hold above this or a decisive break below immediate support at $55.97 would validate the bearish outlook. Conversely, a strong push above the $56.52 resistance, especially on increasing volume and positive confirmation from other indicators, could signal a shift. The current stochastic divergence on the 1-hour chart is the most immediate sign of potential short-term reversal, but it needs to be confirmed by price action and other indicators.
Bearish Scenario: Downside Continuation
65% ProbabilityNeutral Scenario: Consolidation Around $56.16
25% ProbabilityBullish Scenario: Reversal Attempt
10% ProbabilityThe geopolitical landscape, particularly the escalation in the Middle East and rising oil prices, continues to inject volatility into the markets. While rising oil prices can sometimes boost precious metals as an inflation hedge, the current dominant trend in XAGUSD appears driven more by technical factors and broader risk sentiment, influenced by the mixed signals from the DXY. The European Central Bank's recent decision to hold rates steady, while acknowledging inflation risks from energy prices, adds to the cautious market tone. Traders are likely weighing the potential for inflation to drive safe-haven demand against the possibility of broader market deleveraging if yields continue to climb aggressively. This complex interplay means that while $56.16 is a key level, the underlying macro drivers could override purely technical signals. The market sentiment appears to be leaning bearish for silver currently, but the potential for a shift remains, especially if inflation concerns escalate further.
Looking at the broader market context, the S&P 500 (SP500) is showing a mixed picture, with a strong 1H trend but a bearish daily trend. Similarly, the Nasdaq 100 (Nasdaq) is exhibiting weakness, particularly on the daily timeframe, suggesting a potential risk-off sentiment that could, in theory, benefit safe-haven assets like silver. However, the current correlation seems to favor a risk-on environment for silver to truly rally, or a scenario where inflation fears dominate. The strong daily trend in XAGUSD, despite the conflicting MACD signal, suggests that the prevailing momentum is powerful. Any attempt at a sustained rally would need to overcome significant overhead resistance, starting with the $56.52 level on the 1-hour chart and extending to $58.99 on the daily chart. The current price action around $56.16 is critical; a failure to hold this level could see a rapid slide towards the next significant support zones, validating the bearish sentiment seen across multiple timeframes.
From a trading perspective, the current setup on XAGUSD warrants a cautious approach. The dominant bearish trend on the 4-hour and daily charts, coupled with the bearish RSI readings, suggests that selling rallies might be the favored strategy for short-term traders. However, the conflicting signals from the daily MACD and the 1-hour Stochastic necessitate vigilance. A break below $55.97 would be the primary signal to enter short positions, targeting $55.68 and potentially $55.42. Confirmation would come from sustained selling pressure and a breakdown of the 1-hour bullish Stochastic divergence. Conversely, a strong close above $56.52, ideally with increasing volume and positive MACD confirmation on the 1-hour chart, could signal a short-covering rally, targeting $56.77 and $57.06. For longer-term investors, the current levels might present an opportunity to watch for signs of a bottoming pattern, but the overwhelming bearish trend suggests patience is key. The high ADX values across timeframes indicate that the trend, once established, is likely to be strong, making decisive breaks crucial.
The technical indicators are flashing warning signs for silver bulls. On the 1-hour chart, the RSI at 37.11 is far from bullish territory, and the MACD is firmly negative. The Stochastic's bullish crossover is the only immediate counter-signal, but it's against a backdrop of strong bearish momentum. The 4-hour chart mirrors this bearish sentiment, while the daily chart, despite some conflicting positive MACD momentum, still shows a strong downtrend with an ADX of 42.27. This confluence of bearish signals across multiple timeframes, especially the dominant trend strength indicated by the ADX, suggests that the path of least resistance is currently to the downside. The price action around $56.16 will be critical in determining the next short-to-medium term move. Traders should be prepared for potential downside acceleration if key support levels fail, while also watching for signs of stabilization and reversal if $56.52 resistance can be overcome with conviction.
The current market environment, characterized by rising energy prices and a mixed dollar index, presents a challenging backdrop for XAGUSD. While inflation fears could theoretically support gold and silver, the dominant bearish technical signals suggest that these macro factors are not yet overriding the prevailing selling pressure. The ECB's cautious stance further adds to the uncertainty. For XAGUSD, the $56.16 level is a critical pivot. A failure to hold this price could lead to a rapid decline towards lower support levels, aligning with the strong bearish trend indicated by technical indicators. Conversely, a decisive break above the immediate resistance at $56.52, confirmed by positive momentum shifts across timeframes, could initiate a short-covering rally. However, given the current data, the risks appear tilted to the downside, and traders should exercise caution, manage risk diligently, and wait for clear signals before committing to a direction. The market is always in motion, and while the current trend is bearish, vigilance for shifts in momentum is paramount.
Frequently Asked Questions: XAGUSD Analysis
What happens if XAGUSD breaks below the $55.97 support level?
If XAGUSD closes decisively below the $55.97 support on the 1-hour chart, it would validate the bearish scenario. This could trigger further selling, with the next targets likely being $55.68 and then $55.42, aligning with the strong downtrend indicated by indicators like RSI and MACD.
Should I buy XAGUSD at current levels of $56.16 given the bearish RSI at 37.11?
Buying at $56.16 with a bearish RSI of 37.11 is a contrarian move and carries significant risk, as the dominant trend is down. While the 1-hour Stochastic shows a bullish crossover, it needs confirmation from price action and other indicators. A more prudent approach would be to wait for a confirmed break above resistance or a clear test of lower support levels before considering a trade.
Is the RSI at 37.11 a sell signal for XAGUSD on the 1-hour chart?
An RSI of 37.11 is in the neutral zone but leans bearish, indicating that sellers have more control than buyers in the immediate short term. While not an extreme oversold reading requiring an immediate buy signal, it supports the prevailing downtrend and suggests that rallies might face selling pressure.
How will rising oil prices and ECB's stance affect XAGUSD this week?
Rising oil prices can increase inflation expectations, potentially benefiting silver as an inflation hedge. However, the ECB's cautious stance and the mixed signals from the DXY currently seem to be having a greater impact, contributing to the bearish technical picture for XAGUSD. If inflation fears dominate, silver could find support, but the current downtrend suggests this macro factor needs to overcome strong technical headwinds.
| Indicator | Value | Signal | Interpretation |
|---|---|---|---|
| RSI (14) | 37.11 | Bearish | Neutral zone, leaning bearish, room to fall. |
| MACD Histogram | -15.20 | Bearish | Negative momentum building. |
| Stochastic (%K/%D) | 43.73 / 25.17 | Bullish Crossover | Short-term divergence, potential pause. |
| ADX | 35.29 | Strong Trend | Confirms strong trend, but direction is key. |
| Bollinger Bands | Below Middle Band | Bearish | Downward pressure confirmed. |
Track markets in real-time
AI-powered analysis, technical indicators and real-time price data.
Join Our Telegram Channel
Breaking market news, AI analysis and trading signals instantly.
Join Channel