

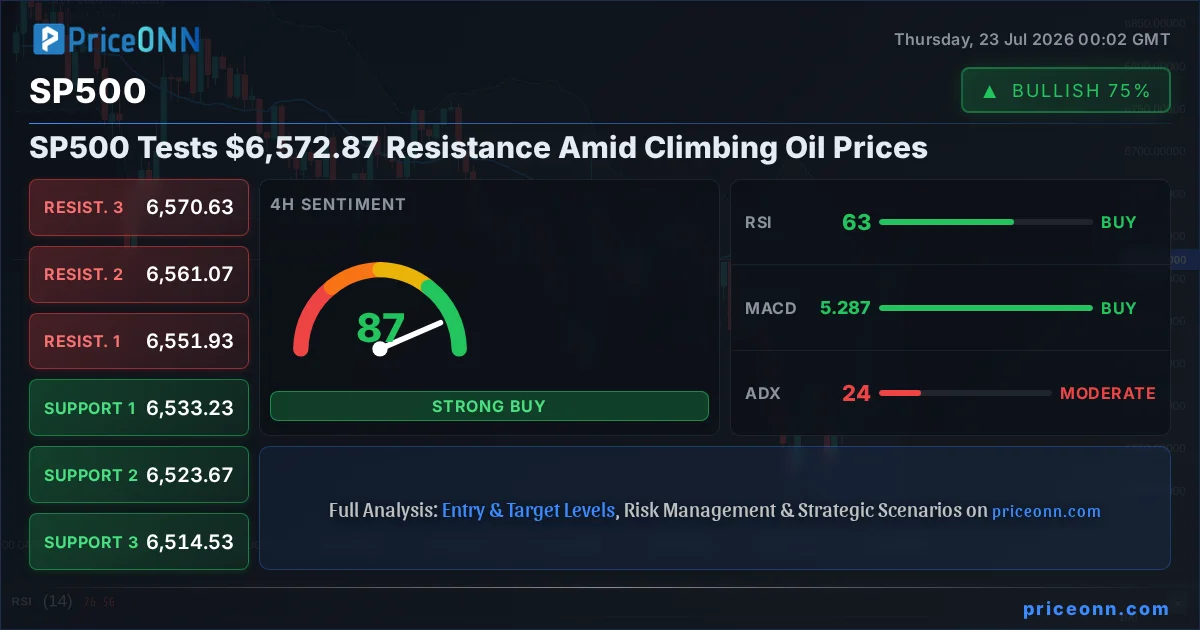
The S&P 500 is standing at a critical juncture, currently testing the significant resistance level of $6,572.87. This pivotal moment arrives as geopolitical tensions continue to fuel a rise in oil prices, with Brent crude trading around $83.79. This dynamic paints a complex picture for equity markets, where the interplay between rising energy costs, inflation concerns, and investor sentiment is creating a challenging environment for traders. The question on everyone's mind is whether the S&P 500 can overcome this resistance, or if the headwinds from higher oil prices and broader market anxieties will force a retreat. Having tracked the S&P 500 through its recent volatility, it's clear that a definitive move is on the horizon, and the $6,572.87 level is the line in the sand.
- The S&P 500 is testing resistance at $6,572.87, a critical level for the index.
- Brent crude oil is trading around $83.79, influenced by Middle East escalation, potentially impacting inflation expectations.
- Technical indicators on the S&P 500 show mixed signals: RSI at 70.95 on 1H suggests overbought conditions, while the ADX at 49.72 on the daily chart indicates a strong downward trend.
- The DXY is at 100.7, indicating dollar strength which can pressure risk assets like the S&P 500.
- A close above $6,572.87 is needed for bullish continuation, while a break below $6,526.53 could signal further downside.
Navigating the Resistance at $6,572.87
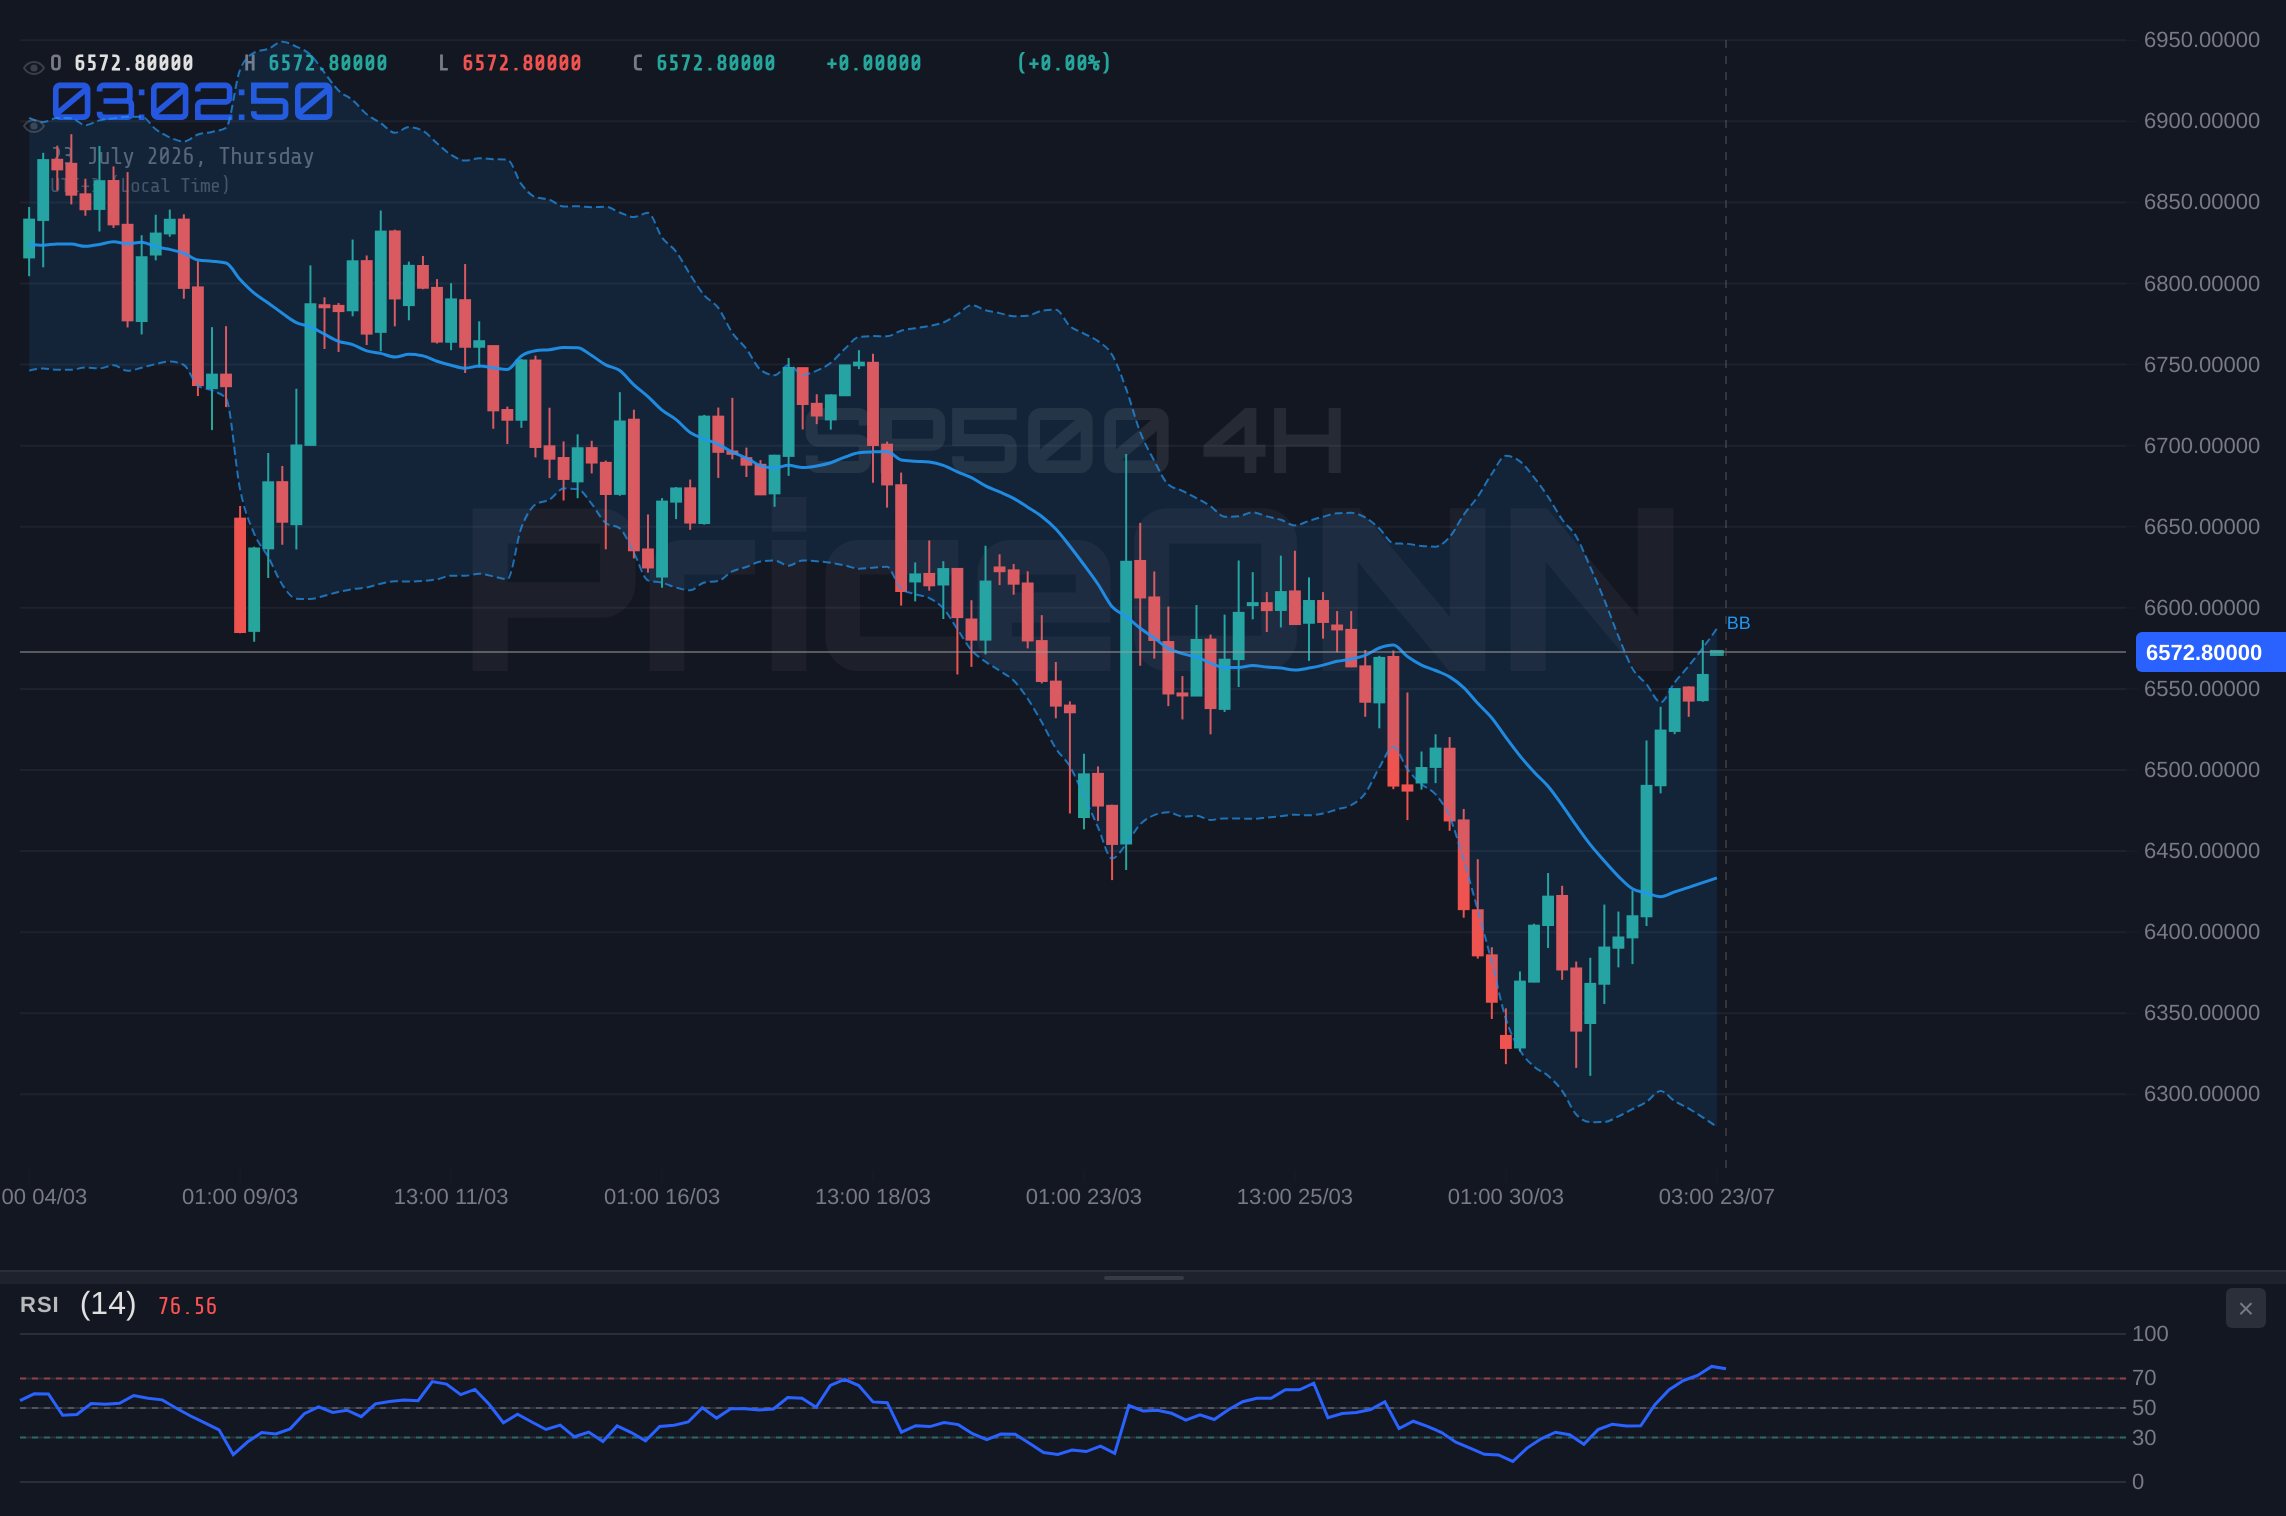
The S&P 500's current position at $6,572.87 is more than just a price point; it represents a battleground between bulls and bears. On the 1-hour chart, the index has shown strong upward momentum, pushing towards this key resistance. However, the RSI(14) at 70.95 on this timeframe signals that the market is entering overbought territory. This suggests that while the buying pressure has been significant, it may be becoming unsustainable in the short term, and a pause or pullback could be imminent. The MACD on the 1-hour chart also shows negative momentum, with the MACD line below the signal line, reinforcing the caution needed at these elevated levels. The ADX at 49.72 on the daily chart, however, paints a different picture, indicating a strong downward trend, which seems counterintuitive to the intraday push higher. This divergence in signals across different timeframes highlights the complexity and potential for sharp moves.
The correlation with broader market sentiment, as indicated by the DXY (Dollar Index) at 100.7, also plays a crucial role. A strengthening dollar often correlates with a risk-off sentiment, which can put pressure on equity indices like the S&P 500. As the dollar index shows signs of upward momentum, it adds another layer of complexity to the bullish case for the S&P 500. Traders are closely watching if this resistance can be decisively broken, which would require sustained buying pressure and potentially a shift in broader market sentiment. The current price action suggests that while the bulls are trying to push higher, the bears are defending this key level with considerable force, making the next few trading sessions critical.
The Shadow of Rising Oil Prices
The ascent of oil prices, with Brent crude hovering around $83.79, cannot be ignored. This rise is largely attributed to escalating geopolitical tensions in the Middle East, as reported by energy news outlets. Such an environment typically fuels inflation expectations, as higher energy costs ripple through the economy, affecting transportation, manufacturing, and consumer spending. For equity markets, particularly the S&P 500, this presents a double-edged sword. On one hand, rising oil prices can boost the earnings of energy companies, providing a sector-specific tailwind. However, on a broader macroeconomic scale, sustained higher energy costs can dampen consumer demand and increase operating expenses for most businesses, potentially leading to slower economic growth and tighter monetary policy from central banks. This creates a challenging environment for stocks, as the market must weigh the potential for increased corporate revenues against the risk of stagflationary pressures.
The market's reaction to these rising oil prices is a key factor to monitor. While the S&P 500 is currently testing resistance, the underlying inflationary pressures from oil could prompt the Federal Reserve to maintain a hawkish stance, or even consider further tightening if inflation proves persistent. This, in turn, could dampen investor appetite for riskier assets. The correlation between oil prices and inflation expectations is a well-established principle in market analysis, and any signs of inflation re-accelerating could lead to a significant repricing of risk across all asset classes. Traders are therefore dissecting every piece of news related to the Middle East and its potential impact on global energy supply and demand dynamics.
Technical Breakdown: 1-Hour and 4-Hour Perspectives
Looking at the 1-hour timeframe for the S&P 500, the trend is decidedly bullish (Power: 100%), with the price consolidating above the $6,547.63 support. However, the RSI at 70.95 is a clear warning sign of overbought conditions. The MACD shows negative momentum, indicating that the upward force might be waning. Stochastic oscillator is also showing a bearish signal with K line below D line, suggesting a potential pullback from current highs. The ADX at 49.72 on the 1-hour chart indicates a strong trend, but its high value combined with the RSI warning suggests caution. On the 4-hour chart, the trend is neutral (Power: 50%), with the price trading between support at $6,533.23 and resistance at $6,551.93. The RSI at 62.83 is in the upper neutral zone, suggesting room for further upward movement but not extreme overbought conditions yet. The MACD here is positive, supporting the bullish bias on this timeframe. The Stochastic K line is high at 97.85, suggesting it's in overbought territory and due for a potential reversal or consolidation. The ADX at 24.23 indicates a moderate trend strength, suggesting that the market is not in a strong directional move on this timeframe.
The conflict between the shorter-term overbought signals on the 1-hour chart and the more neutral-to-bullish signals on the 4-hour chart creates uncertainty. This could lead to a period of consolidation or a sharp reversal if the resistance at $6,572.87 proves too strong. The fact that the 1-hour RSI is flashing an overbought warning while the 4-hour chart shows room for more upside creates a divergence that many traders watch closely. It implies that the recent surge might be nearing exhaustion, but a decisive break of resistance could invalidate these short-term concerns. The key will be how the price behaves around the $6,572.87 mark – a firm rejection here could lead to a swift move back towards the $6,533.23 support, while a clean break could open the door for further gains.
Daily Chart Dynamics: A Stronger Trend Emerges
Shifting to the daily timeframe, the picture for the S&P 500 becomes more revealing. The trend here is clearly defined as bearish (Power: 100%), with the price currently sitting below the significant resistance level of $6,605.07 and above the support at $6,377.47. The RSI(14) at 45.35 is in the neutral zone but shows a downward inclination, aligning with the bearish trend. The MACD histogram is negative, and the MACD line is below the signal line, further confirming the bearish momentum on this longer timeframe. The Bollinger Bands show the price trading below the middle band, indicating a bearish bias. The Stochastic oscillator, with K at 42.97 and D at 29.88, is showing a bullish signal with K > D, but both lines are in the lower half of the range, suggesting that even this bullish signal is coming from a position of weakness. The ADX at 49.72 is notably high, signifying a very strong trend, which in this context is a strong downward trend.
This strong daily bearish trend reading is crucial. It suggests that any upward moves, like the one currently testing resistance, might be viewed as counter-trend rallies within a larger downtrend. The ADX value of 49.72 is particularly telling; it indicates that the market is in a robust directional move, and the prevailing trend is likely to continue unless significant new information emerges. The fact that the daily RSI is not yet in oversold territory also suggests there could be further room for declines before a sustained bounce occurs. This daily perspective provides a vital counterpoint to the intraday bullishness, reminding traders that the larger picture may still favor the bears, making any breakout above $6,572.87 a significant event that would need to be confirmed by other indicators and potentially a shift in macroeconomic conditions.
Correlation Analysis: DXY, Oil, and Equities
The interplay between the S&P 500, the US Dollar Index (DXY), and oil prices is a critical component of market analysis. Currently, the DXY is trading at 100.7, showing a slight upward trend on the 1-hour chart. Historically, a stronger dollar tends to exert downward pressure on US equities, as it makes American goods more expensive for foreign buyers and can signal capital flowing out of riskier assets into perceived safe-haven currencies. This inverse correlation is a key factor that traders are watching closely. If the DXY continues to climb, it could act as a significant headwind for the S&P 500, even if other technical indicators appear bullish in the short term.
Meanwhile, the rise in Brent crude to $83.79, driven by Middle East tensions, introduces another layer of complexity. Higher oil prices can contribute to inflation, which in turn influences central bank policy. If the Federal Reserve perceives rising oil costs as a threat to price stability, it might adopt a more hawkish monetary policy stance, potentially leading to higher interest rates. Higher interest rates generally make borrowing more expensive for companies and consumers, which can slow economic growth and negatively impact stock valuations. The current market is thus caught between the immediate bullish sentiment pushing the S&P 500 towards resistance and the underlying macroeconomic concerns stemming from rising energy prices and a strengthening dollar. The resolution of these conflicting forces will likely dictate the next major move for the index.
Key Levels and Trading Scenarios
The current technical landscape presents three plausible scenarios for the S&P 500, each with distinct triggers, invalidation points, and targets, all derived from the provided market data. These scenarios are crucial for developing a trading strategy that accounts for the current market uncertainty.
Bearish Scenario: Retreat from Resistance
65% ProbabilityNeutral Scenario: Consolidation Phase
25% ProbabilityBullish Scenario: Breakout Confirmation
10% ProbabilityWhat the Indicators Are Saying
The confluence of technical signals presents a nuanced view of the S&P 500's immediate future. On the 1-hour chart, the RSI at 70.95 is flashing an overbought warning, suggesting that the recent upward momentum may be losing steam. This is further supported by the MACD, which is showing negative momentum. However, the Stochastic oscillator on the 1-hour chart is giving a conflicting bullish signal (%K > %D). The ADX at 49.72 on the 1-hour chart suggests a strong trend is in play, but its high value combined with the overbought RSI points towards potential exhaustion.
The 4-hour chart offers a slightly different perspective. The RSI at 62.83 is in the upper neutral zone, indicating room for further upside but not extreme conditions. The MACD is positive, supporting upward movement. The Stochastic is in overbought territory (K=97.85), which could signal a potential reversal or consolidation. The ADX at 24.23 suggests moderate trend strength. On the daily chart, the overall trend is bearish with an ADX of 49.72, indicating a strong downtrend. The RSI at 45.35 is neutral but trending down, and the MACD is negative. This strong daily downtrend signal is a critical piece of context, suggesting that any current strength might be a counter-trend move. The divergence between short-term bullish signals and the longer-term bearish trend is the dominant theme, demanding careful risk management.
The Macroeconomic Backdrop: Fed, Inflation, and Global Risks
The broader macroeconomic environment continues to cast a long shadow over market movements. The persistent rise in oil prices, currently hovering around $83.79 for Brent crude, fuels concerns about inflation. This is particularly relevant given the Federal Reserve's ongoing assessment of the economic landscape. While recent data might have suggested a pause in rate hikes, stubborn inflation, partly driven by energy costs, could force the Fed to maintain a hawkish stance or even consider further tightening if inflation proves more entrenched than anticipated. The market is keenly awaiting any signals from Fed officials regarding their outlook on inflation and interest rates, as this will heavily influence risk appetite and capital flows.
The current strength in the DXY, trading at 100.7, also adds to the complexity. A stronger dollar can serve as a headwind for US equities, as it potentially signals a flight to safety or a tightening of global liquidity conditions. This inverse relationship between the dollar and the S&P 500 means that any sustained rise in the DXY could put additional pressure on the index, even if short-term technicals appear constructive. Furthermore, geopolitical risks stemming from the Middle East remain a significant wildcard. Any escalation could further disrupt energy markets, exacerbate inflation concerns, and potentially trigger broader risk-off sentiment, leading investors to seek refuge in traditional safe-haven assets rather than equities.
Escalating Middle East Tensions: The ongoing conflict in the Middle East is a significant wildcard. Any further escalation could lead to sharper increases in oil prices, heightened inflation expectations, and a potential flight to safety, impacting the S&P 500 negatively. Traders should remain vigilant for news flow from the region.
Navigating the Path Forward: Actionable Insights
For traders looking to navigate the current market environment surrounding the S&P 500, the path forward requires a clear understanding of the key levels and potential scenarios. The immediate focus remains on the $6,572.87 resistance level. A decisive break and hold above this level, confirmed by increasing volume and a more positive MACD signal on the 1-hour chart, could signal a continuation of the upward move, targeting resistance at $6,577.27 and then $6,589.83. This bullish scenario, however, currently carries a lower probability (10%) due to the conflicting signals and broader bearish trend indicated by the daily ADX.
Conversely, a failure to break above $6,572.87, especially if coupled with a break below the 1-hour support at $6,547.63, opens the door for a bearish scenario. This is deemed the most probable outcome (65%), with targets at the 4-hour support of $6,533.23 and then the 1-hour support at $6,526.53. Such a move would be consistent with the strong bearish trend indicated on the daily chart and could be amplified by persistent dollar strength and rising oil prices fueling inflation fears. A neutral scenario, involving consolidation between $6,526.53 and $6,572.87, is also possible (25% probability), particularly if market participants await further macroeconomic data or geopolitical clarity. Patience and disciplined risk management will be paramount in deciphering these conflicting signals and capitalizing on the market's next significant move.
Frequently Asked Questions: S&P 500 Analysis
What happens if the S&P 500 breaks above the $6,572.87 resistance level?
A decisive close above $6,572.87 on the 1-hour chart, confirmed by rising volume, would invalidate the immediate bearish outlook. This bullish scenario targets the next resistance levels at $6,577.27 and potentially $6,589.83. However, given the current daily bearish trend and overbought short-term RSI, this breakout would need strong confirmation.
Should I consider selling the S&P 500 at current levels around $6,572.87 given the rising oil prices?
Selling at current resistance levels is a valid strategy within the most probable bearish scenario (65% probability). If the index fails to break above $6,572.87 and closes below $6,547.63, targets at $6,533.23 and $6,526.53 become likely. This aligns with the strong daily bearish trend and potential inflation concerns from oil.
Is the RSI at 70.95 a strong sell signal for the S&P 500 right now?
An RSI of 70.95 on the 1-hour chart indicates overbought conditions, suggesting the recent upward momentum may be unsustainable. While not an immediate sell signal on its own, it warns of potential exhaustion and increases the probability of a pullback or consolidation, especially when resistance at $6,572.87 is being tested.
How might the DXY at 100.7 and rising oil prices affect the S&P 500 this week?
A DXY at 100.7 suggests dollar strength, which typically pressures US equities. Rising oil prices around $83.79 can fuel inflation concerns, potentially leading to a hawkish Fed stance. Both factors combined create headwinds for the S&P 500, increasing the likelihood of a bearish scenario playing out if resistance at $6,572.87 holds.
Key Levels
Track markets in real-time
AI-powered analysis, technical indicators and real-time price data.
Join Our Telegram Channel
Breaking market news, AI analysis and trading signals instantly.
Join Channel