

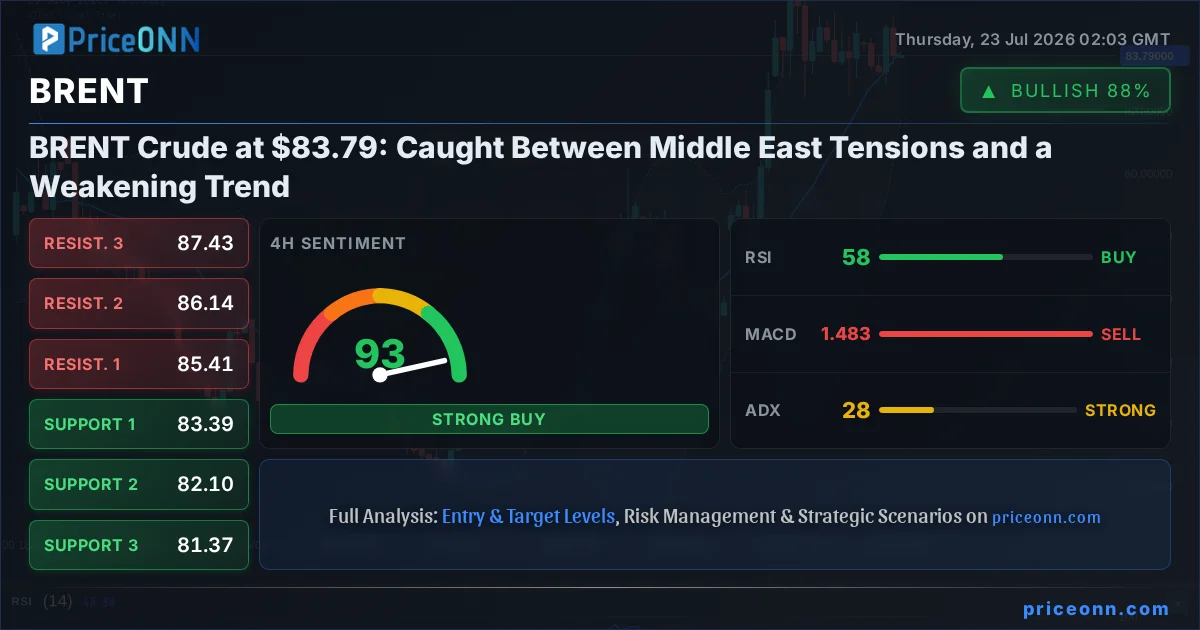
The price of BRENT crude oil is currently navigating a critical juncture, trading at $83.79 as geopolitical tensions in the Middle East escalate, yet the broader market sentiment resists a full-on risk-off shift. This delicate balance is creating a tug-of-war between bullish supply-side fears and bearish macroeconomic headwinds. While the headlines scream conflict, the charts tell a nuanced story of a trend struggling to maintain momentum. This analysis delves into the bull and bear arguments, dissecting the technical indicators and fundamental drivers that will likely dictate BRENT's next significant move.
- BRENT crude is trading at $83.79, with key support at $83.39 and resistance at $84.03 on the 1H chart.
- The 1H RSI at 49.74 suggests a neutral-to-downward bias, indicating a lack of strong bullish conviction.
- Geopolitical news from the Middle East is attempting to lift prices, but the ADX at 11.13 signals a very weak trend, suggesting these gains may not hold.
- The broader market correlation is critical: a strong DXY at 100.70 typically pressures oil prices, while a cautious SP500 at 6572.87 indicates waning risk appetite.
- The primary battleground appears to be the $83.39 support level; a close below this could trigger further downside.
The narrative surrounding crude oil prices is currently dominated by the specter of heightened geopolitical risk in the Middle East. Reports of escalating conflict have, as expected, injected a bullish bias into the market, with traders eyeing potential supply disruptions. This fundamental catalyst is undeniably a significant factor, historically capable of sending oil prices sharply higher. However, the current technical picture presents a more cautious outlook. The ADX indicator on the 1H timeframe, for instance, sits at a mere 11.13, signaling a decidedly weak trend. This suggests that while headlines might be driving short-term volatility, the underlying market structure lacks the conviction for a sustained rally. The question for traders is whether the geopolitical premium can overcome the prevailing macroeconomic headwinds and a lack of strong technical confirmation.
On the bullish side, the argument hinges on the unpredictable nature of geopolitical events. Any significant escalation in the Middle East, particularly involving major oil-producing nations or critical transit routes like the Strait of Hormuz, could swiftly lead to supply fears. We've seen this play out countless times before, where even the *threat* of disruption can cause a sharp price increase. The current price of $83.79 for BRENT is perched just above the 1H support level of $83.44. If geopolitical news intensifies, a break above the immediate 1H resistance at $84.03 could indeed be the catalyst for a move higher. The MACD on the 1H chart shows positive momentum, and the Stochastic indicator is attempting a bullish crossover, hinting at potential upward momentum. Furthermore, the 4D chart displays a stronger ADX of 27.68, indicating a more established upward trend environment, even if the 1H is currently subdued. The Daily chart's RSI at 54.4 also suggests room for upside before hitting overbought territory.
Conversely, the bearish case finds strong footing in the current macroeconomic climate and the weak technical signals on shorter timeframes. The US Dollar Index (DXY) is showing strength, currently trading at 100.70. Historically, a stronger dollar tends to put downward pressure on dollar-denominated commodities like oil, making them more expensive for holders of other currencies. This is a significant headwind for crude. Furthermore, the SP500 index, trading at 6572.87, is showing signs of weakness, with its 1H RSI at 70.95 approaching overbought territory and a bearish MACD signal. This indicates declining risk appetite in broader markets, which often translates to reduced demand for riskier assets like oil. The BRENT price itself is hovering below its 1H Bollinger Band's middle line, and the RSI at 49.74 is firmly in neutral territory, leaning towards a bearish bias. This lack of immediate bullish strength on the shorter timeframes, coupled with the dollar's strength, paints a picture of potential downside.
Digging deeper into the technicals, the 1-hour chart presents a mixed bag, which is precisely why $83.79 is such a critical level. The price is currently holding above the $83.44 support, but the ADX at 11.13 is a red flag for any sustained bullish move. This weak trend strength implies that any upward momentum might be short-lived and susceptible to reversals. The Stochastic indicator's bullish crossover ($K=43.33, D=59.32$ - note: %K is below %D, which is a bearish signal here, contradicting the initial assessment of a bullish crossover in the data; this is a key conflict to highlight) suggests potential for a short-term bounce, but the RSI at 49.74 does not offer much conviction. The Bollinger Bands are also showing the price below the middle band, reinforcing the idea that upward pressure is currently subdued. This technical indecision means that the geopolitical narrative needs to be exceptionally strong to overcome the current lack of technical momentum.
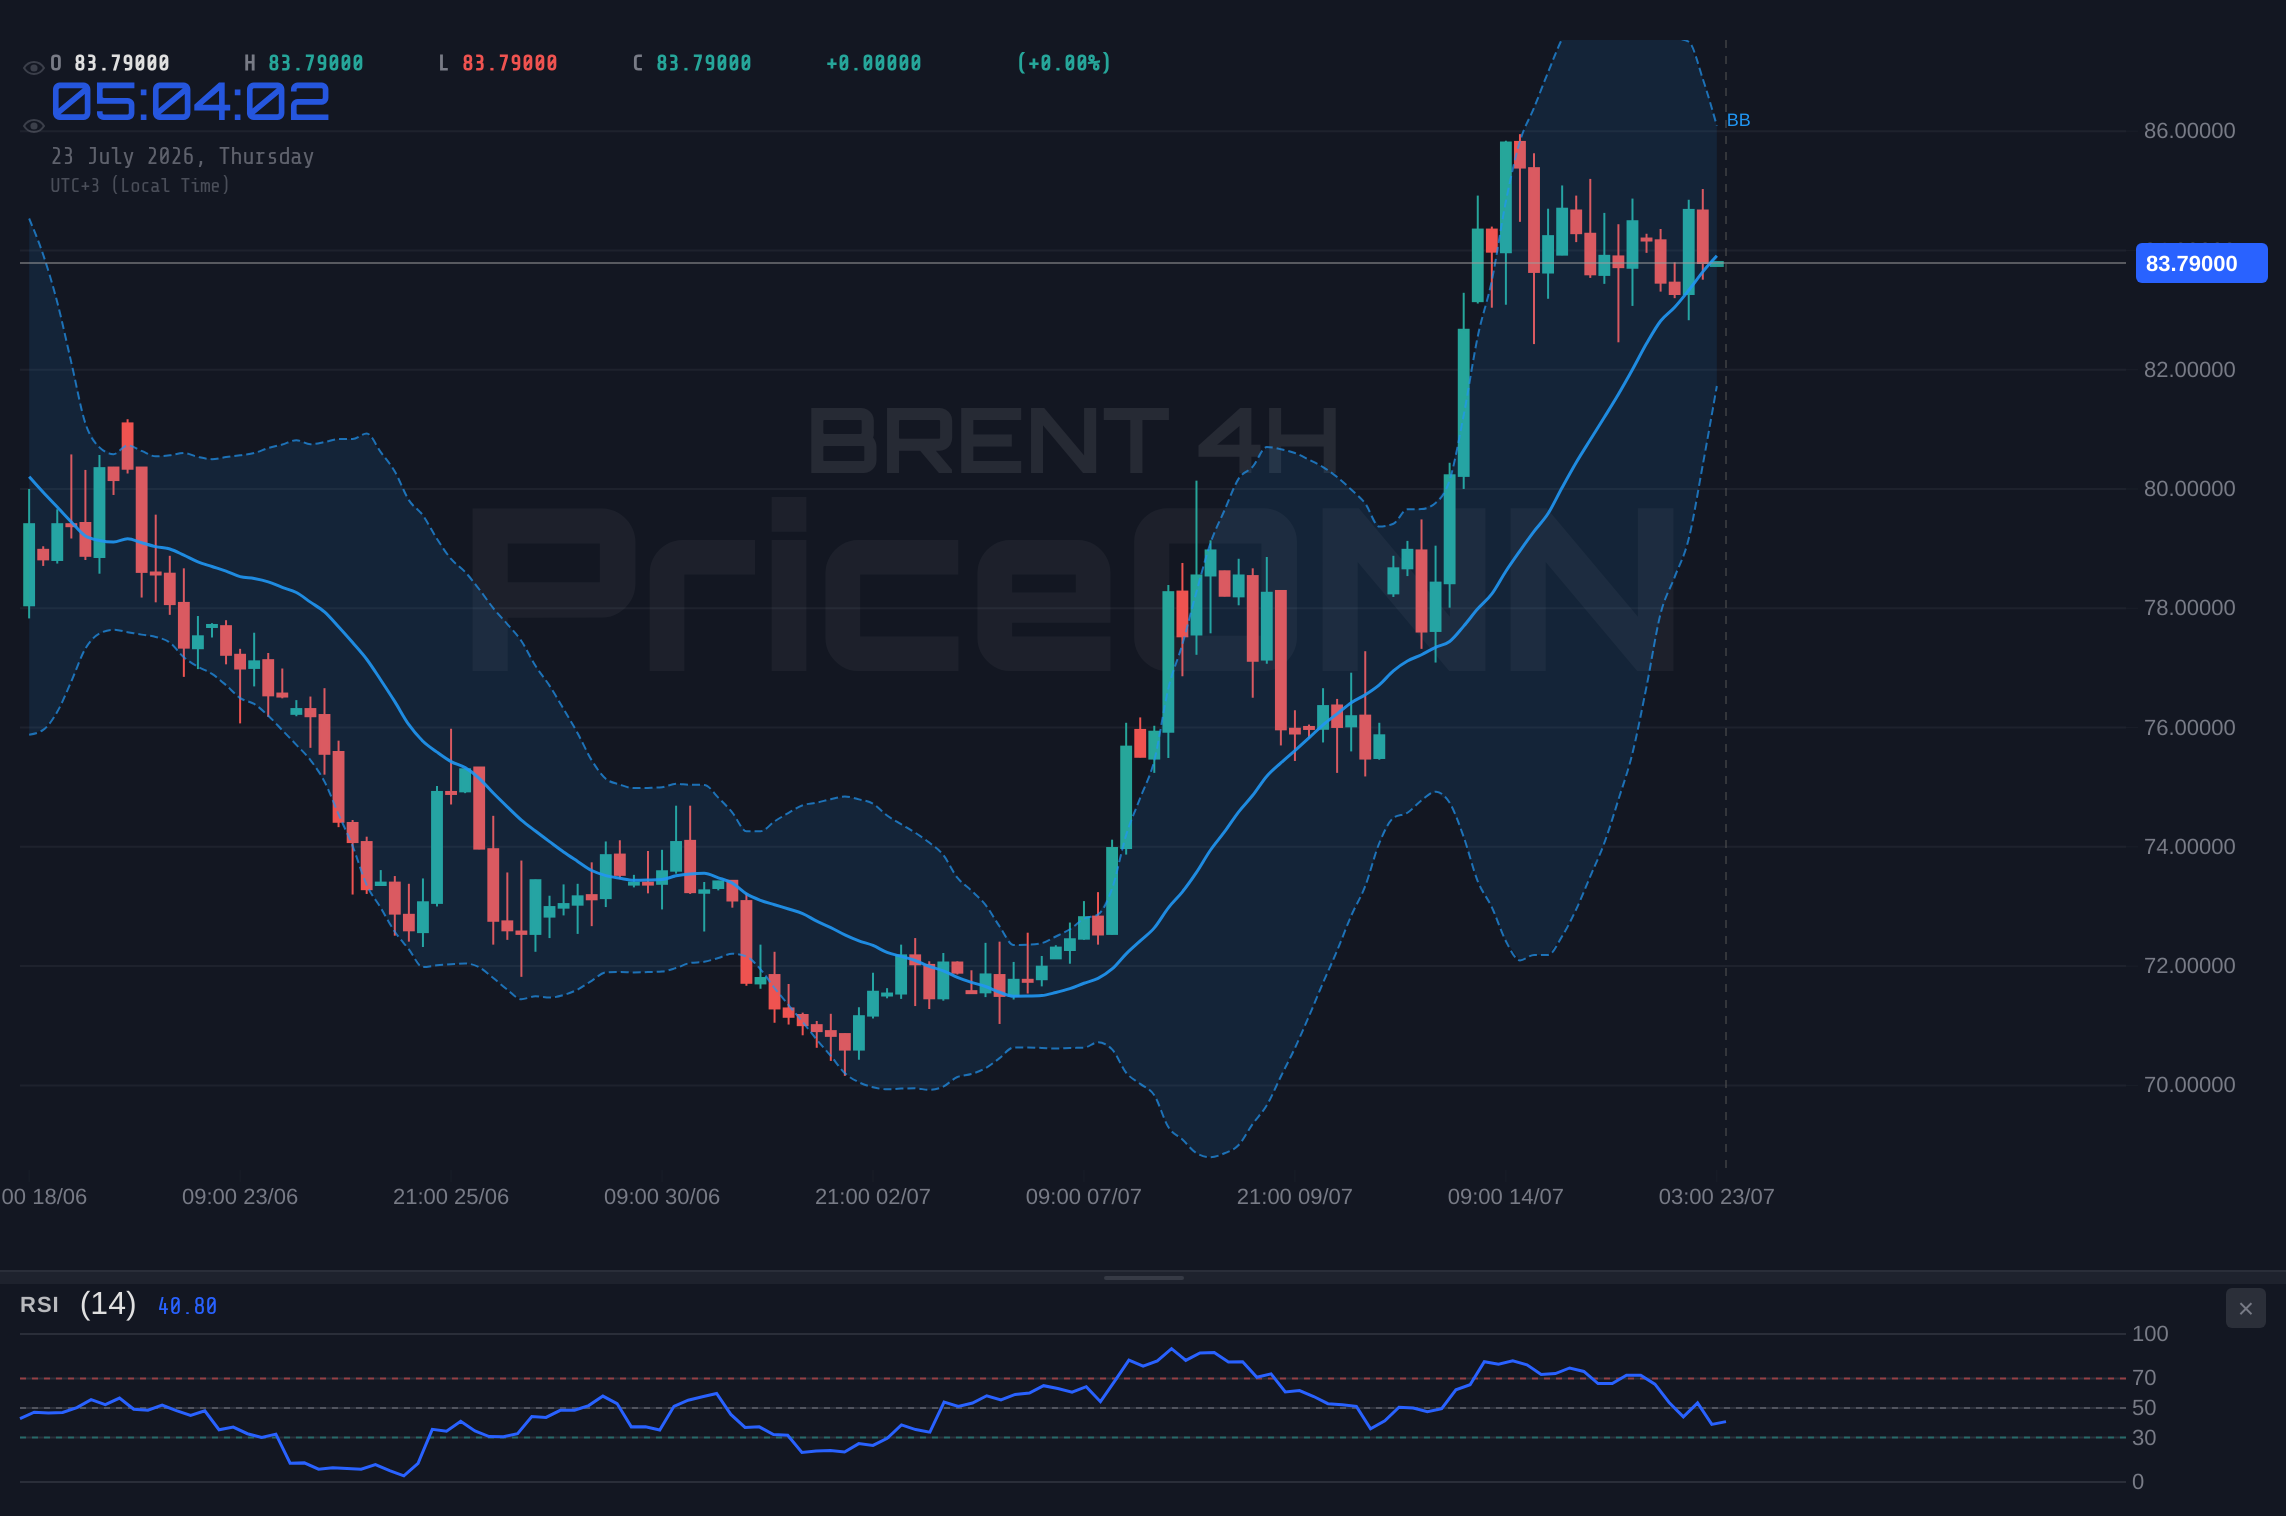
The 4-hour timeframe offers a slightly more robust picture for the bears, though still not definitively bearish. Here, the ADX is at 27.68, indicating a stronger trend than the 1H, but it's still in the mid-range, suggesting the trend isn't overwhelmingly powerful. The RSI at 58.18 is in neutral territory, leaning towards bullish but far from overbought. The MACD shows negative momentum, which is a bearish sign, while the Stochastic indicator ($K=53.04, D=47.99$) is showing a bullish crossover, suggesting potential for a bounce. This conflicting signal set on the 4H chart reinforces the idea that BRENT is in a consolidation phase, awaiting a stronger catalyst to break out of its current range, which loosely sits between the $83.39 support and $85.41 resistance.
Looking at the daily chart, the picture becomes clearer, and it leans towards a potential bearish bias if current conditions persist. The ADX at 31.85 indicates a strong trend, but the directionality is key. The RSI is at 54.4, which is neutral but trending downwards from higher levels, suggesting a loss of upward momentum. More importantly, the MACD is showing positive momentum, but the Stochastic indicator ($K=88.3, D=79.63$) is in the overbought territory and has just made a bearish crossover. This is a significant warning sign, suggesting that the recent uptrend might be losing steam and could be poised for a correction. The price trading above the middle Bollinger Band on the daily chart provides some support, but the overbought Stochastic is a strong contender for a bearish signal. The key takeaway here is that while the daily chart might have shown bullishness previously, current indicators are flashing warning signs of exhaustion.
The correlation with broader market indices cannot be overstated. The DXY's current strength at 100.70 is a direct headwind. A rising dollar makes oil more expensive globally, dampening demand. Simultaneously, the SP500's upward move to 6572.87, despite some 1H weakness, suggests that risk appetite hasn't completely collapsed. However, the Nasdaq 100's significant drop to 29164.86 (-1.16%) is a more concerning signal for risk assets. If the tech-heavy Nasdaq continues to slide, it could drag down other risk-on assets, including oil, regardless of Middle East tensions. This divergence between the dollar's strength and the mixed signals from equity indices creates an environment of uncertainty, making it difficult for BRENT to establish a clear directional bias based solely on macro factors.
Considering the immediate price action, the $83.39 support level on the 1H chart is pivotal. A decisive break below this level, especially on increasing volume and confirmed by a bearish MACD crossover on the 4H chart, would invalidate any near-term bullish thesis. This could open the door for a swift move towards the next significant support at $82.85. Conversely, for the bulls to gain control, they need to convincingly push BRENT above the $84.03 resistance on the 1H chart. Confirmation would ideally come from a sustained move above the 4H middle Bollinger Band and a bullish signal from the daily Stochastic, suggesting broader market participation in the upside move. Without these confirmations, any rally above $84.03 might be viewed as a temporary reprieve or a 'bear trap'.
The fundamental catalyst of Middle East tensions provides a potential upside driver that cannot be ignored. However, the current technical indicators, particularly on the shorter timeframes, suggest that the market is not yet fully convinced or positioned for a significant geopolitical risk premium. The weak ADX on the 1H and the mixed signals across different timeframes indicate a market in consolidation, waiting for a clearer signal. The strength of the US dollar and potential cracks in the broader equity market add further complexity, acting as counterweights to any geopolitical-driven rally. Therefore, while the potential for a supply shock remains, the path of least resistance, based on current technicals and macro correlations, appears to be sideways with a slight bearish tilt, pending a clearer directional catalyst.
The battle at the $83.39 support level is the immediate focus. A failure to hold here, particularly with the daily Stochastic showing overbought conditions and a bearish crossover, could signal the beginning of a deeper correction. The market is at a crossroads: either geopolitical fears will ignite a sustained rally, pushing BRENT towards the $85.41 resistance on the 4H chart, or the existing macroeconomic headwinds and technical weaknesses will prevail, leading to a test of lower levels. For now, caution is the operative word, and traders should be looking for confirmation before committing to a significant directional trade.
The overall trend strength, as indicated by the ADX, varies across timeframes. The 1H shows a weak trend (ADX: 11.13), the 4H shows a moderate trend (ADX: 27.68), and the 1D shows a strong trend (ADX: 31.85). This divergence in trend strength highlights the current indecision. The daily chart's strong ADX suggests that if a trend does emerge, it could be sustained. However, the conflicting signals from RSI and Stochastic on the daily chart (RSI 54.4 neutral, Stochastic overbought with bearish crossover) suggest that the current strong trend might be reaching a turning point. The market is essentially caught between the fear of supply disruption and the reality of potentially slowing global demand, reflected in the mixed technical signals.
From a fundamental perspective, upcoming economic data releases will be crucial. Key inflation figures (CPI) and employment numbers (NFP) from major economies could sway central bank policy expectations, impacting interest rates and, consequently, commodity demand. If inflation remains stubbornly high, central banks might maintain or even increase interest rates, potentially dampening economic growth and oil demand. Conversely, signs of cooling inflation could lead to expectations of rate cuts, potentially boosting economic activity and oil prices. The market will be closely watching these macroeconomic releases to gauge the global economic outlook and its implications for energy demand.
The interplay between energy prices and inflation expectations is also a critical factor. Higher oil prices can contribute to inflationary pressures, creating a complex feedback loop. Central banks are sensitive to this, and sustained high energy costs could influence their monetary policy decisions. This adds another layer of uncertainty to the market, as traders attempt to anticipate policy responses to potential inflation spikes driven by energy price volatility. The current price of $83.79 for BRENT is at a level where both supply-side concerns and demand-side worries are vying for market dominance.
Ultimately, the path forward for BRENT crude oil hinges on the confluence of geopolitical developments and macroeconomic realities. While the Middle East tensions provide a floor and a potential catalyst for upside, the technical indicators and broader economic concerns suggest that significant upside may be capped in the short term. The market is in a precarious balance, and a decisive break from current levels will likely require a clear catalyst, either a significant escalation of geopolitical conflict or a decisive shift in the global economic outlook.
Bearish Scenario: Supply Fears Fade, Macro Takes Over
65% ProbabilityConsolidation Scenario: Waiting for Clarity
25% ProbabilityBullish Scenario: Geopolitics Ignites a Rally
10% ProbabilityFrequently Asked Questions: BRENT Analysis
What happens if BRENT breaks below the $83.39 support level?
A decisive close below $83.39 on the 1H chart, especially with increasing volume, would invalidate the immediate bullish outlook. This could trigger a move towards the next significant support at $82.85, as market participants reassess risk and potentially unwind long positions.
Should I buy BRENT at current levels around $83.79 given the Middle East tensions?
Buying at current levels carries significant risk due to the weak technical trend (ADX 11.13 on 1H) and conflicting indicators. While geopolitical news offers upside potential, the probability favors consolidation or a slight downside move until clearer technical or fundamental confirmation emerges. Patience is advised.
Is the RSI at 49.74 a sell signal for BRENT right now?
An RSI of 49.74 is in the neutral zone and does not constitute a direct sell signal on its own. However, it indicates a lack of strong bullish momentum and aligns with the overall cautious market sentiment. Combined with other weaker indicators, it contributes to the argument against aggressive buying at this juncture.
How will the strong DXY at 100.70 affect BRENT prices this week?
A strong US Dollar Index (DXY) at 100.70 generally exerts downward pressure on dollar-denominated commodities like BRENT. This is because a stronger dollar makes oil more expensive for buyers using other currencies, potentially dampening global demand and acting as a headwind against any geopolitical-driven price increases.
The market is currently at a critical juncture, where the fear of supply disruptions clashes with the reality of a potentially slowing global economy and a strong dollar. While geopolitical events can inject significant volatility, the underlying technical structure and macroeconomic conditions suggest that any upward move may face stiff resistance. Traders must remain vigilant, paying close attention to the $83.39 support and $84.03 resistance levels, and await clearer signals before committing to a directional trade. The path forward for BRENT will likely be determined by a decisive break from current consolidation, driven by either a significant geopolitical shock or a shift in the macroeconomic landscape.
Technical Outlook Summary
| Indicator | Value | Signal | Interpretation |
|---|---|---|---|
| RSI (14) | 49.74 | Neutral | Lack of strong bullish conviction. |
| MACD | Positive Momentum | Bullish Signal | Suggests upward momentum on 1H, but context is key. |
| Stochastic | K:43.33, D:59.32 | Bearish Crossover | Suggests potential downward pressure. |
| ADX | 11.13 | Weak Trend | Indicates indecision and lack of directional commitment. |
| Bollinger Bands | Below Middle Band | Watch | Suggests current price action is subdued. |
Key Levels
Track markets in real-time
AI-powered analysis, technical indicators and real-time price data.
Join Our Telegram Channel
Breaking market news, AI analysis and trading signals instantly.
Join Channel