

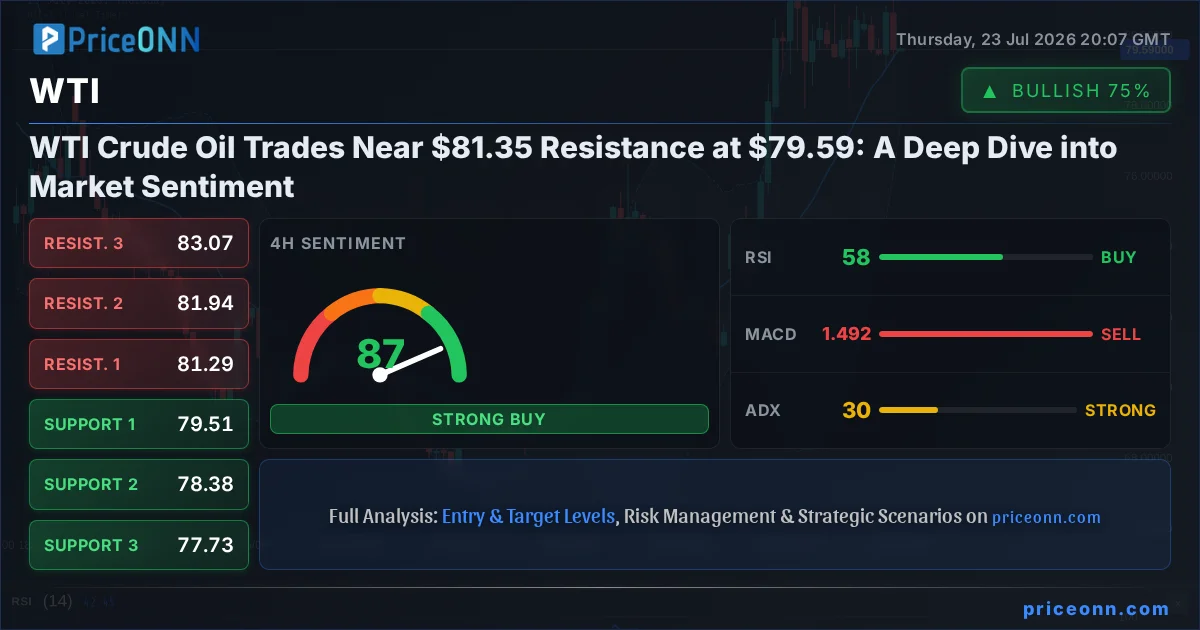
The energy markets are at a fascinating juncture, with WTI Crude Oil currently trading near the significant resistance level of $81.35, while sitting at $79.59. This isn't just another price point; it represents a critical battleground where supply dynamics, geopolitical undercurrents, and broader market sentiment collide. Having tracked WTI through numerous cycles, I can tell you that levels like these are where trends are often decided, and understanding the forces at play is paramount for any serious market participant. The interplay between the strengthening US Dollar, ongoing geopolitical tensions, and the technical indicators on the charts paints a complex picture, demanding a nuanced approach rather than a simple directional bet.
- WTI Crude Oil is trading near $81.35 resistance at $79.59, indicating a critical battle for market direction.
- The Dollar Index (DXY) at 100.70 shows strength, potentially pressuring oil prices, while the SP500's rise to 6572.87 suggests a degree of risk appetite.
- Geopolitical tensions in the Middle East, as reported by news outlets, are a key driver for oil prices, creating underlying support despite dollar strength.
- Technical indicators show a mixed signal: ADX at 30.49 suggests a strong trend, but RSI at 46.91 on the 1H chart indicates caution, with a divergence forming on the 4H chart.
Navigating the Cross-Currents: DXY, Equities, and Oil's Tug-of-War
The current market environment is a masterclass in intermarket correlation, and WTI's dance around $79.59 is no exception. The Dollar Index (DXY), currently at 100.70, is exhibiting strength. Historically, a stronger dollar tends to act as a headwind for dollar-denominated commodities like WTI, as it makes them more expensive for holders of other currencies. This relationship is clearly visible in the data: as the DXY climbed from 100.42 to 100.75, WTI experienced a notable pullback from its higher range. However, this isn't a simple one-to-one correlation. While the dollar is firm, the SP500 index is also showing resilience, trading at 6572.87. This suggests that risk appetite hasn't completely evaporated. Investors are still finding reasons to be in equities, which can sometimes spill over into commodities as a sign of broader economic optimism, or at least a lack of outright fear. The challenge for traders is to discern whether the dollar's strength or the equity market's stability will ultimately dictate WTI's immediate path.
Geopolitical Undercurrents: The Unseen Hand on Crude Prices
Beneath the surface of technical charts and dollar indices lie the volatile currents of geopolitics, which are currently exerting significant influence on crude oil prices. Recent reports, such as the one from Reuters highlighting Middle East escalation, underscore the persistent risk premium embedded in oil markets. Conflicts and tensions in key oil-producing regions have a direct and often immediate impact on supply expectations. Even if physical supply disruptions aren't occurring at this exact moment, the *threat* of them is enough to keep traders on edge and provide a baseline of support for prices. This is why WTI, despite dollar strength and mixed technical signals, isn't simply collapsing. The market is pricing in a degree of uncertainty, and any escalation or de-escalation in these geopolitical hotspots can trigger sharp price movements. It's a constant balancing act: traders weigh the immediate economic data and dollar strength against the ever-present possibility of supply disruptions.
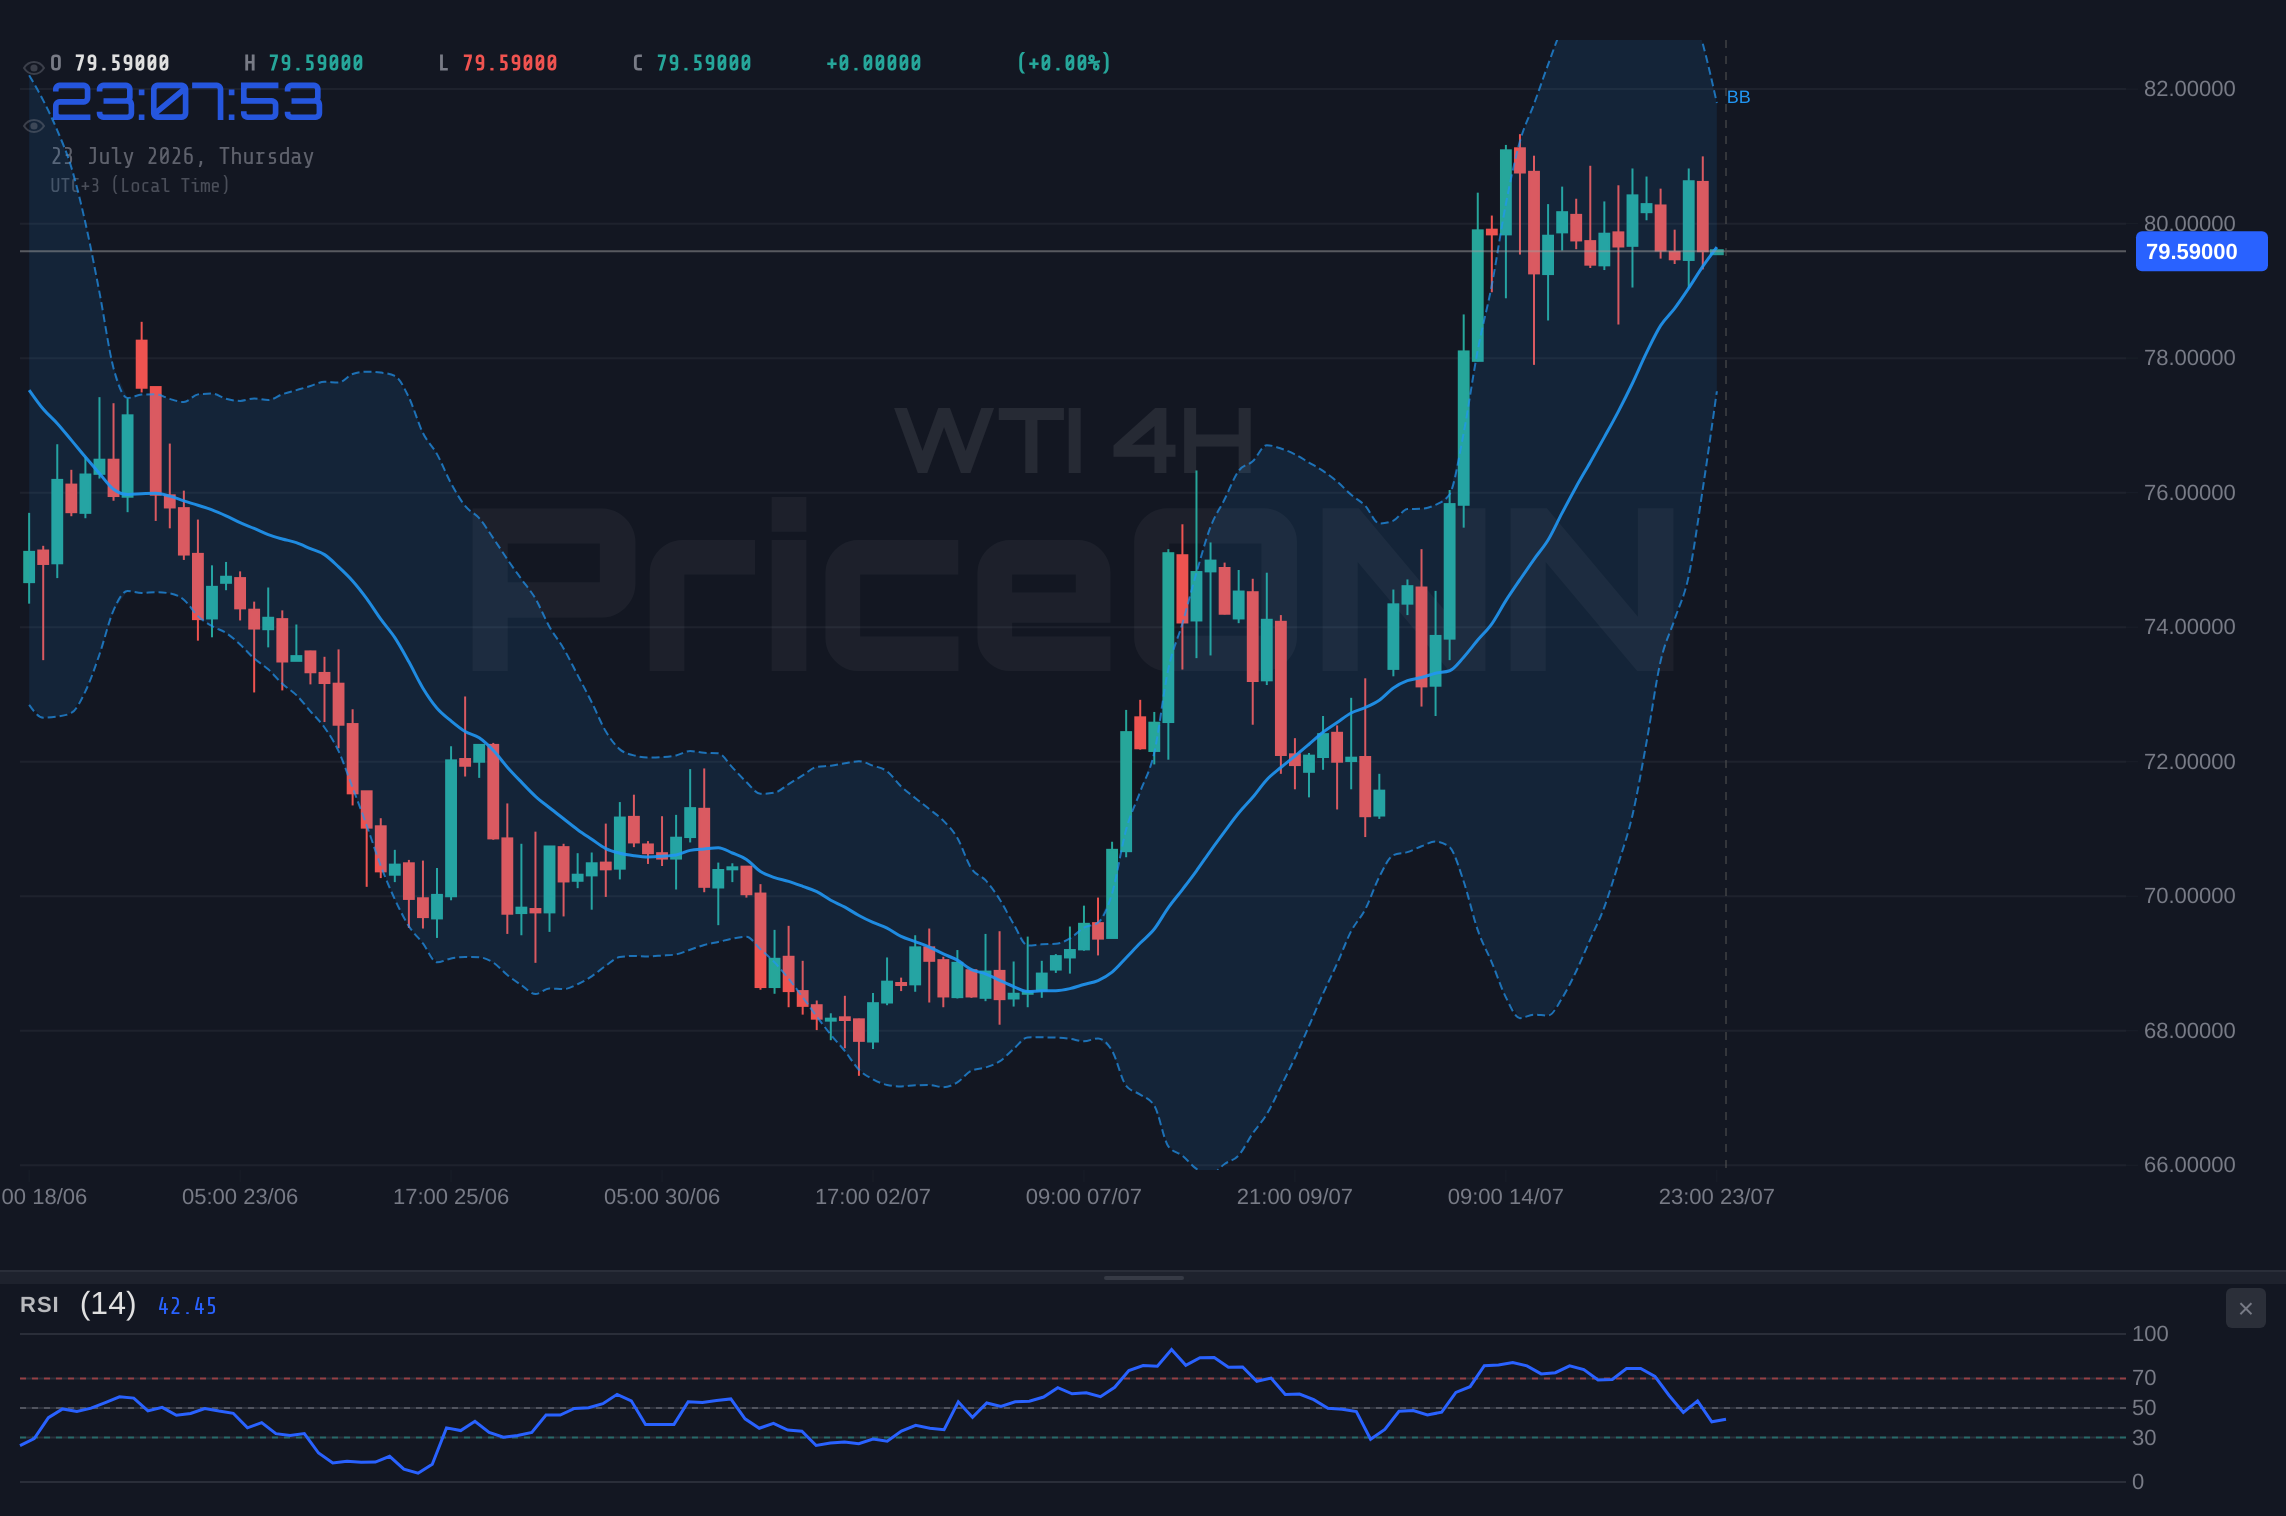
Technical Battleground: What the Charts Are Saying About WTI at $79.59
The technical picture for WTI at $79.59 is a study in conflicting signals, demanding careful interpretation. On the 1-hour chart, the trend is neutral with a power of 50%, indicating indecision. The RSI(14) sits at 46.91, suggesting room to move in either direction, but with a slight downward eğilim. The MACD shows negative momentum, and Bollinger Bands are below the middle band, reinforcing a bearish inclination in the short term. However, the Stochastic oscillator is giving a bullish signal (%K > %D), hinting at a potential short-term bounce. The ADX at 10.18 on this timeframe suggests a weak trend, which aligns with the neutral sentiment. Moving to the 4-hour chart, the picture shifts slightly. Here, the trend is considered neutral with 50% power, but the ADX at 30.49 indicates a strong trend is trying to establish itself, albeit with mixed signals. The RSI is at 58.47, leaning towards bullish, while the MACD shows negative momentum. The Stochastic oscillator is giving a bearish signal (%K
Understanding the ADX: A Measure of Trend Strength
The Average Directional Index (ADX) is a key indicator for understanding the strength of a trend, not its direction. Currently, WTI shows an ADX of 10.18 on the 1-hour chart, signaling a very weak trend, or ranging market. This suggests that price action might be choppy and lack conviction. However, on the 4-hour chart, the ADX rises to 30.49, and on the daily chart, it's at 29.46. Readings above 25 generally indicate a strong trend. This divergence in ADX readings across timeframes is significant. It implies that while the longer-term charts suggest a trend is brewing, the immediate intraday action lacks commitment. Traders often look for ADX to confirm the direction signaled by other indicators; a strong ADX above 25 alongside a bullish RSI and MACD would be a much clearer buy signal. Conversely, a strong ADX with bearish indicators would confirm a strong downtrend. The current mixed ADX readings suggest caution is warranted, and a breakout above key levels like $81.35 resistance or a breakdown below support like $79.23 might be needed to provide clear directional conviction.
The Dollar's Grip: How DXY Influences WTI's Trajectory
The relationship between the US Dollar Index (DXY) and WTI Crude Oil is a cornerstone of commodity market analysis. With the DXY currently at 100.70, reflecting a firm dollar, the pressure on WTI is palpable. A stronger dollar makes oil more expensive for buyers using other currencies, typically dampening demand and pushing prices lower. This inverse correlation is often a primary driver, especially when the dollar is trending. However, the market is not always textbook. We've seen instances where geopolitical events or supply-side shocks can override the dollar's influence, pushing oil higher even as the dollar strengthens. This has been a notable feature recently, as highlighted by news of Middle East escalation, which has kept oil prices elevated despite a generally strong dollar environment. For WTI traders, monitoring the DXY's trend and its proximity to key support or resistance levels is as crucial as watching oil's own charts. A decisive break in the DXY, either upwards or downwards, could provide a significant catalyst for WTI.
Risk Sentiment and Its Ripple Effect: SP500 and Nasdaq's Role
The broader market's risk sentiment, often gauged by the performance of major equity indices like the SP500 and Nasdaq, plays a critical role in commodity markets. The SP500 is currently trading at 6572.87, showing a positive daily change, and the Nasdaq is at 29164.86, albeit with a negative daily change. This mixed performance among indices suggests a cautious or selective risk appetite. When equities are rallying strongly (a 'risk-on' environment), investors tend to increase their exposure to riskier assets, including commodities, often driving prices higher. Conversely, during 'risk-off' periods, marked by falling stock markets, investors flock to safe-haven assets like gold, US Treasuries, and sometimes the dollar, while commodities can suffer. The current mixed signals from the equity markets add another layer of complexity to WTI's outlook. A sustained rally in equities could lend support to oil, while a significant sell-off might exacerbate downward pressure on WTI, especially if it triggers a flight to safety that also boosts the dollar.
Analyzing the Indicators: A Deeper Look at WTI's Signals
Delving deeper into the technical indicators provides a more granular view of WTI's potential movements. On the 1-hour chart, the RSI is at 46.91, hovering in neutral territory but leaning towards bearish, indicating sellers have a slight edge. The MACD histogram is negative, reinforcing this view. However, the Stochastic oscillator's K line is above the D line, suggesting a short-term upward momentum, a potential counter-trend move within the broader bearish pressure. The 4-hour chart presents a slightly different narrative. The RSI at 58.47 is in bullish territory, and while the MACD shows negative momentum, the Stochastic is bearish. The daily chart, however, shows a more optimistic picture for buyers. The RSI is at 53.65, in neutral territory but trending upwards. The MACD is positive, suggesting upward momentum is building, and the Stochastic oscillator is strongly bullish, indicating significant buying interest. This conflict between short-term bearish signals and longer-term bullish potential is where trading opportunities often lie for those who can identify confirmation. The key will be whether the price can decisively break through resistance or hold above support levels, confirming the bias suggested by the longer timeframes.
The $81.35 Resistance: A Potential Turning Point?
The $81.35 level on the WTI chart is more than just a number; it's a psychological and technical barrier that has historically acted as a significant point of resistance. Currently trading at $79.59, WTI is approaching this level, and the outcome of this encounter could be pivotal. A decisive break above $81.35, supported by strong volume and confirmation from other indicators like a rising RSI and MACD crossover, could signal the start of a new upward trend, potentially targeting higher levels. Conversely, a failure to break through $81.35, leading to a rejection and a move back towards support levels like $79.23, would reinforce the current bearish undertones and could lead to further downside. The strength of the trend, as indicated by the ADX on the daily chart (29.46), suggests that if a breakout occurs, it could be sustained. However, the weaker ADX on the 1-hour chart (10.18) highlights the intraday choppiness and the potential for false moves before a clear trend emerges. Traders will be watching closely for confirmation, perhaps waiting for a daily close above $81.35 or a clear rejection pattern at this level.
What Does a Strong ADX Mean for WTI Traders?
The ADX reading of 30.49 on the 4-hour chart and 29.46 on the daily chart for WTI is particularly noteworthy. These levels suggest that a strong trend is either in place or attempting to establish itself. In a strong trend environment, indicators like RSI and Stochastic can remain in overbought or oversold territory for extended periods, meaning signals to buy on RSI oversold or sell on RSI overbought can be premature. This is why confirmation is key. If WTI is indeed entering a strong uptrend, a break above $81.35 resistance, confirmed by a rising RSI and positive MACD momentum, would be a strong buy signal. Conversely, if a strong downtrend is forming, a break below the support at $79.23, confirmed by bearish indicators, would signal a shorting opportunity. The current ADX levels imply that once a direction is established, the move could be significant, making the breakout or breakdown from current levels a critical event to monitor.
The Role of Economic Data and Central Bank Policy
While geopolitical events are major catalysts, the steady drumbeat of economic data and central bank policy continues to shape the broader market narrative, indirectly influencing WTI. The Federal Reserve's stance on interest rates, for instance, has a profound impact on the DXY and, consequently, on oil prices. If Fed officials signal a more hawkish outlook, expecting higher-for-longer interest rates to combat inflation, this typically strengthens the dollar and can pressure commodities. Conversely, signs of a dovish pivot could weaken the dollar and support oil. Recent news about the ECB holding rates steady at 2.25% and closely watching energy shocks provides context for the Euro's performance (EURUSD at 1.14436) but also highlights how central banks globally are grappling with inflation influenced by energy prices. Upcoming data releases, such as inflation reports or employment figures, will be crucial for gauging economic health and central bank intentions, directly impacting the risk sentiment and dollar strength that WTI trades against.
Scenario Analysis: Mapping Potential WTI Moves
Given the current confluence of factors, it's essential to map out potential scenarios for WTI. The market is at a crossroads, with resistance at $81.35 and key support levels below $79.59. The strength of the trend indicated by the daily ADX suggests that a breakout could be imminent, but the mixed signals across timeframes and the influence of the dollar and geopolitics demand a cautious approach. Traders must be prepared for various outcomes, managing risk diligently.
Bearish Scenario: Retreat from Resistance
40% ProbabilityNeutral Scenario: Consolidation Near Resistance
30% ProbabilityBullish Scenario: Breakout Above $81.35
30% ProbabilityThe Path Forward: What to Watch in the Coming Days
As we stand near the critical $81.35 resistance level with WTI at $79.59, the market is poised for a significant move. The prevailing sentiment is cautious, a blend of dollar strength, geopolitical risk, and conflicting technical signals. The daily ADX suggests a strong trend is trying to emerge, but the intraday charts show indecision. For traders, the immediate focus should be on how WTI reacts to the $81.35 resistance. A failure here could see a retest of support levels around $79.23 and $78.97. However, a decisive breakout, confirmed by strong volume and positive momentum across longer timeframes, could open the door to higher prices. The correlation with the DXY and broader equity markets remains a key factor. Traders should remain disciplined, manage risk carefully, and wait for clear confirmation before committing to a position. The market always provides opportunities, but patience and adherence to a well-defined strategy are crucial for navigating these complex conditions.
Frequently Asked Questions: WTI Analysis
What happens if WTI breaks above the $81.35 resistance level?
A sustained break above $81.35, confirmed by daily volume and positive momentum indicators like RSI and MACD, would signal a bullish scenario. This could lead to further upside, potentially targeting levels around $83.35 as the next significant resistance zone.
Should I consider selling WTI at current levels near $79.59 given the dollar strength at 100.70?
Selling at current levels carries risk due to the conflicting signals and geopolitical support. While dollar strength suggests bearish pressure, a confirmed break below $79.23 support, with bearish technicals, would be a more prudent sell trigger. The probability of a bearish move is estimated at 40%.
Is the ADX at 30.49 on the 4-hour chart a strong buy signal for WTI?
An ADX of 30.49 indicates a strong trend is forming, but it doesn't specify direction. On the 4-hour chart, other indicators like RSI at 58.47 are moderately bullish, but the Stochastic is bearish. Confirmation of upward momentum, possibly with a break above $81.35, would be needed to consider it a strong buy signal.
How will ongoing Middle East tensions affect WTI prices this week at $79.59?
Geopolitical tensions act as a baseline support for WTI, creating a risk premium that can counteract dollar strength. Significant escalations could push WTI towards resistance levels like $81.35 or higher, even if broader economic data is weak. Traders should monitor news flow closely for potential supply disruption catalysts.
Track markets in real-time
AI-powered analysis, technical indicators and real-time price data.
Join Our Telegram Channel
Breaking market news, AI analysis and trading signals instantly.
Join Channel