

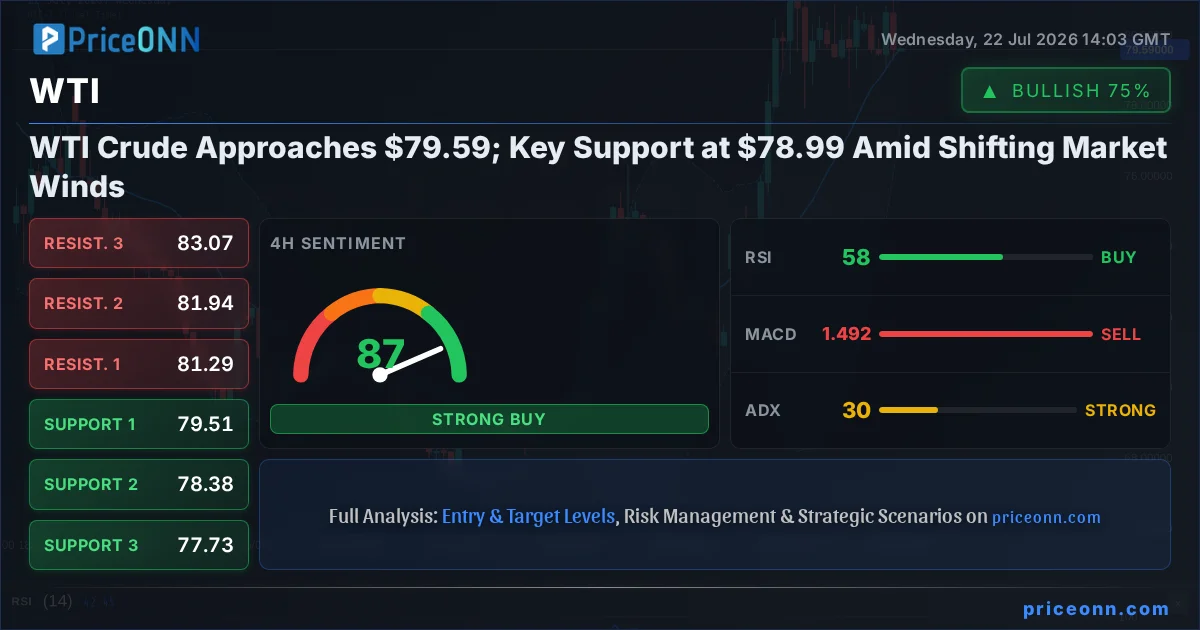
The energy markets are in constant flux, and WTI Crude oil is currently navigating a critical juncture, trading near the $79.59 mark. This price point isn't just a number; it represents a delicate balance influenced by a confluence of global economic signals, geopolitical undercurrents, and the intrinsic dynamics of supply and demand. As traders and analysts scrutinize every tick, the question on everyone's mind is: what does the immediate future hold for WTI, and what are the key levels to watch? Understanding the interplay between the US Dollar Index (DXY), broader market sentiment, and specific commodity trends is crucial for deciphering the path ahead.
- WTI Crude is trading near $79.59, with a strong downward trend signal on the 1-hour chart (ADX 10.18).
- Immediate support is identified at $78.99, a critical level to monitor for potential price stabilization or further declines.
- The MACD on the 1-hour chart shows positive momentum, contrasting with the overall bearish trend signals, indicating potential short-term fluctuations.
- The US Dollar Index (DXY) is currently at 100.70, showing strength that typically exerts downward pressure on oil prices.
The current technical landscape for WTI, as of July 22, 2026, paints a picture of cautious trading. On the 1-hour timeframe, the Average Directional Index (ADX) stands at a relatively weak 10.18, suggesting that the market is not currently exhibiting a strong, committed trend. However, this doesn't negate the immediate downward pressure. The MACD on this same timeframe shows positive momentum, with the MACD line above its signal line, which could suggest short-term buying interest or consolidation before the next significant move. This internal conflict between momentum indicators and the broader trend strength demands careful observation. The Stochastic Oscillator, with %K at 28.74 and %D at 52.74, indicates a bearish signal, further reinforcing the caution around the immediate upside potential.
Delving deeper into the 4-hour chart, the picture becomes slightly more defined. The ADX here registers at 30.49, indicating a stronger trend is in play, albeit one that is still developing. The general signal across this timeframe leans towards 'BUY' (6 buys, 2 sells), which might seem contradictory to the 1-hour bearish signals. This divergence highlights the importance of multi-timeframe analysis. The RSI(14) at 58.47 sits in neutral territory, showing a slight upward eğilim, suggesting that while selling pressure might be easing, there isn't yet a strong conviction for a significant rally. The Bollinger Bands are positioned above the middle band, indicating a bullish eğilim on this timeframe, but this needs to be weighed against other indicators. The Stochastic Oscillator %K at 58.32 and %D at 60.98 presents a bearish signal, suggesting a potential pullback or consolidation is more likely than a sustained rally from these levels.
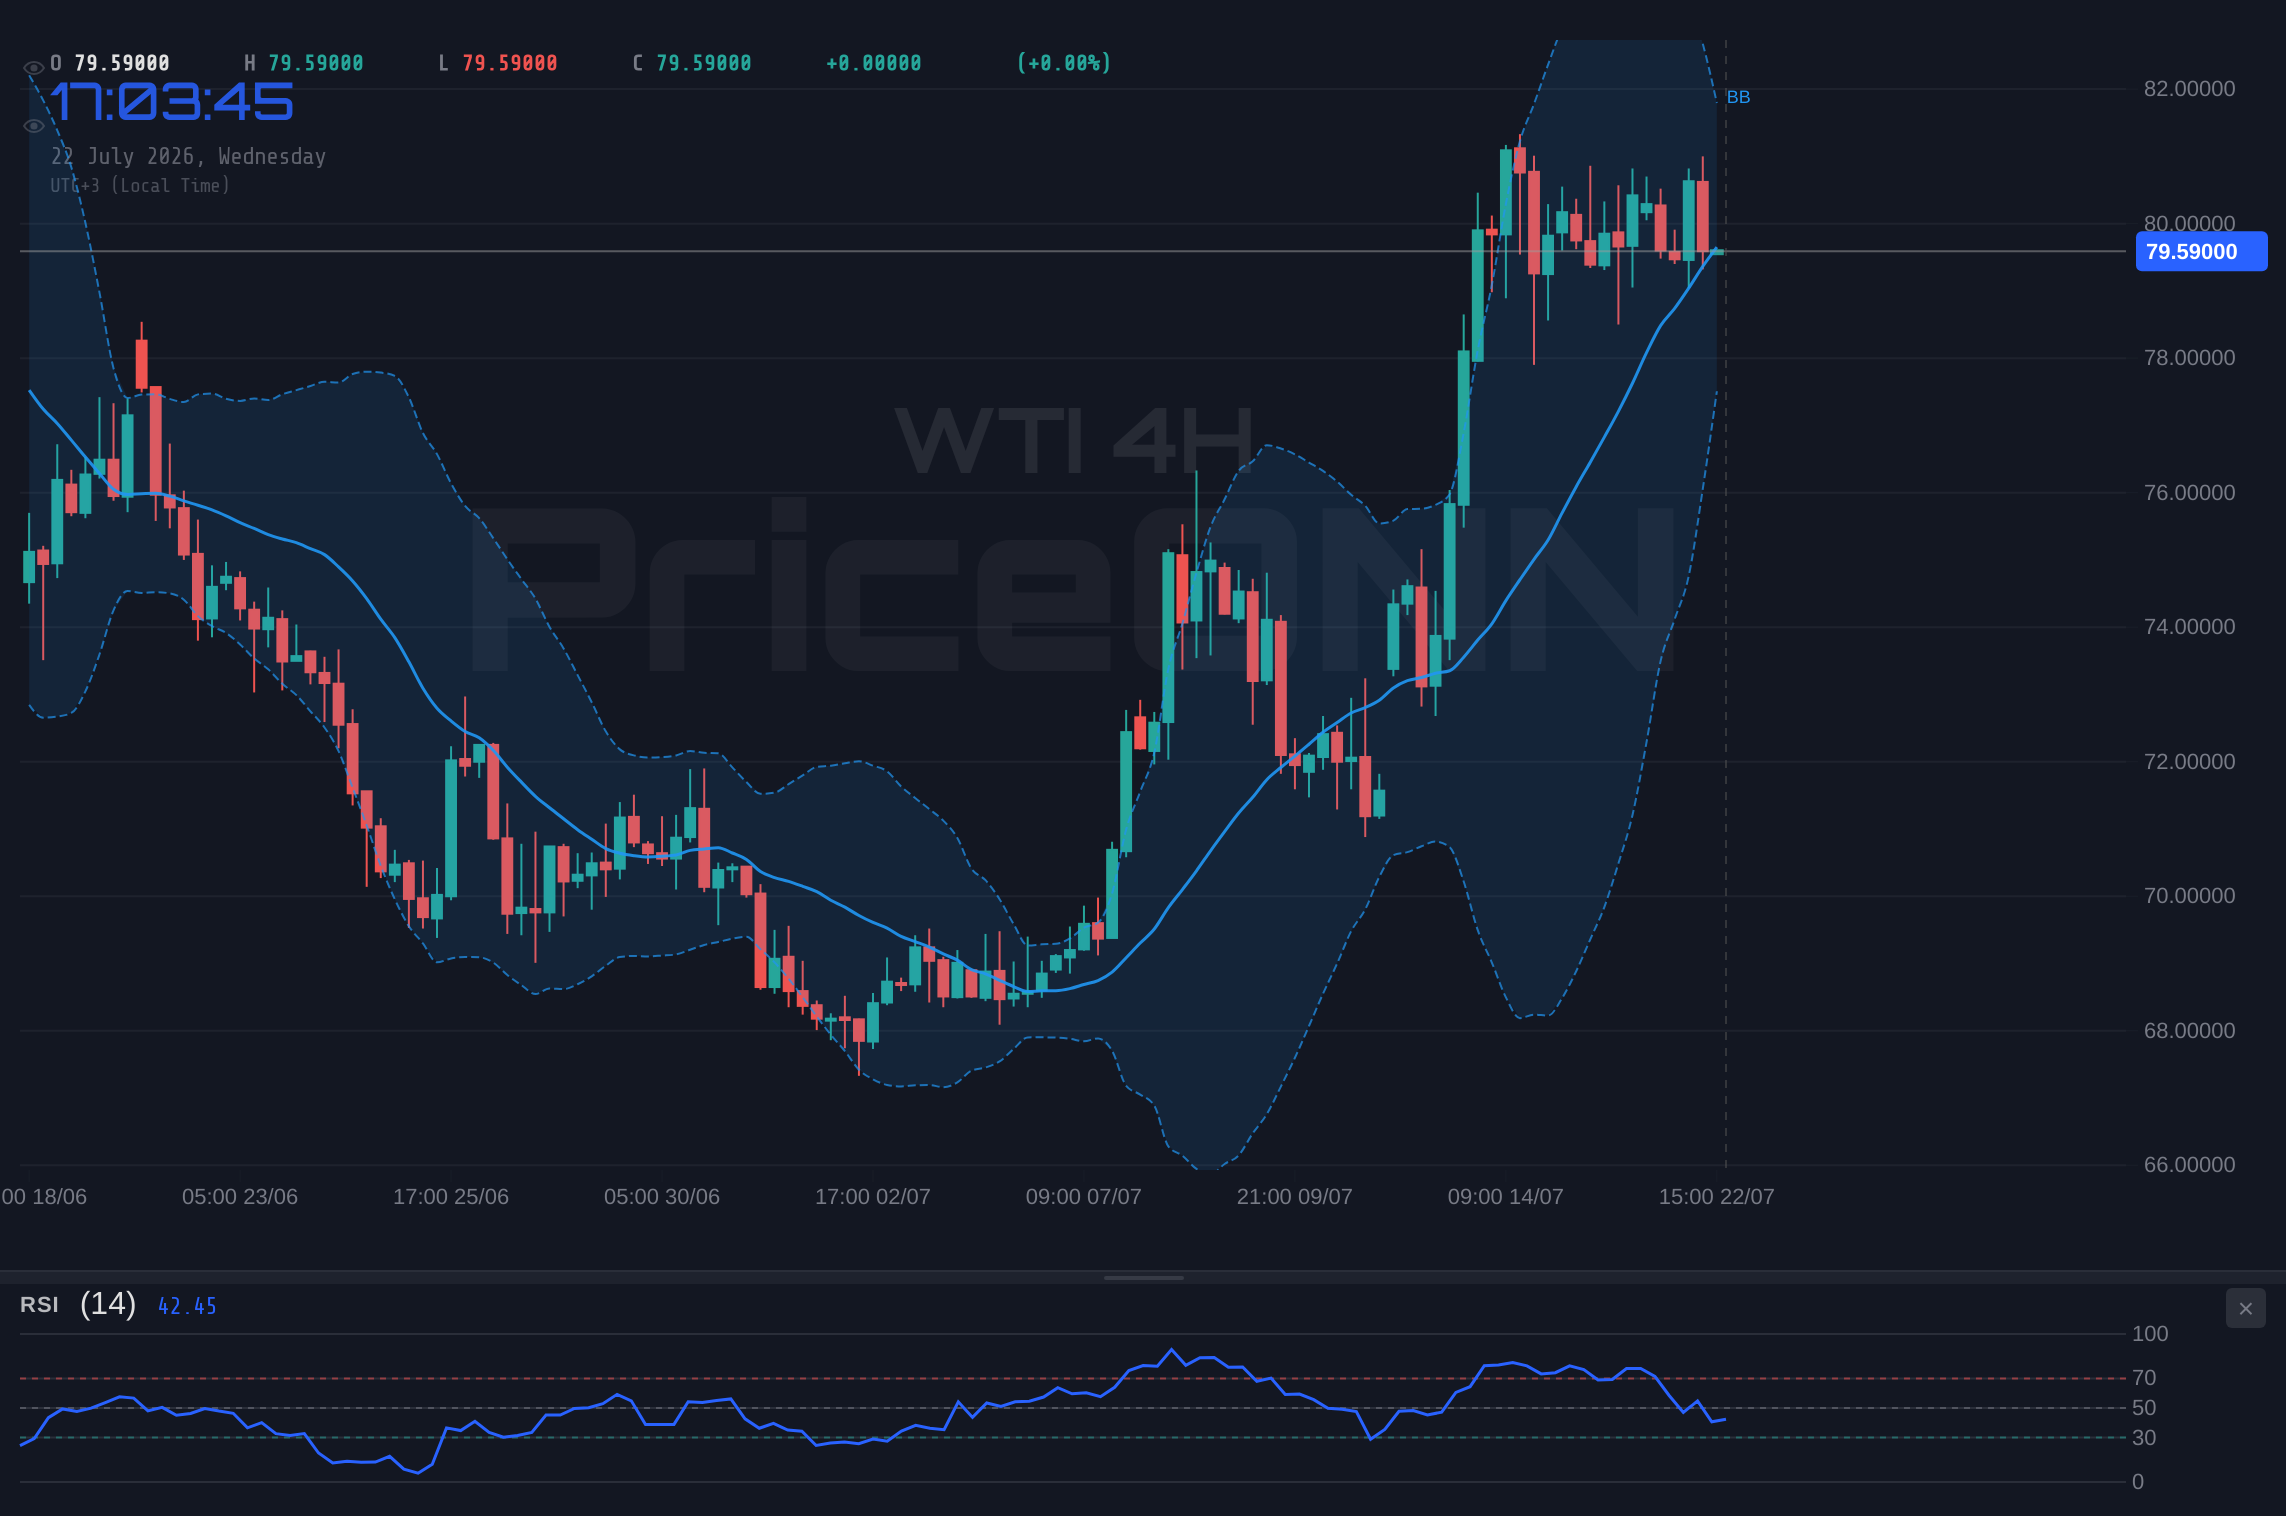
The daily timeframe offers the most comprehensive view of WTI's longer-term trajectory. Here, the ADX is at 29.46, again pointing towards a strong trend that is currently in motion. The overall signal leans heavily towards 'BUY' (7 buys, 1 sell), suggesting that from a daily perspective, the longer-term outlook might be more constructive. The RSI(14) at 53.65 is neutral, indicating neither overbought nor oversold conditions, leaving room for price appreciation. The MACD is positive, with the MACD line above its signal line, supporting the idea of upward momentum. The Stochastic Oscillator, with %K at 89.73 and %D at 76.8, is firmly in overbought territory and flashing a strong bullish signal, indicating that buyers have been in control. This daily bullish bias, however, must be considered in the context of shorter-term pressures and the broader macroeconomic environment.
Navigating the Cross-Market Currents: DXY and Equities
The performance of WTI Crude is inextricably linked to the broader financial markets, particularly the US Dollar Index (DXY) and major equity indices like the S&P 500 and Nasdaq. The DXY, currently trading at 100.70, is showing strength, which typically acts as a headwind for oil prices. A stronger dollar makes oil, priced in dollars, more expensive for holders of other currencies, potentially dampening demand. The 1-hour chart for the DXY shows a bullish signal (5 buys, 3 sells), and the RSI at 56.6 is in neutral territory with an upward eğilim, supporting the dollar's current strength. The daily DXY chart, however, presents a more neutral picture (4 buys, 4 sells), with the RSI at 51.34 and a bearish MACD signal, suggesting that the dollar's rally might face headwinds in the longer term.
The correlation between oil prices and equity markets is also a critical factor. The S&P 500 is currently trading at 6572.87, showing a daily gain of 0.74%, indicating a risk-on sentiment in equities. This positive correlation suggests that as equities rise, demand for oil might increase, supporting prices. However, the technicals on the S&P 500 1-hour chart show a 'BUY' signal (5 buys, 3 sells), but the RSI at 70.95 is in overbought territory, hinting at a potential pullback. The Nasdaq 100, conversely, is down 1.16% at 29164.86, showing a weaker risk appetite in the tech sector. The 1-hour Nasdaq chart is bearish (1 buy, 7 sells), with RSI at 32.77, indicating selling pressure. This divergence between the S&P 500 and Nasdaq adds another layer of complexity, suggesting that the overall risk sentiment is mixed, which could translate into choppy trading for WTI.
The prevailing narrative around interest rates and central bank policy also plays a significant role. With inflation data and employment figures constantly influencing market expectations, the path of monetary policy remains a key driver. If the Federal Reserve signals a more hawkish stance, perhaps due to persistent inflation concerns, it could strengthen the dollar and put pressure on commodities like oil. Conversely, any indication of a dovish pivot or a pause in rate hikes could support risk assets and potentially boost oil demand. The current market pricing reflects ongoing uncertainty about the timing and extent of future policy adjustments, making it crucial to monitor economic calendar events for clarity.
Geopolitical Tensions and Supply Chain Dynamics
The energy market, particularly crude oil, is highly sensitive to geopolitical developments. Ongoing tensions in the Middle East, for instance, can rapidly disrupt supply routes and create upward price pressure as traders factor in potential supply shortages. While the provided market data doesn't detail specific geopolitical events, the general elevated risk environment often translates into a 'risk premium' embedded in oil prices. Events like the recent news regarding USD/JPY hitting a multi-decade high and lingering US-Iran tensions, as mentioned in the recent news feed, highlight the interconnectedness of global events and their potential impact on commodity markets. A stronger Yen, for example, could indirectly signal broader economic shifts that might influence global oil demand, even if the direct correlation is less obvious.
Furthermore, the structural aspects of oil production and refining capacity cannot be overlooked. Factors such as OPEC+ production quotas, inventory levels reported by the EIA, and the operational status of key refineries all contribute to the supply-demand balance. Any disruptions to these fundamental elements, whether due to natural disasters, geopolitical interventions, or maintenance issues, can lead to significant price volatility. For example, news of refinery issues in a major producing region could quickly support prices, even if broader demand signals are weak. The current price action for WTI, while showing some bearish signals on shorter timeframes, is also influenced by these underlying supply-side considerations.
The interplay between industrial metals like gold and silver and energy commodities like WTI also warrants attention. Gold has shown resilience, rising despite higher oil and yields, suggesting a potential shift in market dynamics where inflation hedges are regaining favor. Silver, while attempting to break out of its range, also plays a dual role as an industrial metal and a safe-haven asset. These movements in related commodity markets can sometimes provide directional clues or indicate broader shifts in investor sentiment that might eventually spill over into the crude oil market. The fact that gold is defying higher oil prices suggests that market participants might be prioritizing inflation protection over pure commodity plays, a nuance that could impact WTI's trajectory.
Intermarket Analysis and Trading Scenarios
Considering the technical indicators and the broader market context, a nuanced approach to WTI trading is essential. The 1-hour chart presents a bearish bias with a weak trend, while the 4-hour and daily charts show stronger bullish signals, albeit with mixed indicator readings. This creates a scenario where short-term traders might be looking for opportunities to sell on rallies, targeting the support level at $78.99, while longer-term investors might view dips as potential buying opportunities, anticipating a continuation of the longer-term bullish trend. The critical support level at $78.99, derived from the 1-hour data, is a key area to watch. A decisive break below this level could trigger further selling pressure, potentially testing the next support at $78.63.
On the upside, resistance is initially seen at $79.83 on the 1-hour chart. A sustained move above this level, coupled with confirmation from other indicators and a broader risk-on sentiment, could pave the way for testing higher resistance levels. The 4-hour resistance at $81.29 and the daily resistance at $81.35 become more significant targets if the bullish momentum can overcome the current short-term headwinds. The divergence between the strong daily bullish signals and the weaker 1-hour bearish signals suggests that the market is at an interesting crossroads. Patience and a clear strategy based on confirmed breakouts or breakdowns will be crucial for navigating this period.
Trade Scenarios for WTI Crude
Bearish Scenario: Testing the Depths
65% ProbabilityNeutral Scenario: Consolidation and Indecision
25% ProbabilityBullish Scenario: Reclaiming the Highs
10% ProbabilityThe energy market remains susceptible to rapid shifts due to geopolitical events and OPEC+ decisions. Traders should exercise caution and employ strict risk management, especially given the mixed signals across different timeframes and the current high level of market volatility.
The path forward for WTI Crude oil appears to be one of cautious navigation. While shorter-term indicators suggest potential downside, the longer-term daily charts present a more optimistic view, albeit with mixed technical signals. The critical support at $78.99 will be the immediate focus; a break below it could signal a deeper correction. Conversely, a sustained move above the $80.17 resistance, supported by positive macro developments and a clear risk-on sentiment, could reignite bullish momentum. Investors and traders must remain vigilant, closely monitoring key price levels, the DXY's movement, and any significant geopolitical news that could influence the energy landscape. Patience in waiting for clear setups and disciplined risk management remain the cornerstones of successful trading in this dynamic market.
Frequently Asked Questions: WTI Analysis
What happens if WTI breaks below the $78.99 support level?
A break below $78.99 would invalidate the current neutral stance and likely trigger a move towards the next support at $78.63. This scenario is assigned a 65% probability, suggesting significant downside potential.
Should I buy WTI at current levels near $79.59 given the mixed signals?
Buying at current levels carries risk due to conflicting short-term and long-term signals. A confirmed breakout above $80.17 resistance, with a bullish risk-on sentiment, would be a more prudent entry point, carrying a 10% probability currently.
Is the RSI at 58.47 on the 4-hour chart a buy signal for WTI?
An RSI of 58.47 is in neutral territory with a slight upward eğilim, suggesting room for growth but not a strong buy signal on its own. It needs confirmation from other indicators and price action breaking key resistance levels.
How will the strong DXY at 100.70 affect WTI Crude this week?
The strong DXY typically puts downward pressure on oil prices as it makes dollar-denominated commodities more expensive. This could contribute to a bearish scenario for WTI, especially if the dollar continues to rally towards its daily resistance.
Track markets in real-time
AI-powered analysis, technical indicators and real-time price data.
Join Our Telegram Channel
Breaking market news, AI analysis and trading signals instantly.
Join Channel