

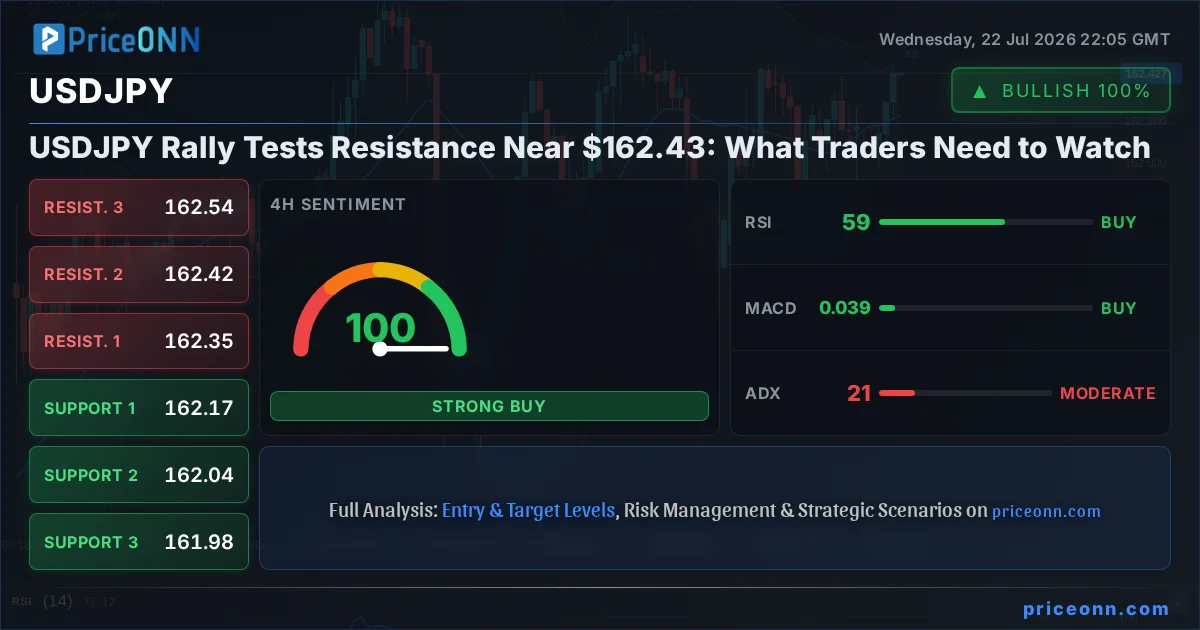
The relentless upward march of USDJPY has brought it to a critical juncture, currently trading around the $162.43 mark. This ascent, fueled by a potent combination of a strengthening US Dollar and a persistently weakening Japanese Yen, presents a complex picture for traders. The Yen's decline is not merely a currency pair fluctuation; it represents a significant shift in market sentiment, with the Yen hitting fresh four-decade lows and breaking above the 163 level, as reported by news outlets. This move is occurring despite attempts by Japan to defend its currency, highlighting the immense market forces at play. Understanding the interplay between the Dollar's strength, the Yen's weakness, and the broader market's risk appetite is crucial for navigating this volatile landscape. As we dissect the technical indicators and fundamental drivers, the question remains: can USDJPY sustain this rally, or are we on the cusp of a significant reversal?
- USDJPY is currently trading at $162.43, with the 1H chart showing a neutral trend but a strong 95% upward trend on the 4H and 79% on the daily timeframe.
- Key resistance is forming around $162.428 on the daily chart, while immediate support is found at $161.902.
- RSI at 60.52 on the daily chart suggests a bullish inclination, though it remains in neutral territory, indicating room for further upward movement before overbought conditions arise.
- The Dollar Index (DXY) is at 100.7, showing a mixed signal across timeframes, but its upward momentum on the 1H suggests potential continued pressure on the Yen.
Navigating the Yen's Plunge: A Multi-Timeframe Perspective
The USDJPY pair is currently the epicenter of attention, with its ascent past the 162.00 level signaling a potential continuation of its powerful rally. On the 1-hour chart, the trend appears neutral with a 50% strength, but this short-term indecision belies the stronger forces at play on longer timeframes. The 4-hour chart paints a decidedly bullish picture, with a trend strength of 95%, indicating a firm upward momentum. Similarly, the daily timeframe also shows a strong bullish trend at 79% strength. This multi-timeframe alignment suggests that the current price action, hovering around $162.43, is part of a larger, established upward move. The Stochastic Oscillator on the daily chart, with K at 78.93 and D at 75.09, is firmly in bullish territory and showing a clear upward signal (%K > %D), reinforcing the bullish outlook. However, the ADX at 18.76 on the daily chart indicates a weak trend, suggesting that while the direction is up, the conviction behind the move might not be as strong as the price action implies, leaving room for consolidation or pullbacks.
The RSI on the daily chart is at 60.52, comfortably within the neutral zone but leaning towards bullish territory, implying there is still room for the pair to appreciate before hitting overbought conditions. This suggests that momentum traders might find opportunities for further upside. The MACD, however, presents a slightly more cautious signal on the daily chart, showing negative momentum with the MACD line below its signal line. This divergence between the RSI and MACD on the daily timeframe warrants attention, as it could signal a potential loss of upward steam despite the overall bullish trend. On the 1-hour chart, the MACD is also showing negative momentum, which aligns with the short-term neutral trend observed. This technical nuance suggests that while the broader trend is upward, the immediate path forward may involve some choppiness or consolidation as the market digests the recent gains.
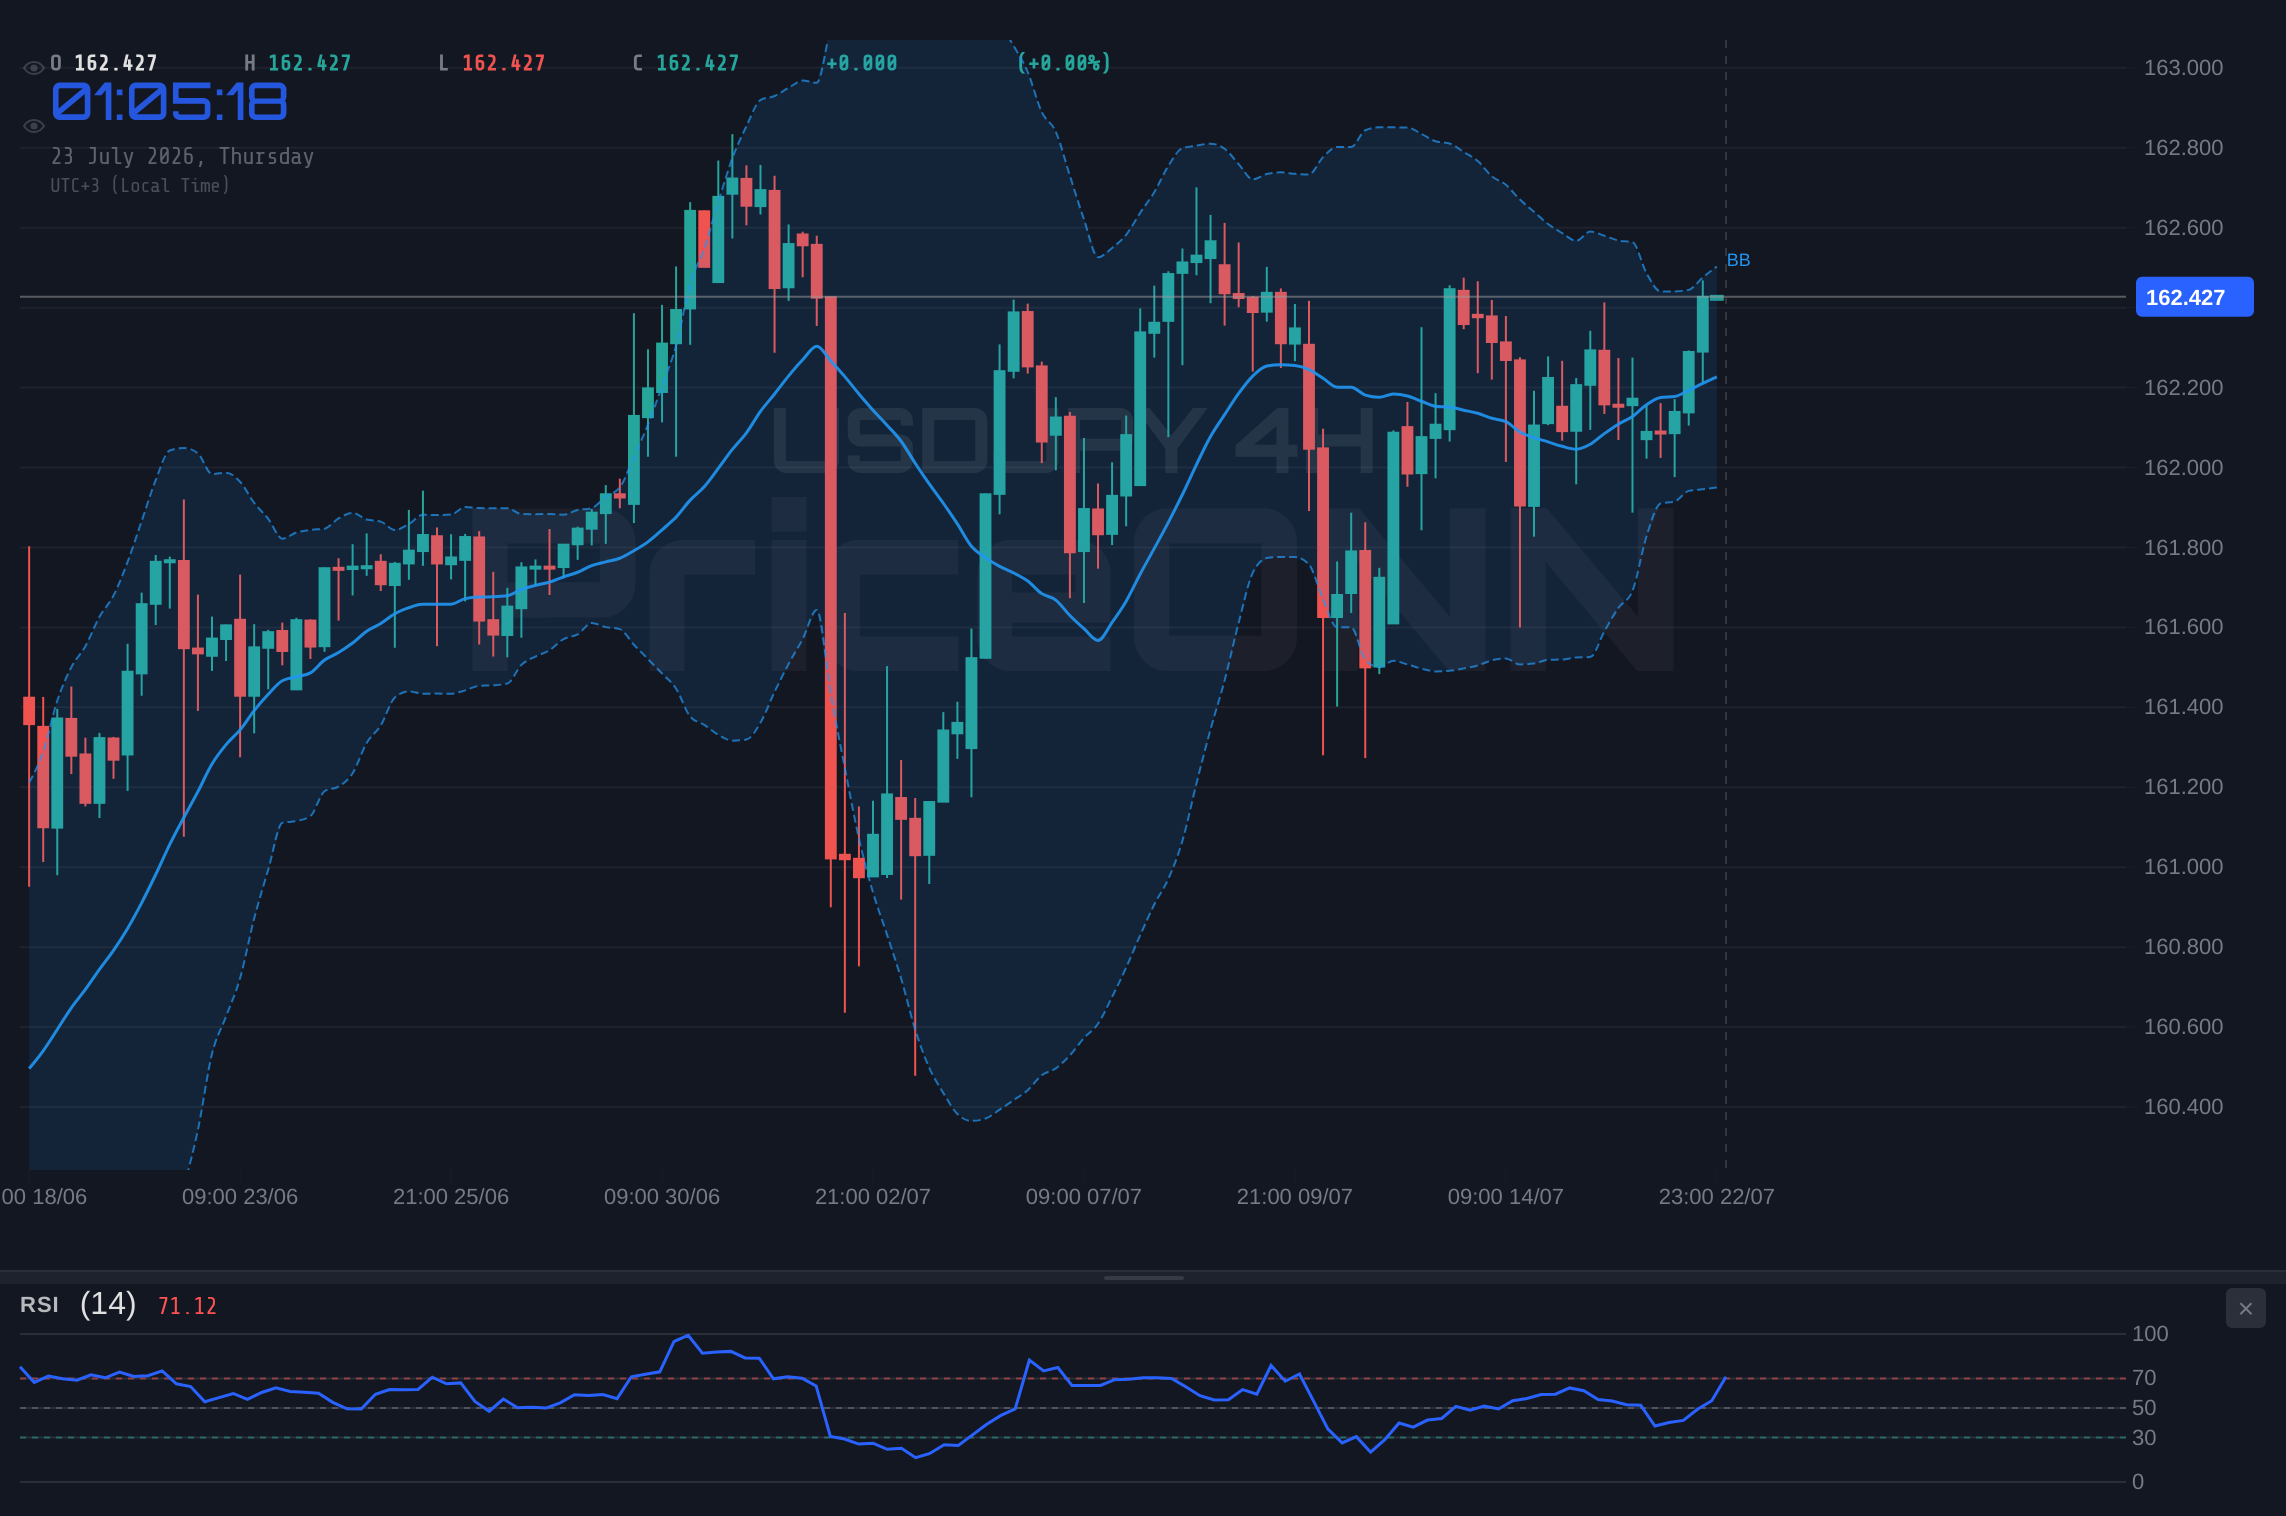
The Bollinger Bands on the daily chart are positioned above the middle band, confirming the bullish uptrend. However, the Stochastic Oscillator's position in the overbought zone (K=78.93, D=75.09) on the daily chart is a signal to watch for potential profit-taking or a temporary stall in the rally. This is a classic scenario where strong upward momentum might lead to a period of consolidation or a minor retracement before the next leg higher, if one materializes. The ADX value of 18.76 on the daily chart is a critical piece of information; it signifies a weak trend. This means that while the price is moving up, the underlying trend strength isn't robust. This could imply that the move is driven more by sentiment and less by strong, sustained buying pressure, making it vulnerable to sharp reversals if market conditions shift.
On the 4-hour chart, the Stochastic Oscillator is showing a rising signal (%K > %D) with K at 72.43 and D at 58.51, reinforcing the bullish sentiment. The RSI is at 58.89, also supportive of further gains. The MACD on this timeframe is positive, aligning with the overall bullish picture. The ADX here is 20.71, indicating a moderately strong trend, which is more encouraging than the daily timeframe's weak trend reading. This suggests that the 4-hour trend has more conviction. The confluence of these indicators on the 4-hour chart provides a stronger case for continued upside potential, even as the daily chart presents some cautionary signals regarding trend strength and MACD momentum.
The Dollar's Dominance and the Yen's Vulnerability: A Macroeconomic Dance
The fundamental drivers behind the USDJPY's ascent are multifaceted, extending beyond pure technicals. The US Dollar Index (DXY) is currently at 100.7, exhibiting mixed signals across different timeframes. While the 1-hour chart shows positive momentum and the Stochastic in the overbought zone, the daily chart suggests negative momentum. However, the overall upward bias on the 1-hour chart, coupled with its current price, indicates that the dollar is not a pushover and continues to exert pressure. This strength in the dollar is a significant factor for USDJPY, as a stronger dollar naturally bids up the pair.
The Japanese Yen, on the other hand, appears to be in a precarious position. News reports highlight that the Yen has tumbled to a four-decade low, breaking above the 163 mark. This is a critical development, suggesting that the Bank of Japan's (BOJ) efforts to defend the currency may be faltering or insufficient against prevailing market sentiment. The carry trade, where investors borrow in low-interest-rate currencies like the Yen to invest in higher-yielding assets, likely remains a significant factor. With interest rate differentials between Japan and major economies like the US remaining wide, the incentive to sell the Yen is substantial. This structural weakness in the Yen, combined with a relatively robust US economy and the Federal Reserve's potentially hawkish stance on inflation, creates a powerful tailwind for USDJPY.
Geopolitical tensions, particularly in the Middle East, are also playing a role, though perhaps not in the way one might initially expect. While escalating conflicts often lead to a 'risk-off' sentiment that could benefit safe-haven currencies like the Yen, the current market reaction seems to be dominated by other factors. Oil prices have climbed due to these tensions, which could feed into inflation expectations. This might indirectly support the US Dollar if it leads the Federal Reserve to maintain a tighter monetary policy. The fact that gold is also showing resilience, despite higher oil and yields, suggests a complex market environment where traditional safe-haven dynamics might be temporarily overshadowed by currency-specific pressures and rate differentials.
The recent Consumer Price Index (CPI) data from New Zealand, showing a rise in annual inflation to 4.1%, underscores the global inflationary environment. While this is specific to NZD, it highlights that inflation remains a concern for many central banks, potentially reinforcing the narrative of higher-for-longer interest rates in key economies. This environment is generally supportive of currencies from countries with higher yields, like the US, and detrimental to those with ultra-low rates, like Japan. The market seems to be pricing in continued divergence in monetary policy, with the Fed potentially keeping rates elevated while the BOJ remains accommodative, thereby widening the interest rate differential and increasing the attractiveness of shorting the Yen.
Key Levels and Trade Scenarios: Charting the Path Forward
The technical landscape for USDJPY is defined by key support and resistance levels that traders are closely watching. On the daily chart, the immediate support is identified at $161.902, followed by $161.631 and $161.376. These levels represent areas where buying interest could emerge, potentially halting or reversing the downward momentum if a pullback occurs. Conversely, resistance is forming around $162.428, with further levels at $162.683 and $162.954. The current price of $162.43 is precariously close to this initial daily resistance, making it a critical zone to monitor. A decisive break above $162.428 could open the door for a move towards the higher resistance levels, while failure to breach it might lead to a test of the support levels.
The 4-hour chart offers slightly different levels, with support at $162.165, $162.041, and $161.977. Resistance is seen at $162.353, $162.417, and $162.541. The proximity of the 4-hour resistance to the current price suggests that short-term traders might be looking for an entry point near these levels. The 1-hour chart provides even tighter levels, with support at $162.392 and resistance at $162.455. The narrow range on the 1-hour chart, amidst the broader uptrend, highlights the potential for a short-term breakout or breakdown.
Bearish Scenario: Yen Reassertion
35% ProbabilityNeutral Scenario: Consolidation Near Resistance
30% ProbabilityBullish Scenario: Momentum Continues
35% ProbabilityThe market sentiment is currently leaning towards a bullish continuation, given the strong uptrend on the 4-hour and daily charts. However, the proximity to daily resistance at $162.428 presents a significant hurdle. A break above this level, confirmed by strong volume and perhaps positive news flow or continued dollar strength, would validate the bullish scenario. Conversely, failure to break this resistance and a subsequent drop below the $161.902 support level could signal a shift towards the bearish scenario, potentially exacerbated by intervention fears or a sudden change in risk sentiment. The neutral scenario anticipates a period of consolidation as the market digests the recent gains and awaits further catalysts, which is plausible given the mixed signals from different timeframes and indicators.
Market Correlations and Broader Implications
Analyzing USDJPY in isolation would be a disservice to its interconnectedness with global markets. The Dollar Index (DXY) at 100.7 is a key correlation to watch. While its signals are mixed, the upward pressure on the 1-hour chart could continue to support USDJPY. If the DXY were to break decisively above its resistance levels and maintain that momentum, it would further bolster the case for USDJPY's upside. Conversely, a sharp decline in the DXY could act as a headwind for USDJPY, even if the Yen remains weak.
Equity markets, represented by the S&P 500 at 6572.87 and Nasdaq 100 at 29164.86, present a mixed picture. The S&P 500 shows a bullish trend on the 1-hour and 4-hour charts, while the daily chart leans bearish. The Nasdaq 100, however, is showing a stronger bearish trend on multiple timeframes, suggesting a potential risk-off sentiment in the tech sector. This divergence is interesting. Typically, a risk-off environment might see a strengthening Yen as a safe-haven asset. However, the Yen's current weakness implies that other factors, like interest rate differentials, are overpowering traditional safe-haven flows. This decoupling is a significant theme to monitor.
Oil prices, with Brent at $83.79 and WTI at $79.59, are showing a bearish trend on the 1-hour chart but a bullish inclination on longer timeframes. The geopolitical tensions in the Middle East are a primary driver here. If oil prices continue to climb due to escalating conflicts, it could fuel inflation concerns. This might indirectly support the US Dollar, as mentioned earlier, by potentially keeping the Federal Reserve on a tighter leash regarding interest rate cuts. However, a significant surge in oil prices could also trigger broader risk aversion, which might, in theory, benefit the Yen. The current market is navigating these conflicting forces, leading to the nuanced performance we see.
Gold prices, currently around $4001.21, are also showing a bearish trend across multiple timeframes, despite geopolitical risks that typically support the precious metal. This resilience in gold, even as it trends lower, could be interpreted as a sign of underlying market anxiety that isn't translating into traditional safe-haven plays like the Yen. The fact that gold is defying higher oil and yields, as noted in recent market commentary, suggests a potential regime shift where traditional correlations are breaking down. This environment makes directional bets on currency pairs like USDJPY more challenging, as the usual macro anchors seem to be less reliable.
Frequently Asked Questions: USDJPY Analysis
What happens if USDJPY breaks decisively above the $162.428 resistance level?
A sustained break above $162.428, confirmed by strong volume, would validate the bullish scenario. This could trigger a move towards the next resistance levels at $162.683 and potentially $162.954, driven by continued dollar strength and Yen weakness. The probability of this scenario playing out is estimated at 35%.
Should I consider buying USDJPY at current levels near $162.43 given the mixed daily MACD signal?
Buying at current levels carries risk due to the proximity to daily resistance and the bearish MACD signal. A more prudent approach might be to wait for confirmation of a breakout above $162.428 or for a pullback to support levels like $161.902. The probability of a continued rally from here is estimated at 35%, but risk management is key.
Is the RSI at 60.52 a strong buy signal for USDJPY on the daily chart?
An RSI of 60.52 indicates bullish momentum but is not yet in overbought territory. While it supports further upside potential, it's not a standalone buy signal. Confirmation from other indicators, like a bullish MACD crossover or a break of resistance, would strengthen the bullish case. Currently, it suggests room for growth before overbought conditions are met.
How might the ongoing Middle East tensions impact USDJPY, given oil's upward trend?
Escalating Middle East tensions could push oil prices higher, potentially fueling inflation fears. This might indirectly support the US Dollar by reinforcing expectations of tighter Fed policy, thus supporting USDJPY. However, extreme risk aversion could also strengthen the Yen, creating conflicting pressures. The net effect remains uncertain, but the current market is prioritizing interest rate differentials.
The path forward for USDJPY is complex, shaped by the tug-of-war between a robust US Dollar, a vulnerable Yen, and shifting global risk sentiment. While technical indicators on longer timeframes suggest continued upside potential, the immediate resistance at $162.428 and the mixed signals on shorter timeframes warrant caution. Traders should remain vigilant for confirmation of a breakout or a potential reversal. The interplay of monetary policy divergence, geopolitical events, and market correlations will be key determinants of USDJPY's trajectory in the coming sessions.
Technical Outlook Summary
| Indicator | Value | Signal | Interpretation |
|---|---|---|---|
| RSI (14) | 60.52 | Bullish | Neutral zone, leaning up; room for gains. |
| MACD Histogram | -0.04 | Bearish | Negative momentum on daily; caution advised. |
| Stochastic | K:78.93, D:75.09 | Bullish | Overbought zone on daily; watch for profit-taking. |
| ADX | 18.76 | Neutral | Weak trend strength on daily; potential for consolidation. |
| Bollinger | Middle Band | Watch | Price above middle band confirms uptrend. |
Key Levels
Support Levels
Resistance Levels
Track markets in real-time
AI-powered analysis, technical indicators and real-time price data.
Join Our Telegram Channel
Breaking market news, AI analysis and trading signals instantly.
Join Channel