

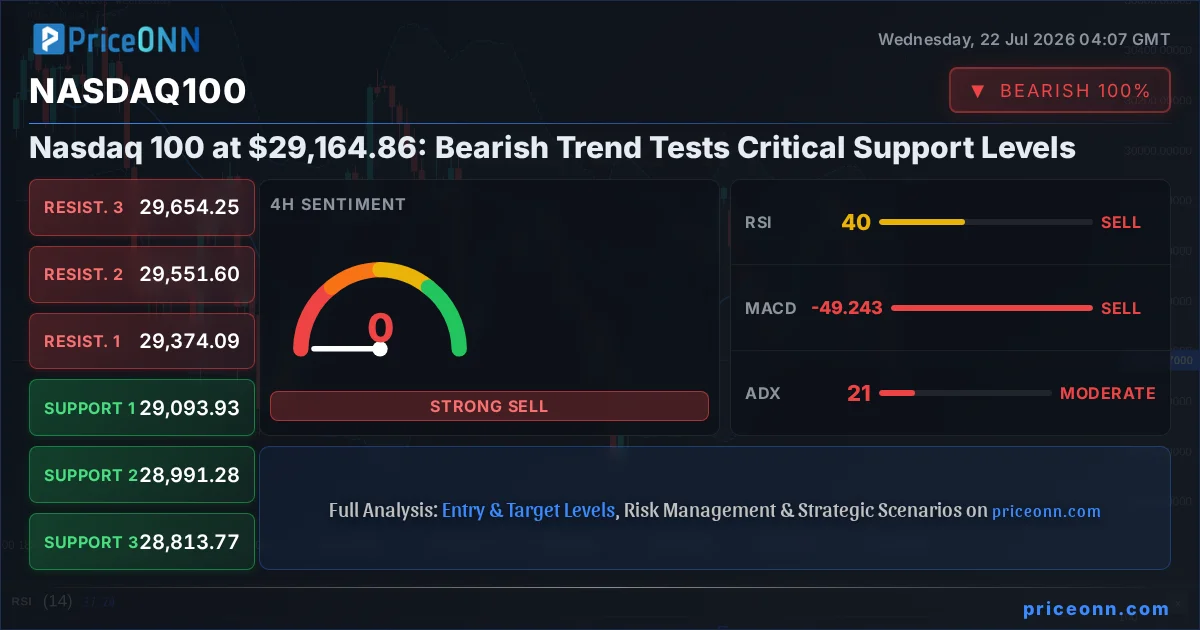
Nasdaq 100 today analysis reveals a market teetering on the edge, with the index currently priced at $29,164.86. The bearish trend is palpable, and traders are closely watching as the index approaches critical support levels. This isn't just another market fluctuation; it's a moment where the underlying strength of the tech-heavy Nasdaq is being severely tested. The question on everyone's mind is whether the bulls can muster a defense, or if the bears will continue their relentless push lower. Understanding the confluence of technical indicators and market sentiment is crucial for navigating this volatile period.
- The Nasdaq 100 is trading at $29,164.86, exhibiting a bearish trend across multiple timeframes.
- Critical support sits at $29,135.55, a level that has been tested on the 1-hour chart, with further support at $29,076.62.
- The RSI at 32.77 on the 1-hour chart signals bearish momentum, while the MACD histogram shows negative momentum.
- Current market sentiment is heavily influenced by broader risk-off appetite, potentially correlating with DXY's current strength at 100.7.
Navigating the Bearish Tide: A Multi-Timeframe Perspective
The Nasdaq 100's current position at $29,164.86 paints a concerning picture for those betting on a continued rally. Across the analyzed timeframes, the trend predominantly leans bearish, especially when looking at the daily chart where the trend strength is rated at 83%. The 1-hour chart, while showing a 50% trend strength, still indicates negative momentum via the MACD and a RSI reading of 32.77, suggesting sellers are in control. This technical setup is not one for the faint of heart. The downward pressure is evident, and any attempt at a recovery will need to overcome significant headwinds. The ADX at 33.23 on the 1-hour chart confirms a strong downtrend is in play, underscoring the immediate bearish bias.
Diving deeper into the 4-hour timeframe, the trend is neutral with a 50% strength, but the indicators continue to echo the bearish sentiment. The MACD is firmly in negative territory, and the Stochastic oscillator is giving a bearish signal with %K below %D. This suggests that even in a seemingly neutral trend, the underlying pressure is downward. The ADX here is 21.06, which, while indicating a moderate trend, still leans towards a prevailing downtrend rather than consolidation. It's this persistent bearish undertone across multiple timeframes that forms the crux of our analysis today. The market isn't just selling off; it's showing signs of a potential deeper decline if key support levels fail.
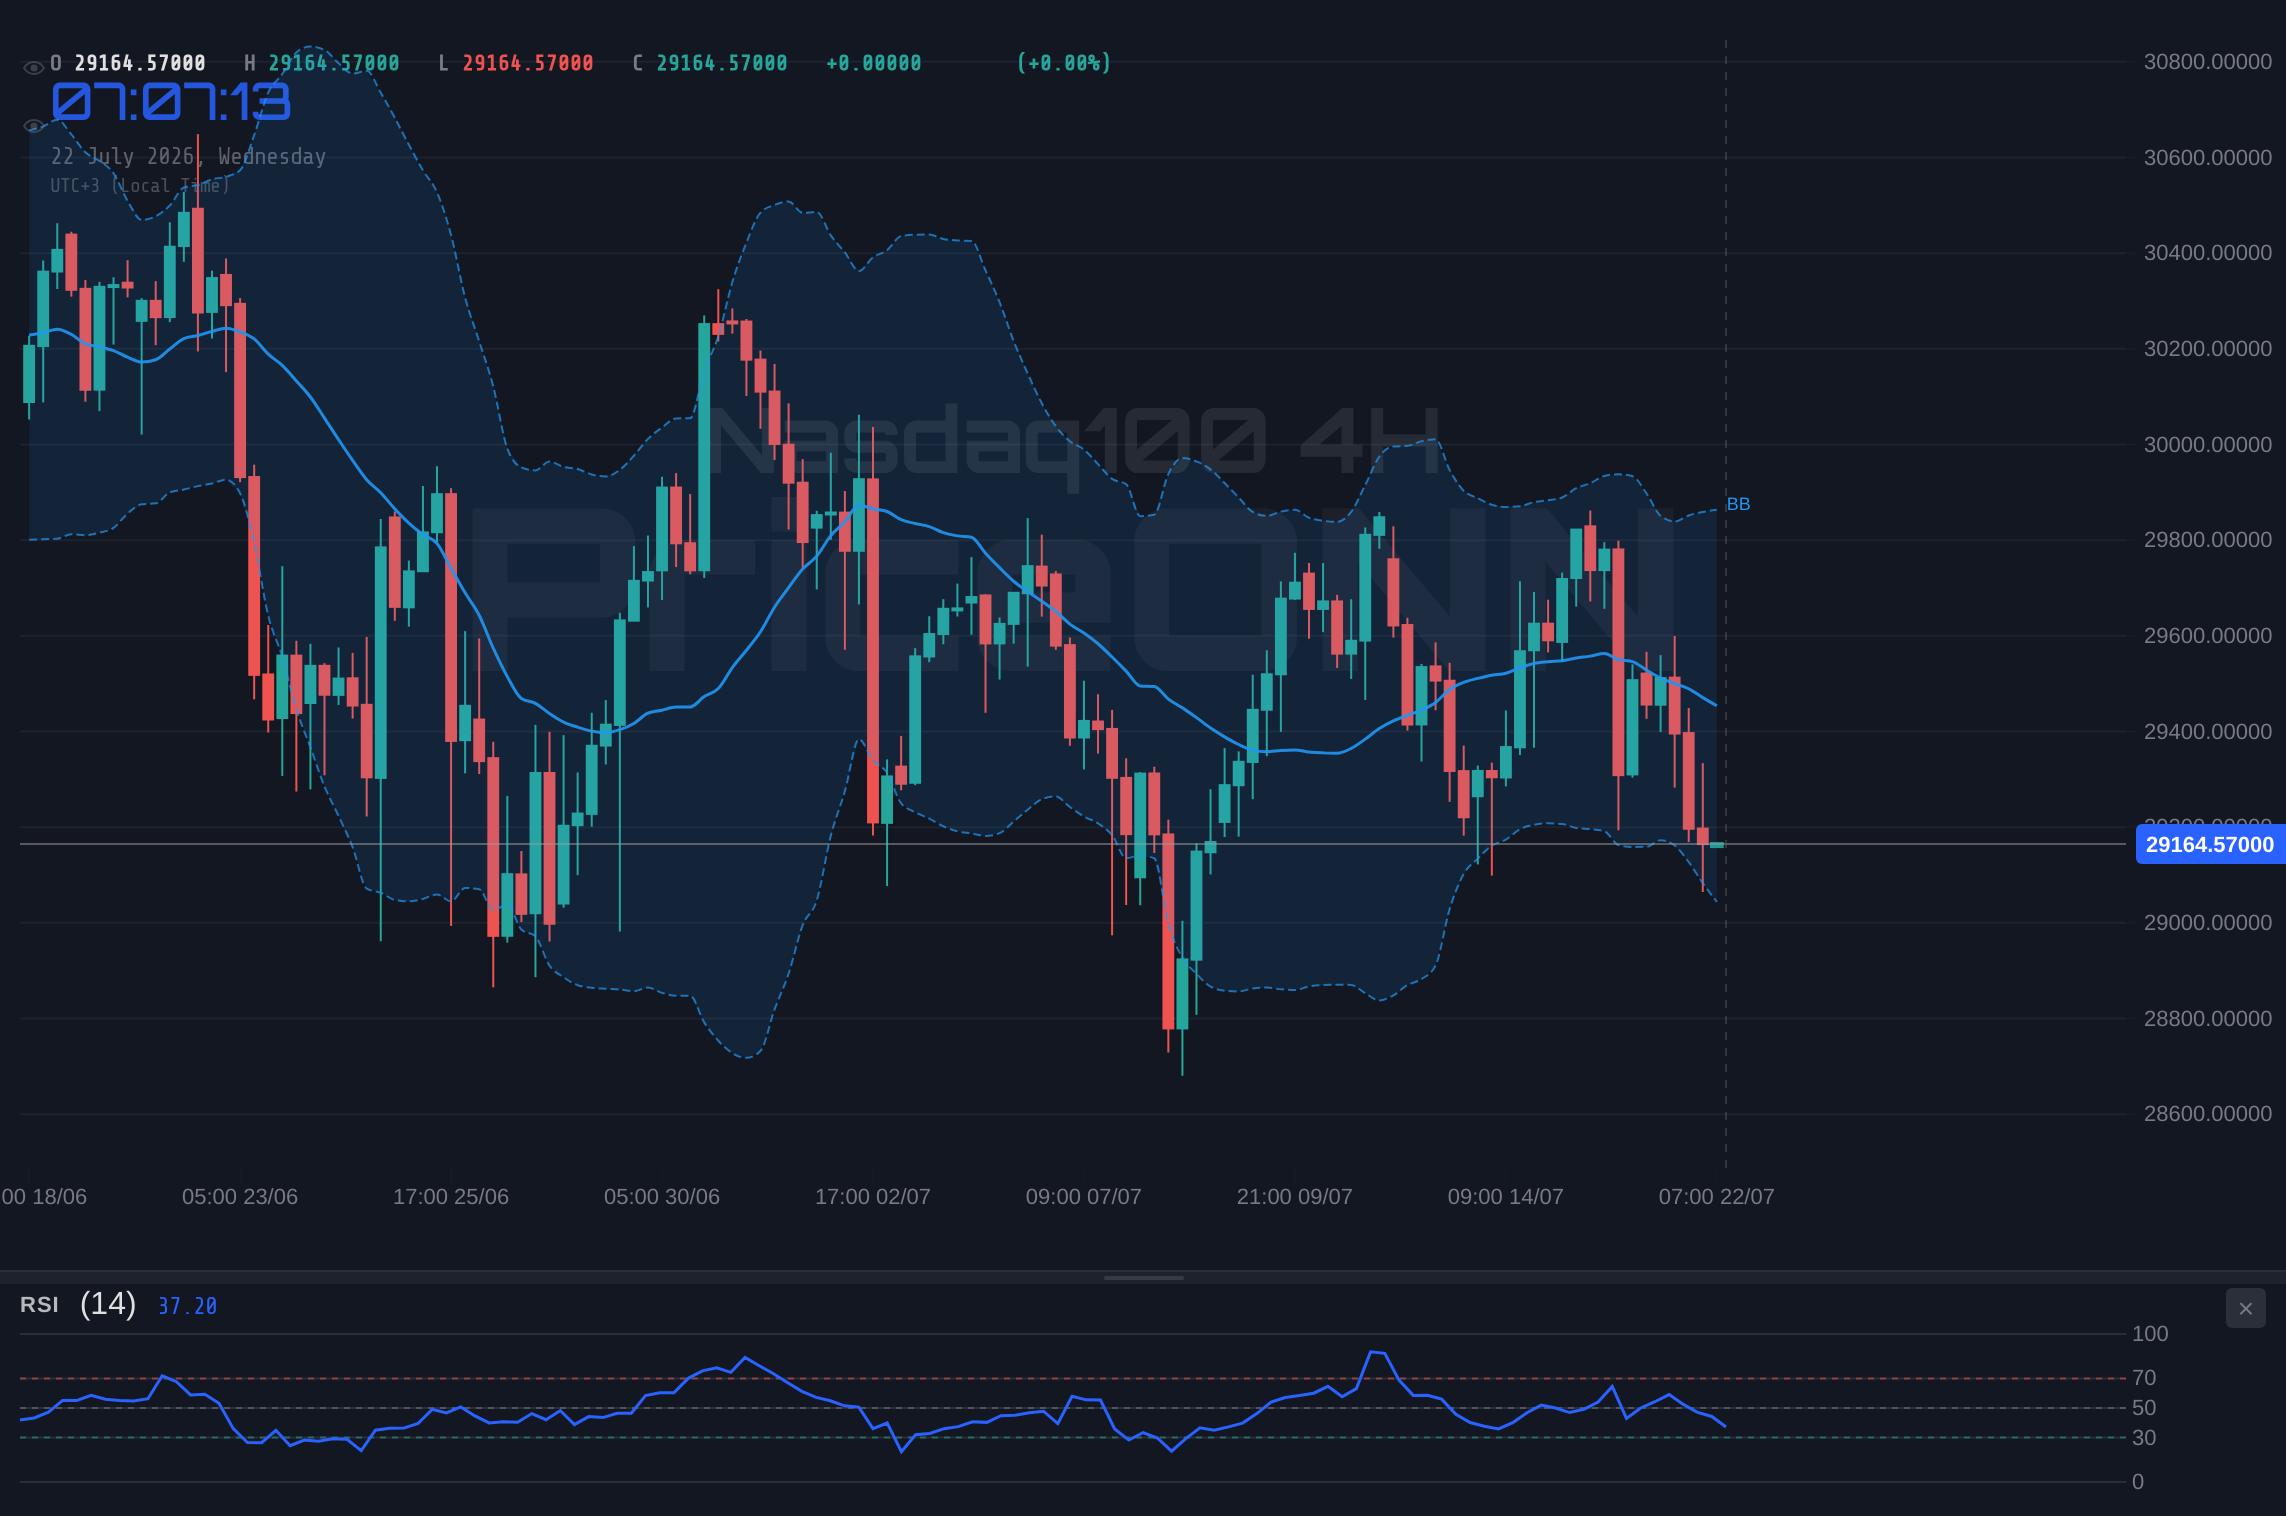
On the daily chart, the picture becomes even clearer. The trend is definitively bearish with a strength of 83%, and the ADX at 15.12, though a weaker trend strength, still points to a persistent downward move. The RSI at 46.36 is hovering in neutral territory but leaning towards oversold, which could suggest a potential for a bounce, but the MACD is still showing negative momentum, firmly below its signal line. The Bollinger Bands are also trading below the middle band, reinforcing the bearish sentiment. This consistent signal across different analytical windows provides a robust foundation for understanding the current market dynamics. The strength of the bearish trend on the daily chart, coupled with the immediate pressure seen on the shorter timeframes, suggests that the path of least resistance is currently downwards for the Nasdaq 100.
The Crucial Levels: Where the Battle for Nasdaq 100 Will Be Fought
In any market analysis, identifying key support and resistance levels is paramount. For the Nasdaq 100, currently trading at $29,164.86, these levels are not merely numbers on a chart; they represent potential turning points and battlegrounds for bulls and bears. On the 1-hour chart, the immediate support is found at $29,135.55, followed by $29,076.62 and $28,991.28. These are the levels where buyers might step in to defend the market. Conversely, resistance is stacked at $29,260.86, $29,327.24, and then $29,551.93. A decisive break above these resistance levels would be needed to invalidate the current bearish outlook.
The 4-hour chart offers a slightly different perspective on these critical zones. Support is identified at $29,093.93, then $28,991.28, and further down at $28,813.77. These levels are crucial for assessing the medium-term trend. Resistance, on the other hand, is positioned at $29,374.09, $29,551.60, and $29,654.25. The proximity of these levels to the current price highlights the tight range within which the market is currently operating, albeit with a downward bias. The daily chart provides the broader context, with support at $29,179.85, $28,852.38, and $28,511.31. Resistance on this timeframe is much higher, starting at $29,848.39, then $30,189.46, and extending to $30,516.93. This significant range on the daily chart suggests that while short-term pressure is bearish, there’s substantial room for recovery if the sentiment shifts.
The Correlation Game: DXY, Equities, and the Nasdaq's Dance
To truly understand the Nasdaq 100's predicament at $29,164.86, we must look beyond its own chart and consider its correlations with major market drivers. The Dollar Index (DXY), currently at 100.7, plays a significant role. A rising DXY often signals a 'risk-off' environment, where investors flock to the perceived safety of the US dollar, which in turn can put pressure on riskier assets like equities, including the Nasdaq 100. Today, with DXY showing strength, this correlation is likely exacerbating the downward pressure on the index. The rising DXY at 100.7 coupled with the Nasdaq's bearish trend suggests that global risk appetite is waning, making investors hesitant to hold onto growth-oriented tech stocks.
Furthermore, the performance of broader equity indices like the S&P 500 and Nasdaq 100 themselves provides context. The S&P 500, trading at 6572.87, is showing a mixed signal. While its 1-hour and 4-hour charts suggest a bullish trend, the daily chart indicates a bearish trend with 100% strength. This internal conflict within the broader market could be contributing to the Nasdaq's indecision and volatility. The Nasdaq 100's own price action, showing a strong bearish trend on the daily chart, is in line with the broader market's potential headwinds. The conflict between the short-term upward momentum on the S&P 500 and its long-term bearish trend mirrors the Nasdaq's own technical picture, suggesting a market grappling with conflicting signals.
Energy prices, specifically Brent crude at $83.79, also offer clues. While not directly correlated with the Nasdaq in the same way as the DXY or S&P 500, oil prices are a barometer for global economic activity and inflation expectations. A sustained drop in oil prices can signal weakening global demand, which would be detrimental to growth-sensitive assets like tech stocks. Currently, Brent crude is experiencing a bearish trend on the 1-hour chart, although the daily chart shows a bullish inclination. This divergence might indicate uncertainty about future energy demand, adding another layer of complexity to the risk sentiment surrounding the Nasdaq 100. The interplay between these correlated assets creates a complex web of influence that traders must untangle.
The Path Forward: Scenarios for the Nasdaq 100
Given the current technical landscape and market correlations, several scenarios could unfold for the Nasdaq 100 as it hovers around $29,164.86. The prevailing bearish sentiment, supported by multiple indicators and the DXY's strength, suggests that downside risks are elevated. However, markets are rarely one-dimensional, and opportunities for both upside and continued downside must be considered.
Bearish Descent: Bears Tighten Grip
65% ProbabilityConsolidation Phase: Waiting Game
25% ProbabilityBullish Reversal: A Glimmer of Hope?
10% ProbabilityThe most probable scenario, in my view, is the bearish descent. The confluence of negative indicators on the 1-hour and daily charts, coupled with the strength of the DXY and the overall risk-off sentiment, creates a potent cocktail for further declines. The fact that the 1-hour support at $29,135.55 is being tested suggests that sellers are actively pressing their advantage. While a bounce is always possible, the conditions for a sustained bullish reversal are not yet present. The neutral scenario remains a possibility if market participants adopt a wait-and-see approach ahead of major economic data, but the current momentum leans too heavily towards the downside to assign it a higher probability.
What I'm watching closely this week are two key triggers. First, the price action around the $29,135.55 support level. A failure to hold this level could accelerate the move towards $29,076.62. Second, I'll be monitoring the DXY's trajectory. If the dollar continues to strengthen, it will likely add fuel to the bearish fire for the Nasdaq 100. Conversely, any sign of dollar weakness could provide a temporary reprieve for risk assets. The absence of strong bullish signals across multiple timeframes means that any upward move should be treated with caution, potentially as a setup for further selling pressure unless significant buying volume confirms a true trend reversal.
The current market conditions present significant risk. While analysis suggests potential downside, unexpected news or shifts in central bank sentiment can rapidly alter the landscape. Always employ strict risk management protocols, including setting appropriate stop-losses, and never risk more than you can afford to lose.
The Indicator Dashboard: A Snapshot of Nasdaq 100's Health
To consolidate our findings, let's examine the indicator dashboard. The 1-hour chart presents a predominantly bearish picture, with RSI at 32.77 and MACD showing negative momentum. Stochastic is giving a bullish signal, creating a minor divergence, but this is often overshadowed by the stronger bearish signals. The ADX at 33.23 indicates a strong downtrend. The 4-hour chart is more mixed, with a neutral trend strength but still leaning bearish on MACD and Stochastic. The daily chart reinforces the bearish outlook with a strong ADX of 15.12 and RSI below 50. This overall indicator reading suggests that the path of least resistance is downwards, with potential for further declines if key support levels are breached.
| Indicator | Value | Signal | Interpretation |
|---|---|---|---|
| RSI (14) - 1H | 32.77 | Bearish | Oversold pressure building |
| MACD Hist - 1H | -15.12 | Bearish | Negative momentum increasing |
| Stochastic K/D - 1H | 30.97 / 20.52 | Bullish Divergence | Potential short-term bounce signal |
| ADX - 1H | 33.23 | Strong Downtrend | Confirms current bearish trend |
| RSI (14) - 4H | 39.92 | Bearish | Further downside possible |
| MACD Hist - 4H | -21.06 | Bearish | Sustained negative momentum |
| Stochastic K/D - 4H | 15.62 / 35.37 | Bearish | Confirms downward move |
| ADX - 4H | 21.06 | Moderate Trend | Suggests prevailing direction |
| RSI (14) - 1D | 46.36 | Bearish | Below 50, favors sellers |
| MACD Hist - 1D | -342.45 | Bearish | Significant negative momentum |
| Stochastic K/D - 1D | 42.97 / 29.88 | Bullish Crossover | Potential for reversal signal |
| ADX - 1D | 15.12 | Weak Trend | Market lacks strong directionality but trend is down |
The Big Picture: Macroeconomic Undercurrents and Geopolitical Shocks
While the Nasdaq 100's price action at $29,164.86 is dominated by technical signals, macroeconomic factors and geopolitical events are the unseen forces shaping the broader market sentiment. The strength of the US Dollar Index (DXY) at 100.7 is a significant macro driver. A robust dollar often correlates with a weaker Nasdaq, as it makes US assets more expensive for international investors and can signal tighter global liquidity. This inverse relationship is crucial to monitor, as any sustained dollar rally could further dampen risk appetite for tech stocks.
The performance of other equity indices also provides critical context. The S&P 500, despite some short-term strength, shows a bearish trend on its daily chart, aligning with the Nasdaq's own bearish trajectory. This suggests that the weakness isn't isolated to the tech sector but may reflect broader concerns about economic growth or inflation. Energy prices, with Brent crude trading at $83.79, are another key consideration. While currently showing a bearish trend on the 1-hour chart, the daily chart hints at potential upside. Fluctuations in oil prices can impact inflation expectations, which in turn influence central bank policy and, consequently, stock market valuations. Any significant move in oil prices could ripple through the market, affecting the Nasdaq 100.
Geopolitical tensions, though not explicitly detailed in the provided market data, always lurk in the background. Events such as international conflicts, trade disputes, or unexpected political developments can trigger 'risk-off' sentiment, causing a flight to safety that benefits assets like the dollar and potentially gold, while punishing growth-oriented stocks like those in the Nasdaq 100. While no specific geopolitical news directly impacting the Nasdaq was highlighted in the last 48 hours, the general increase in DXY strength could be partially attributed to underlying global uncertainties. Traders must remain vigilant for any geopolitical shocks that could drastically alter market sentiment and impact the Nasdaq 100's trajectory.
When multiple timeframes show conflicting signals, it often indicates a market in transition or consolidation. In such cases, waiting for confirmation on a higher timeframe (like the daily chart) or observing price action around key support/resistance levels becomes paramount. Don't force trades; let the market provide clear direction.
Frequently Asked Questions: Nasdaq 100 Analysis
What happens if the Nasdaq 100 breaks below the $29,135.55 support level today?
If the Nasdaq 100 closes decisively below $29,135.55, it would likely trigger further selling pressure, targeting the next support at $29,076.62. This breakdown would invalidate any short-term bullish hopes and reinforce the bearish trend observed on the daily chart.
Should I consider buying the Nasdaq 100 at current levels of $29,164.86 given the RSI at 32.77 on the 1H chart?
Buying at $29,164.86 is risky given the bearish signals. While the 1-hour RSI at 32.77 might suggest oversold conditions, the overall trend across multiple timeframes remains bearish. A more prudent approach would be to wait for confirmation of a bullish reversal, perhaps a close above $29,327.24, or for price to test deeper support levels like $28,813.77.
How does the DXY at 100.7 impact the Nasdaq 100's current price action?
The DXY's strength at 100.7 often correlates with a risk-off sentiment, which typically pressures riskier assets like the Nasdaq 100. This inverse relationship means a rising dollar could exacerbate the downward move, making it harder for the Nasdaq to find footing around its current $29,164.86 level.
What does the ADX reading of 33.23 on the 1H chart imply for Nasdaq 100 traders?
An ADX reading of 33.23 on the 1-hour chart signifies a strong downtrend. This indicates that the current bearish momentum is well-established and not just a minor fluctuation. Traders should be cautious about attempting counter-trend trades and instead look for opportunities aligned with this strong directional move.
Track markets in real-time
AI-powered analysis, technical indicators and real-time price data.
Join Our Telegram Channel
Breaking market news, AI analysis and trading signals instantly.
Join Channel