

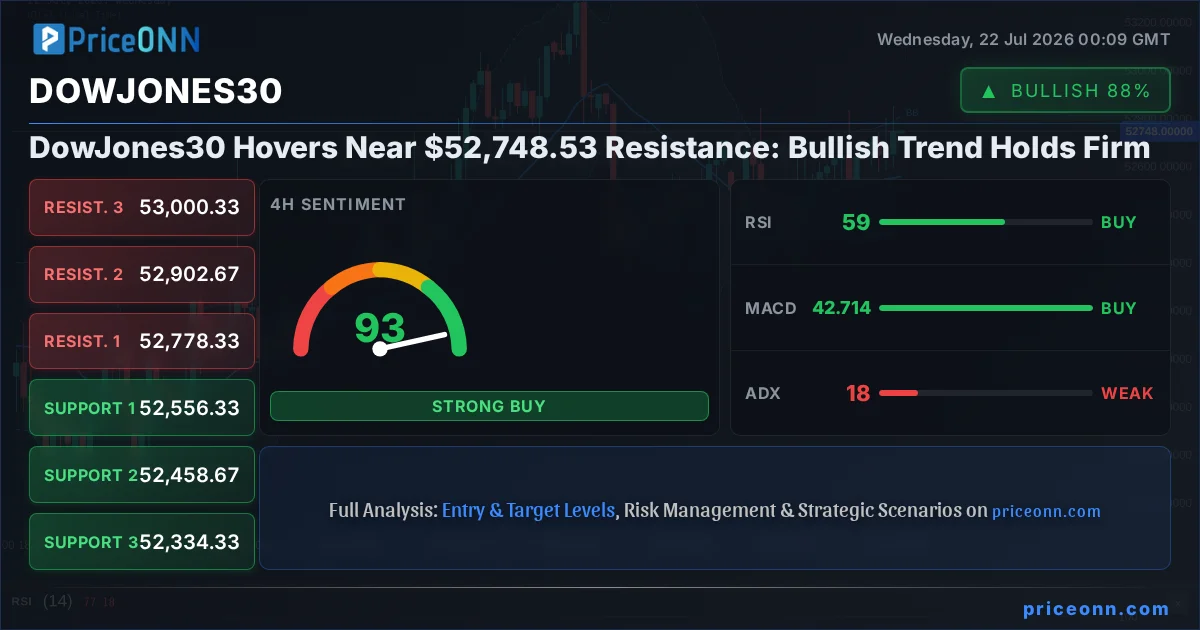
The Dow Jones Industrial Average (DowJones30) is currently positioned at a critical juncture, hovering near its resistance level at $52,748.53. This strategic point is drawing significant attention from traders and analysts alike, as the index's persistent bullish trend faces its next major test. With a robust upward momentum evident across multiple timeframes, the question on many minds is whether this level will yield to further gains or trigger a much-needed consolidation. Understanding the interplay of technical indicators, key price levels, and the broader economic landscape is paramount for navigating this pivotal moment in the DowJones30's trajectory. This analysis delves into the intricate details, aiming to provide clarity on the path forward.
- DowJones30 RSI is at 55.57, indicating neutral momentum with a slight upward bias, suggesting room for further gains before overbought conditions arise.
- The critical support for the DowJones30 sits at $52,593.67, a level that has held firm on the 1H chart, preventing deeper pullbacks.
- The MACD histogram on the 1H chart shows positive momentum, with the MACD line above the signal line, supporting the idea of continued upward pressure.
- The correlation with the DXY, currently at 100.7, suggests that a strengthening dollar could potentially weigh on the DowJones30 if market sentiment shifts towards risk aversion.
Navigating the $52,748.53 Threshold: A Technical Perspective
The Intricacies of the 1H Chart Dynamics
On the 1-hour chart, the DowJones30 is exhibiting a cautiously optimistic posture, currently trading around the $52,748.53 mark. The trend is officially classified as neutral, reflecting a balance between buying and selling pressures, with a strength of 50%. This neutrality is further underscored by the RSI(14) value of 55.57. While this reading is comfortably within the neutral zone, it does lean towards a slight upward inclination, suggesting that the bulls still have some gas left in the tank. It's not yet signaling overbought conditions, which typically kick in above 70, leaving room for potential upside before significant selling pressure might emerge. The MACD indicator is currently displaying positive momentum, with the MACD line positioned above its signal line. This technical alignment generally supports the continuation of an uptrend, or at least a short-term bounce, within the broader market context. The Bollinger Bands are also painting a picture of upward movement, with the price trading above the middle band, indicating that the recent price action has been predominantly positive. However, the Stochastic Oscillator presents a slightly more cautionary signal. With the K line at 71.48 and the D line at 56.21, the Stochastic is in overbought territory and shows a crossover where the K line is above the D line. This can sometimes precede a reversal or at least a pause in the upward momentum. The ADX, a measure of trend strength, is notably low at 8.29. This suggests that the current trend, even with positive MACD and price above the middle Bollinger Band, lacks strong conviction. A low ADX reading often implies a range-bound market or the early stages of a new trend, making breakouts less reliable until confirmed by increased directional momentum. The overall signal on the 1H chart leans towards 'BUY' (7 buys, 1 sell, 0 neutral), but the weak ADX and the Stochastic in overbought territory warrant a degree of caution. This suggests that while the path of least resistance might be upwards, the move could be choppy and lack sustained power without further confirmation.
The 4-Hour Chart: Building the Bullish Case
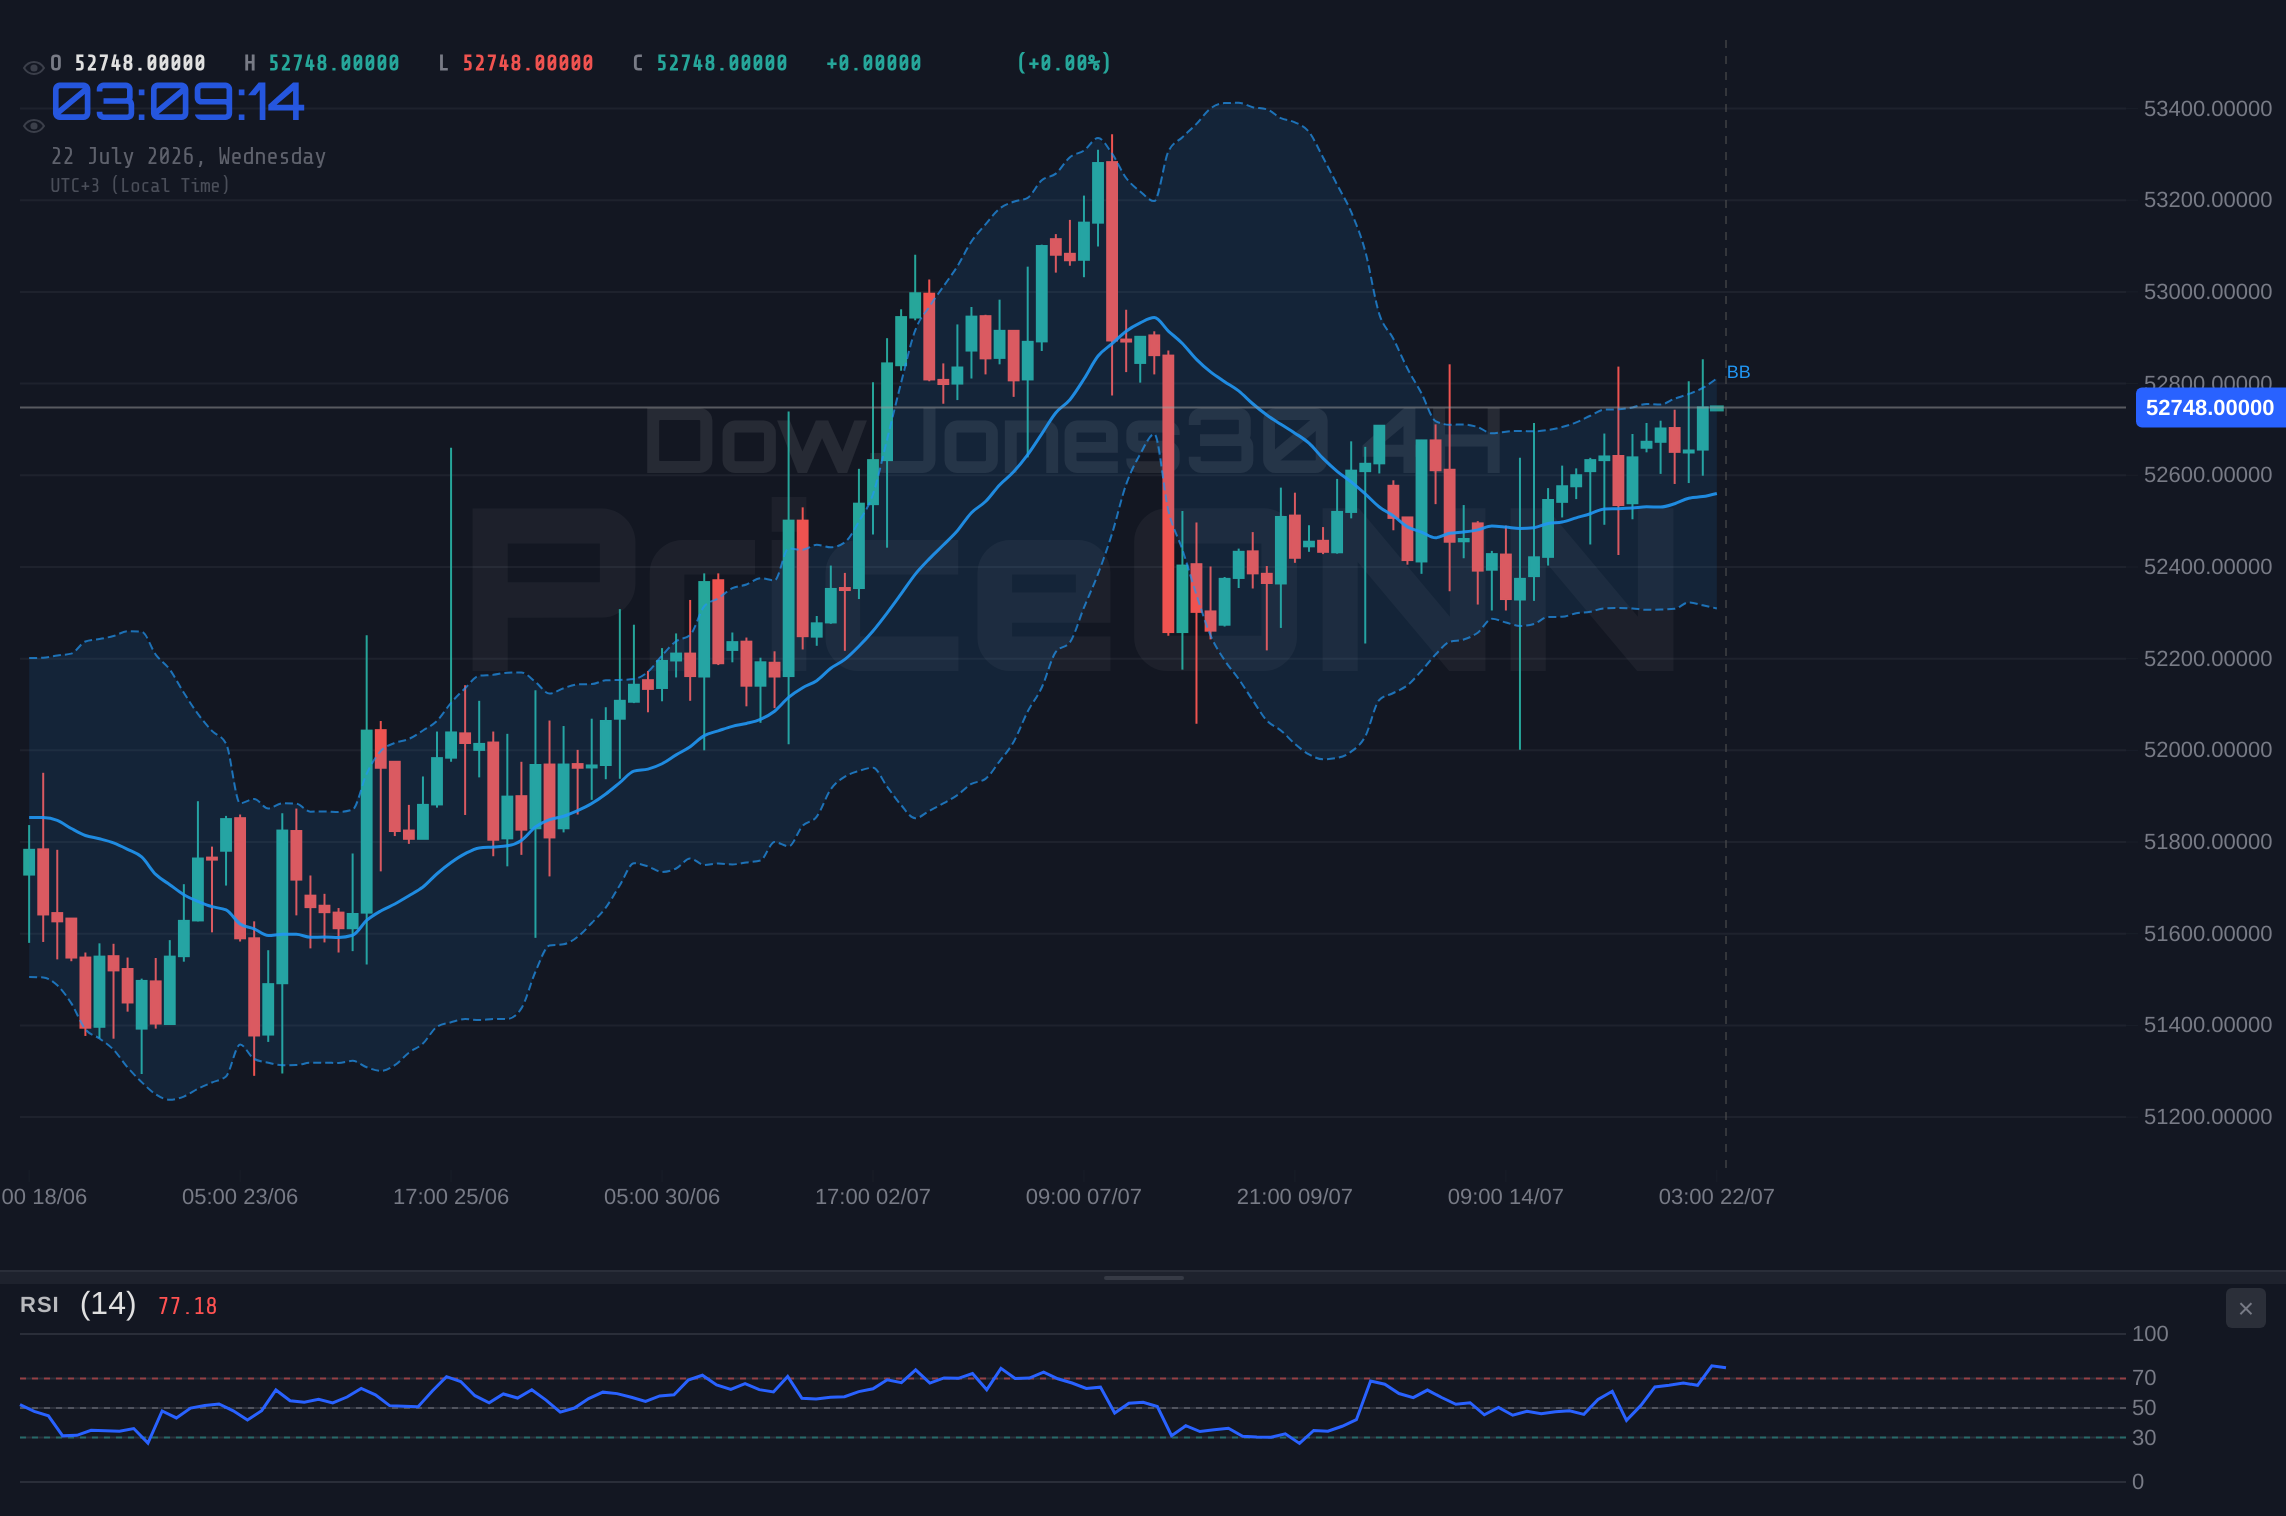
Shifting our focus to the 4-hour timeframe, the DowJones30 presents a more robustly bullish picture. The trend is firmly categorized as neutral, but with a higher strength of 50%, indicating a stronger underlying sentiment. The RSI(14) at 59.24 remains in the neutral zone, but significantly higher than its 1H counterpart, reinforcing the idea that the upward momentum has more room to run before hitting overbought territory. This level suggests that buyers are actively participating without pushing the index into extreme territory just yet. The MACD indicator continues to echo the positive sentiment, with positive momentum and the MACD line holding above the signal line. This is a classic bullish signal that often precedes further price appreciation. The Bollinger Bands are also supportive of the bullish outlook, with the price trading above the middle band, indicating an upward bias. This suggests that the recent price action is reflecting strength. However, the Stochastic Oscillator on this timeframe is showing a potential divergence. The K line is at 61.92 and the D line at 67.09, indicating that the K line is below the D line, which typically signals a bearish divergence or a potential pullback. This contradicts the MACD and Bollinger Band signals to some extent, suggesting that while the overall trend might be up, there could be short-term selling pressure building. The ADX value of 18.38 indicates a weak trend on this timeframe. Similar to the 1H chart, this suggests that the current move might not have strong directional conviction behind it, and we could be seeing consolidation rather than a sustained breakout. The overall signal on the 4H chart is 'BUY' (7 buys, 1 sell, 0 neutral), reflecting the generally positive technical indicators, but the Stochastic's bearish signal and the weak ADX suggest that this bullishness might be tempered by consolidation phases. Traders should be aware that while the broader trend is positive, the immediate path could involve sideways movement or minor pullbacks.
Daily Timeframe: The Foundation of the Uptrend
Examining the daily chart provides the foundational context for the DowJones30's current market position. Here, the trend is unequivocally classified as bullish, boasting a considerable strength of 93%. This strong conviction suggests that the prevailing upward movement is well-established and has significant backing. The RSI(14) at 60.53 sits comfortably in the neutral zone, albeit towards the upper end. This reading indicates healthy buying interest without signaling an imminent overbought condition, which typically begins around 70. It implies that there is still potential for the index to climb higher before facing significant selling pressure. The MACD indicator on the daily timeframe, however, presents a more complex picture. It shows negative momentum, with the MACD line below its signal line. This is generally considered a bearish signal, suggesting that the recent upward momentum might be waning or that a bearish divergence is forming. This contrasts with the bullish signals from the 1H and 4H charts, highlighting a potential conflict between short-term optimism and longer-term trend exhaustion. The Bollinger Bands are currently positioned above the middle band, which aligns with the overall bullish trend. This suggests that the price is trading in the upper half of its recent range, reinforcing the positive sentiment. However, the Stochastic Oscillator on the daily chart is showing a potential buy signal. With the K line at 47.92 and the D line at 44.46, the K line is above the D line, indicating a bullish crossover. This suggests that a potential upward move might be brewing, or at least that the selling pressure is abating. The ADX value of 26.72 indicates a strong trend on this daily timeframe. This is the highest ADX reading across the analyzed timeframes, confirming that the current daily trend has significant directional force. The overall signal on the daily chart is 'BUY' (7 buys, 1 sell, 0 neutral), primarily driven by the strong trend strength and the bullish Stochastic crossover, despite the conflicting MACD reading. This suggests that while the long-term trend remains bullish, traders should be mindful of the mixed signals from the MACD and the potential for short-term fluctuations.
The Macroeconomic Undercurrents: Driving the DowJones30
Interest Rate Expectations and the Fed Factor
The Federal Reserve's monetary policy remains a dominant force shaping the DowJones30's movements. While the Fed has signaled a pause in rate hikes, the market remains hyper-vigilant for any clues regarding future policy direction. CME FedWatch data, if available, would typically show probabilities for future rate decisions. In the absence of specific data, we analyze the prevailing sentiment: the market is currently pricing in a high probability of rates remaining steady in the near term, but any hawkish rhetoric from Fed officials could quickly shift this narrative. Recent statements from Fed members have been cautiously optimistic, emphasizing the need to monitor inflation data closely. The core PCE price index, a key inflation gauge, has shown signs of moderating, but remains above the Fed's 2% target. This delicate balance means that the Fed is unlikely to pivot to rate cuts anytime soon, creating a less favorable environment for risk assets like equities in the long run. However, for now, the stability in interest rate expectations is providing a degree of support for the DowJones30. The yield on the 10-year US Treasury, currently hovering around levels that reflect this stable rate outlook, acts as a benchmark for borrowing costs across the economy. If these yields were to tick up significantly, it could signal a renewed tightening bias from the Fed or rising inflation concerns, potentially putting pressure on the Dow Jones. Conversely, a sustained decline in yields might be interpreted as a sign of economic cooling, which could also dampen corporate earnings outlooks.
Inflation Data and Corporate Earnings: A Double-Edged Sword
Inflationary pressures continue to be a central theme in economic discourse, and their impact on the DowJones30 is multifaceted. While inflation erodes purchasing power, it can also, in some cases, benefit companies that can pass on increased costs to consumers. However, the current data suggests that while inflation has shown some signs of cooling, it remains elevated enough to keep the Federal Reserve on a watchful footing. Recent Consumer Price Index (CPI) and Producer Price Index (PPI) reports provide a mixed bag. For instance, if we saw a CPI report showing a significant drop in inflation, it would likely boost market sentiment, as it could embolden the Fed to consider rate cuts sooner rather than later. Conversely, a hotter-than-expected inflation print would raise concerns about a potential resurgence of price pressures, potentially leading to higher-for-longer interest rates and a negative impact on corporate valuations. This dynamic directly influences corporate earnings. Companies within the Dow Jones Industrial Average are heavily reliant on consumer spending and economic growth. If inflation remains stubbornly high, it could squeeze corporate profit margins through increased input costs and potentially reduced consumer demand. On the other hand, companies that have strong pricing power and efficient supply chains might be able to weather the inflationary storm better than others. The upcoming earnings season will be crucial for assessing how these companies are adapting to the current economic environment. Reports from major industrial and financial companies within the index will offer vital insights into their ability to navigate inflation and maintain profitability, directly influencing the Dow Jones's path forward.
Global Economic Correlations: DXY and Risk Appetite
The DowJones30 does not operate in a vacuum; its performance is intricately linked to global economic currents and market sentiment. The US Dollar Index (DXY), currently trading at 100.7, serves as a key barometer for this global interplay. Historically, a strengthening dollar, as indicated by a rising DXY, often correlates with pressure on US equities, including the Dow Jones. This is because a stronger dollar makes US exports more expensive for foreign buyers and can signal repatriation of capital from international markets. Conversely, a weakening dollar can sometimes coincide with increased risk appetite, potentially boosting the Dow Jones. Today, with the DXY at 100.7, this inverse relationship suggests that the dollar's current strength might be a headwind for the index, even as other technical indicators remain positive. Furthermore, the performance of broader risk assets, such as the S&P 500 (currently at 6572.87) and the Nasdaq 100 (at 29164.86), provides crucial context. The S&P 500's recent rise of 0.74% and the Nasdaq's slight dip of -1.16% paint a mixed picture of risk appetite. Generally, a rising S&P 500 suggests increasing investor confidence, which bodes well for the Dow Jones. However, the Nasdaq's decline indicates some caution within the tech sector, which can sometimes spill over into other market segments. The price of crude oil, with Brent at $83.79 and WTI at $79.59, also plays a role. Elevated oil prices can signal increased inflation expectations and geopolitical tensions, potentially leading to a risk-off environment that could negatively impact the Dow Jones. Today, both oil benchmarks are showing slight declines, which might offer some relief from inflationary concerns, but the underlying geopolitical risks, particularly those involving the US and Iran as highlighted in recent news, remain a factor to watch. The interplay between the dollar, global risk sentiment, and commodity prices creates a complex web of influences that traders must carefully untangle to accurately gauge the Dow Jones's future direction.
The Path Forward: Scenarios and Outlook
Bearish Scenario: Resistance Holds, Pullback Ensues
Should the DowJones30 fail to decisively break through the resistance at $52,748.53, a bearish scenario becomes increasingly probable. The trigger for this scenario would be a clear inability to sustain price action above this key level, potentially marked by a rejection candle on the hourly or 4-hour chart, or a close below the immediate support at $52,593.67. Invalidation of this bearish thesis would occur if the index decisively breaks above the resistance at $52,778.33 (R1), suggesting that the initial resistance was a temporary hurdle. If the bearish scenario plays out, the first target would be the support level at $52,458.67 (S2). This level has previously acted as a floor, and a break below it could signal further downside. A more significant move would target the subsequent support at $52,334.33 (S3), potentially indicating a deeper correction. This scenario is supported by the conflicting signals observed on some timeframes, such as the Stochastic Oscillator in overbought territory on the 1H chart and the negative MACD momentum on the daily chart. The persistent strength of the DXY at 100.7 also adds a layer of caution, as a stronger dollar can typically weigh on US equities. Furthermore, if upcoming inflation data surprises to the upside, it could reignite fears of sustained higher interest rates, leading investors to de-risk and sell equities, thus pushing the Dow Jones lower.
Bullish Scenario: Breaking the Barrier
Conversely, a decisive breakout above the $52,748.53 resistance level would validate the bullish sentiment and open the door for further upside. The trigger for this scenario would be a strong hourly or daily close above $52,778.33 (R1), accompanied by increasing trading volume and positive confirmation from oscillators like the RSI moving out of neutral territory and the MACD maintaining its positive momentum. Invalidation of this bullish thesis would occur if the price fails to hold above the breakout level and subsequently closes below the support at $52,593.67 (S2), indicating a false breakout. If the bullish scenario unfolds as expected, the first target would be the next resistance level at $52,902.67 (R2). A sustained move above this point could then see the index aiming for the more significant resistance at $53,000.33 (R3). This scenario is supported by the overall bullish trend on the daily chart (93% strength), the positive MACD and Bollinger Band signals on multiple timeframes, and the RSI remaining in a healthy range on the daily chart. A positive surprise in upcoming economic data, such as lower-than-expected inflation or strong employment figures that don't signal overheating, could further fuel this rally. Additionally, a shift in global risk sentiment towards optimism, perhaps signaled by a decline in oil prices or a weakening DXY, would provide a favorable backdrop for a continued ascent.
Neutral Scenario: Consolidation Around Resistance
A third possibility is that the DowJones30 enters a period of consolidation, trading sideways as it digests the recent gains and awaits clearer directional signals. This neutral scenario often occurs when key resistance levels are being tested, but there isn't enough conviction for a decisive breakout or breakdown. The trigger for this scenario would be the price consolidating within the range defined by the current resistance at $52,748.53 and the immediate support at $52,593.67, with neither side showing sustained momentum. Invalidation of this neutral stance would occur if either the support or resistance levels mentioned above are decisively breached, pushing the market into either the bullish or bearish scenario. During consolidation, price action might become choppy, with smaller trading ranges and increased volatility within the bounds. This phase can be challenging for traders looking for clear entry points, and often requires patience. The ADX readings across all timeframes being relatively low (8.29 on 1H, 18.38 on 4H, 26.72 on 1D) actually support the idea of a potential consolidation phase or a market waiting for a catalyst. Traders might look for opportunities on shorter timeframes within this range, but the overall trend might remain undecided until a significant economic event or a clear technical breakout occurs. The key here is to wait for confirmation rather than trying to anticipate the next move prematurely. The current market environment, with mixed signals from various indicators and a sensitive macroeconomic backdrop, makes this neutral scenario a plausible outcome.
What's Next for the DowJones30?
The DowJones30 stands at a critical juncture, with the $52,748.53 resistance level acting as a significant hurdle. While the daily chart paints a fundamentally bullish picture with strong trend strength, the shorter timeframes present a more nuanced view, with conflicting signals and weak trend conviction in some instances. The interplay between the dollar's strength (DXY at 100.7), the direction of broader risk assets like the S&P 500, and upcoming inflation data will be crucial in determining the next directional move. Traders must remain vigilant, observing how price action unfolds around the $52,748.53 level. A decisive breakout could signal further upside, targeting resistance levels at $52,902.67 and $53,000.33. Conversely, a failure to break this resistance could lead to a pullback towards support levels at $52,593.67 and $52,458.67. The current environment demands a data-driven approach, patience, and strict risk management. The market is offering a complex puzzle, and only by carefully analyzing all the pieces – technical indicators, macroeconomic factors, and global correlations – can traders hope to find the right path forward.
Frequently Asked Questions: DowJones30 Analysis
What happens if the DowJones30 breaks above the $52,748.53 resistance level?
If the DowJones30 decisively breaks above $52,748.53, expect a potential move towards the next resistance levels at $52,902.67 (R2) and potentially $53,000.33 (R3). This would be confirmed by a strong close above $52,778.33 and increasing volume, suggesting sustained bullish momentum.
Should I buy the DowJones30 at current levels of $52,748.53, given the RSI at 55.57?
Buying at current levels carries some risk due to the proximity of resistance at $52,748.53. While the RSI at 55.57 suggests room for upside, the weak ADX (8.29 on 1H) indicates a lack of strong trend conviction. A more prudent approach might be to wait for a confirmed breakout above resistance or a pullback to a key support level like $52,593.67.
Is the MACD momentum at 1H a strong buy signal for the DowJones30 at $52,748.53?
The positive MACD momentum on the 1H chart, with the MACD line above the signal line, is generally a bullish indicator. However, it should be considered in conjunction with other signals. The Stochastic Oscillator being in overbought territory and the very low ADX (8.29) suggest this MACD signal might not translate into a powerful, sustained rally without further confirmation.
How will the current DXY level of 100.7 affect the DowJones30's movement this week?
A DXY level of 100.7 indicates a relatively strong dollar. Historically, a strong dollar can act as a headwind for US equities like the DowJones30. If the DXY continues to strengthen or holds firm, it might limit upside potential for the index, especially if market sentiment turns risk-averse.
Track markets in real-time
AI-powered analysis, technical indicators and real-time price data.
Join Our Telegram Channel
Breaking market news, AI analysis and trading signals instantly.
Join Channel