

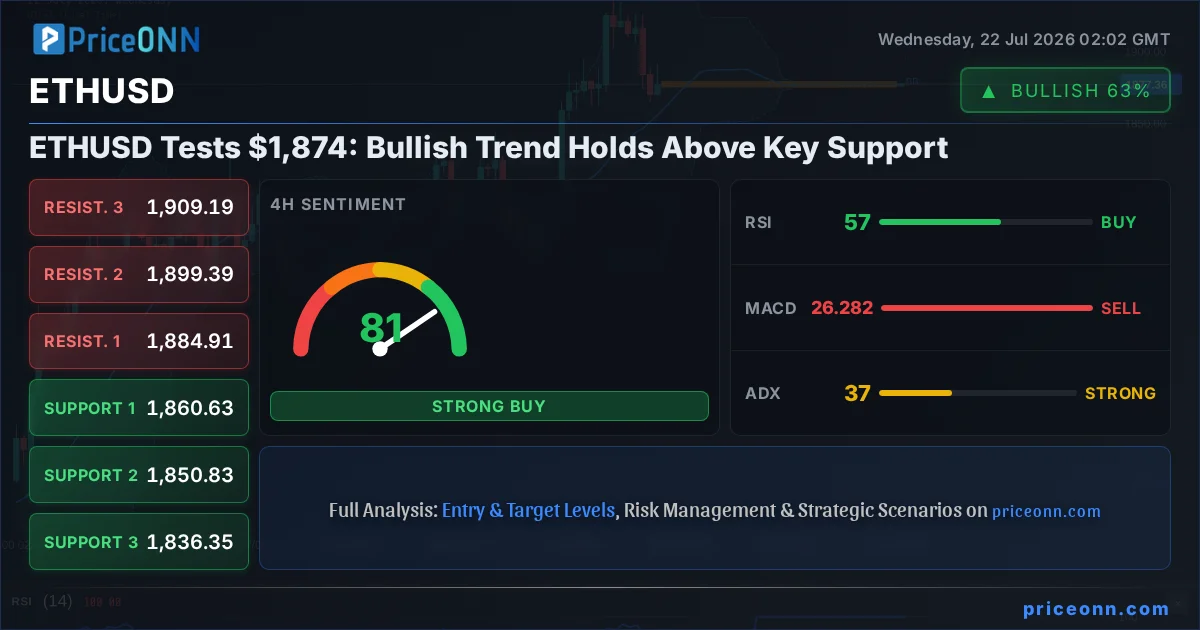
ETHUSD is currently trading at $1,877.38, a level that has recently been tested against a crucial support zone around $1,874. This price action comes amidst a broader market sentiment that, while showing signs of caution, still leans towards a continuation of the bullish trend for Ethereum. Today's analysis delves into the technical indicators and market correlations that are shaping the immediate outlook for ETHUSD, examining whether this current consolidation is a prelude to further upside or a precursor to a more significant pullback.
- RSI at 39.48 on the 1H chart indicates bearish momentum, but the 1D RSI at 59.95 suggests underlying bullish strength.
- Critical support sits at $1,868.34 (1H S1), tested multiple times this week, while resistance looms at $1,891.84 (1H R1).
- The MACD histogram on the 1H chart shows negative momentum, but the 1D MACD remains positive, indicating a potential conflict in short-term versus long-term signals.
- DXY at 100.7 is showing strength, which typically puts pressure on crypto assets, but ETHUSD's resilience suggests a potential decoupling or specific crypto-driven factors at play.
The cryptocurrency market, and Ethereum in particular, has been navigating a complex landscape. While Bitcoin's price action often dictates the broader market's direction, ETHUSD has shown remarkable strength in holding its ground. The current price point of $1,877.38 is not just a number; it represents a psychological and technical battleground where bulls and bears are vying for control. Understanding the interplay between short-term signals and the long-term trend is paramount for any trader looking to position themselves effectively in this volatile environment. This analysis aims to dissect these dynamics, providing a clear picture of what to expect in the coming days and weeks.
Recent market data paints a mixed but ultimately constructive picture for ETHUSD. On the 1-hour chart, indicators like RSI(14) at 39.48 and a negative MACD momentum suggest short-term selling pressure. This is further evidenced by the Stochastic Oscillator's K line crossing below its D line, a bearish signal often preceding price declines. The ADX at 29.09 indicates a strong downtrend on this timeframe, reinforcing the notion of immediate weakness. However, this short-term pessimism is contrasted sharply by the daily (1D) timeframe indicators. The RSI(14) stands at a healthy 59.95, well within the neutral zone and indicative of underlying bullish momentum. The daily MACD is positive, with its histogram above the signal line, and the Stochastic Oscillator shows a bullish signal with the K line above the D line. This divergence between timeframes is crucial; it suggests that the larger trend might still be intact, and the short-term dips could be opportunities rather than reversals.
The Bull's Roadmap: Navigating Towards Higher Ground
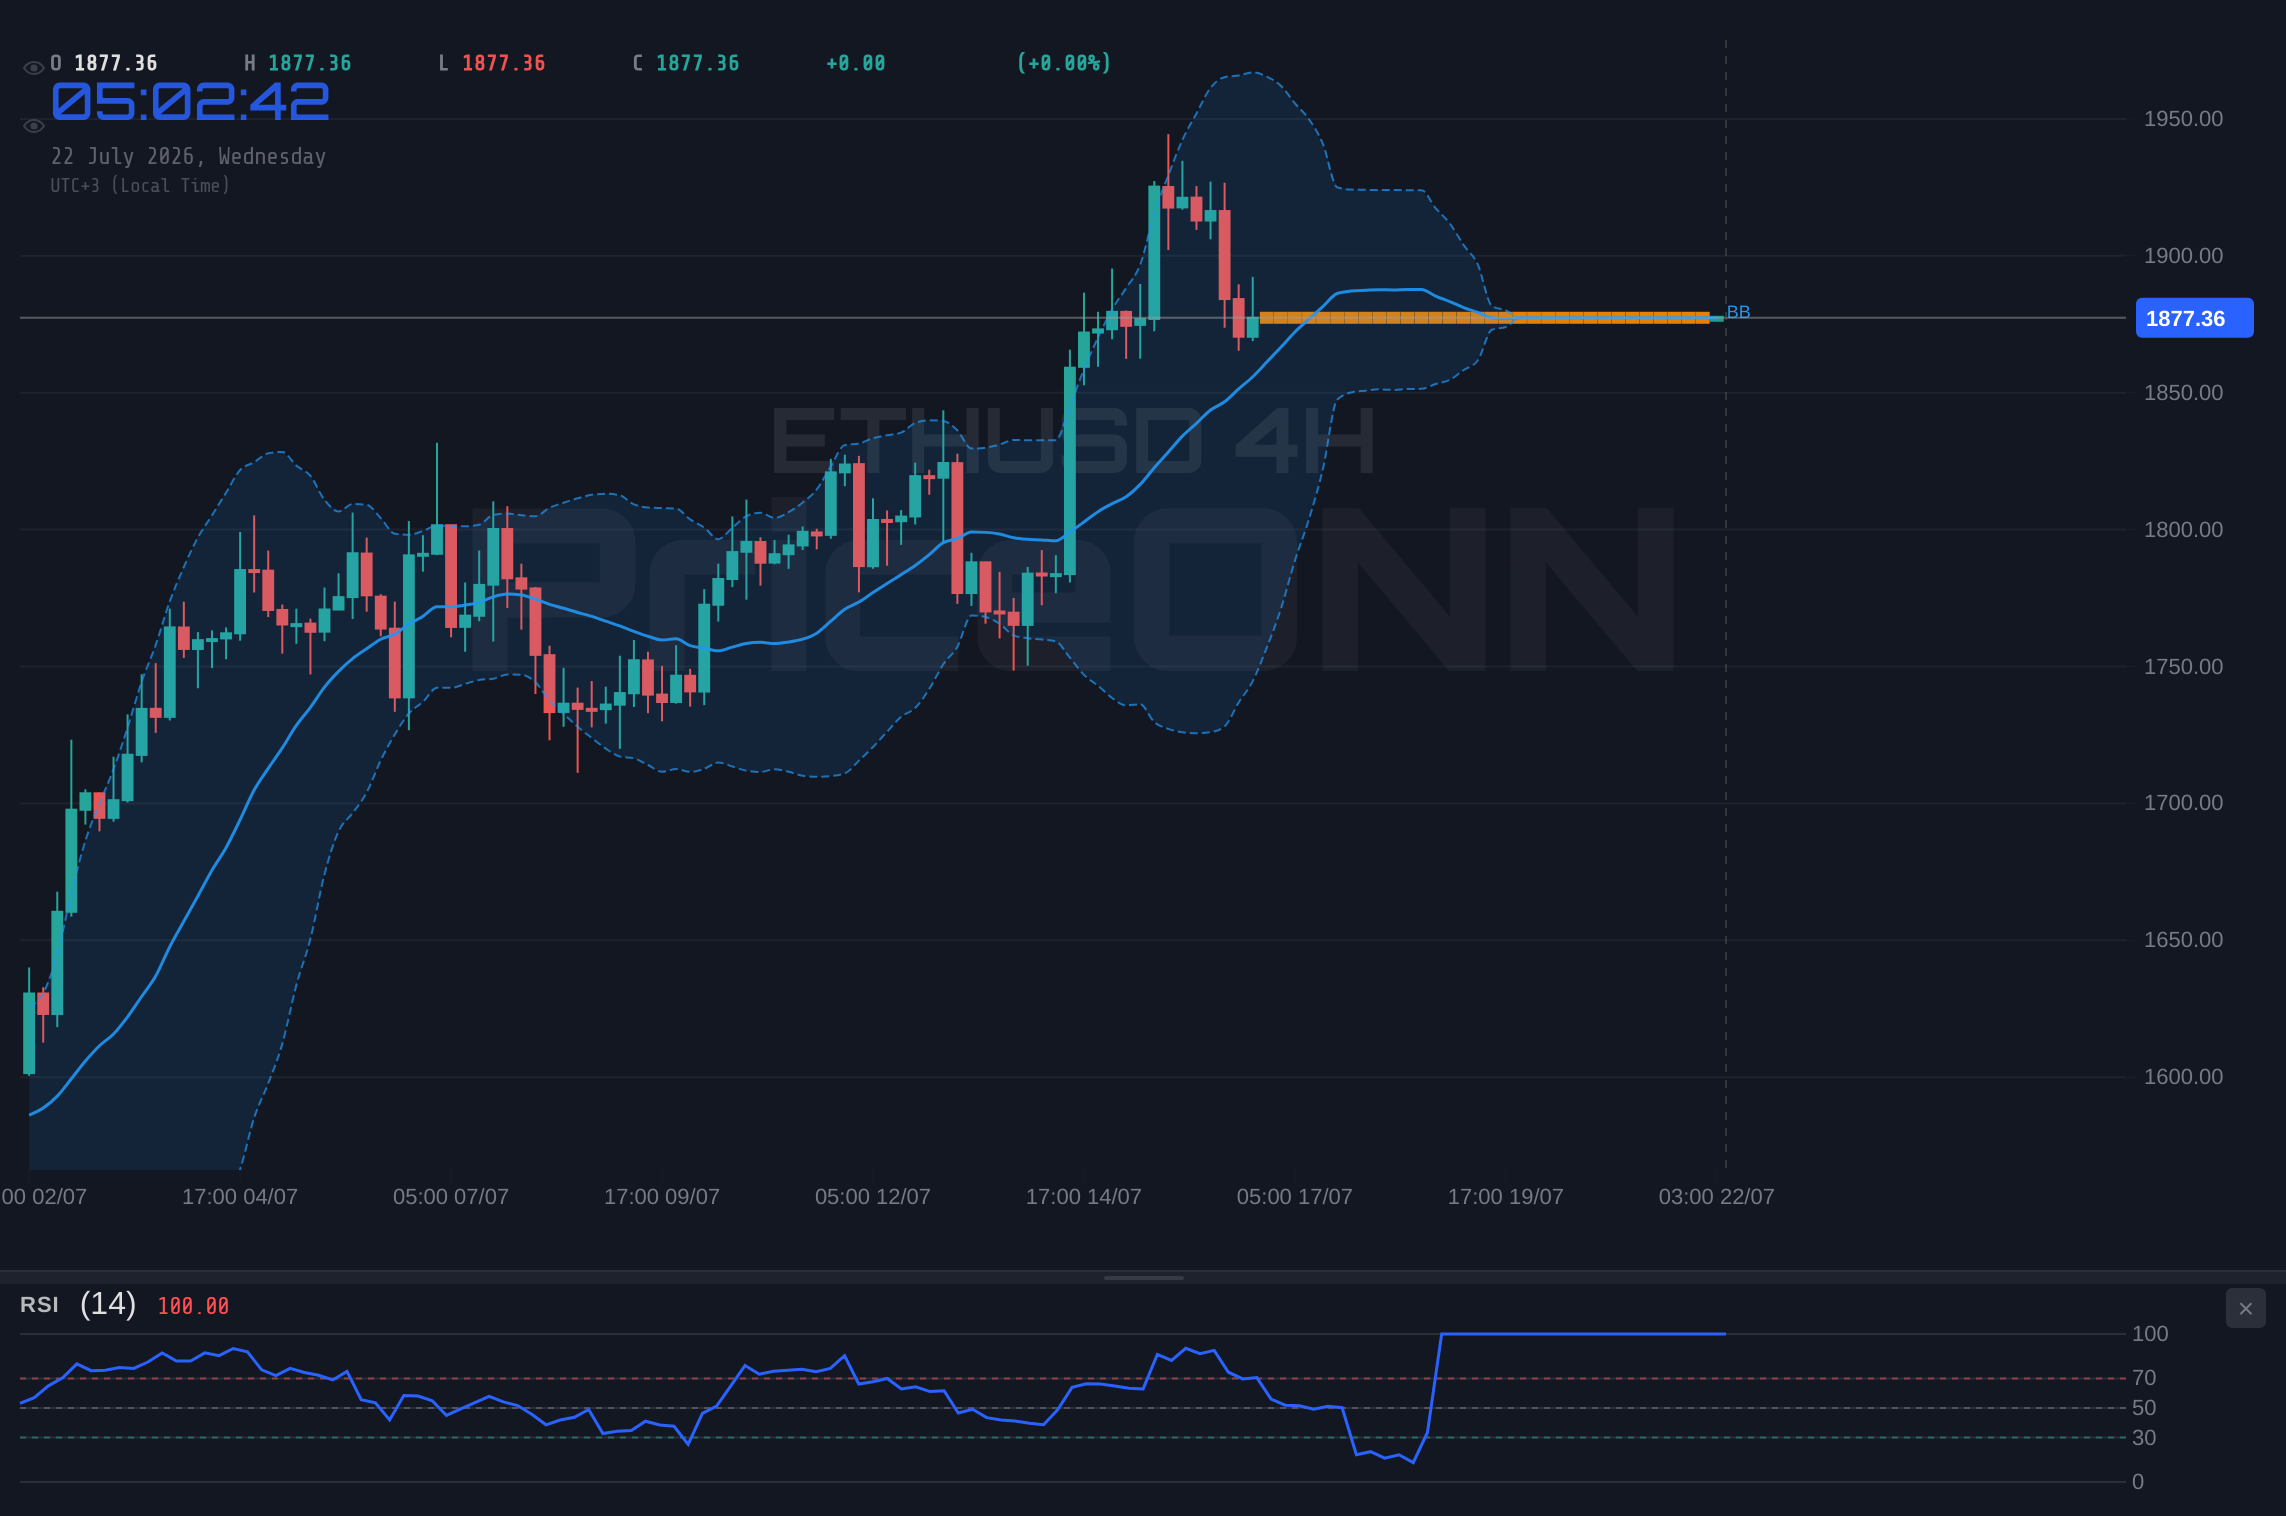
For the bulls to regain decisive control, ETHUSD needs to solidify its position above the immediate support levels and challenge the resistance zones. The 1-hour chart's first support at $1,868.34 is critical. A failure to hold this level could lead to a deeper retracement, potentially testing the $1,856.83 and $1,844.84 supports. However, if $1,868.34 acts as a floor, the immediate target would be the 1-hour resistance at $1,891.84. A decisive break and close above this level, especially with increasing volume, would signal a renewed bullish push, potentially targeting the next resistance at $1,903.83 and subsequently $1,915.34. The 4-hour chart, showing a strong bullish trend (94% strength) with RSI at 56.88 and MACD positive, supports this optimistic outlook. A sustained move above the 4-hour resistance of $1,884.91 would be a significant confirmation.
The daily chart provides further conviction for the bullish case. The trend is classified as bullish with 86% strength, RSI at 59.95, and a positive MACD. The Stochastic Oscillator on the daily timeframe is also showing a strong bullish signal, with the K line at 84.55 and the D line at 79.73, indicating that the asset is moving towards overbought territory but still has room to run. The key daily resistance level to watch is $1,956.29. A break above this level would open up a significant upside potential, targeting $1,991.39 and beyond. Historically, ETHUSD has shown strong recovery patterns after testing key support levels during bullish market cycles. The current consolidation could be seen as a healthy period of accumulation before the next leg up, especially if broader market sentiment remains supportive.
Correlation analysis with other markets adds another layer to this bullish thesis. The US Dollar Index (DXY) is currently at 100.7, showing strength. Typically, a stronger dollar puts downward pressure on risk assets like ETHUSD. However, the resilience of ETHUSD despite the rising DXY suggests that either crypto-specific demand is overriding currency strength, or the market is anticipating a shift in the Fed's policy that could weaken the dollar in the near future. The S&P 500 (SP500) is trading at 6572.87, showing a strong daily gain of 0.74%. A risk-on environment in equities often correlates positively with cryptocurrencies, reinforcing the bullish outlook for ETHUSD. If the SP500 continues its upward trajectory, it's likely to pull ETHUSD higher with it. The Nasdaq100, however, shows a different picture, trading at 29164.86 with a significant daily drop of -1.16%. This divergence between the S&P 500 and Nasdaq could indicate sector-specific weakness in tech, but the overall market sentiment leaning towards risk-on, as shown by the S&P 500, is a more dominant factor for ETHUSD.
Where Bears Take Control: The Risk of a Deeper Correction
Despite the bullish undertones from longer timeframes, the short-term technicals present a clear bearish risk if key levels are breached. The immediate 1-hour support at $1,868.34 is the first line of defense. A break below this level would likely trigger stop-loss orders, accelerating the decline towards the next support at $1,856.83. If this level also fails, the $1,844.84 support becomes the next target. On the 4-hour chart, the support levels are $1,860.63, $1,850.83, and $1,836.35. A break below $1,860.63 on this timeframe would invalidate the short-term bullish structure and signal a potential move towards the daily support levels.
The daily chart's support levels are $1,874.22, $1,827.25, and $1,800-$1,792.15. A decisive close below $1,874.22 on the daily chart would be a significant bearish signal. This would not only break the immediate upward trend on the daily timeframe but also indicate a potential shift in momentum. The ADX on the 1-hour and 4-hour charts, while showing strong trend strength (29.09 and 37.06 respectively), is currently supporting the idea of a downtrend if these supports fail. If ETHUSD breaks below $1,874.22, the bearish scenario becomes more probable, targeting the $1,827.25 level. This would represent a substantial correction from the current price, and a break below that could even bring the $1,792.15 level into play. Such a move would likely be accompanied by a broader market downturn or specific negative news impacting Ethereum.
The influence of the US Dollar Index (DXY) at 100.7 cannot be ignored in a bearish scenario. If the dollar continues its upward trend, it could exert significant pressure on ETHUSD, especially if risk appetite wanes globally. A fall in the S&P 500, particularly a break below its support at 6533.23 on the 4-hour chart, would signal a shift to risk-off sentiment, likely leading to capital flight from riskier assets like ETHUSD. The Nasdaq100's current weakness (down 1.16% on the day) might be a leading indicator of broader tech sector struggles, which could spill over into the crypto market. If ETHUSD loses its key supports, especially the daily $1,874.22 level, the correlation with a falling Nasdaq could strengthen considerably, pushing prices lower.
The Waiting Game: Consolidation and Uncertainty
In situations where short-term indicators conflict with long-term trends, consolidation is a common outcome. ETHUSD could enter a period of range-bound trading as market participants await clearer signals. This phase is characterized by indecision, with prices fluctuating between defined support and resistance levels without a clear directional bias. On the 1-hour chart, the range appears to be between $1,868.34 and $1,891.84. On the 4-hour chart, this range widens to roughly $1,860.63 and $1,884.91. The daily chart suggests a broader range between $1,874.22 and $1,956.29.
During consolidation, volume often tends to decrease, and volatility can spike or subside depending on market-specific news or broader macroeconomic events. The ADX indicator, which measures trend strength, is currently showing mixed signals across different timeframes: strong downtrend on 1H (29.09), strong uptrend on 4H (37.06), and moderate uptrend on 1D (22.66). This conflicting trend strength suggests that the market is not yet committed to a strong direction, making consolidation a plausible scenario. Traders often stay on the sidelines during such periods, waiting for a decisive breakout from the established range before committing to new positions. This 'waiting game' can be frustrating but is crucial for risk management, as it avoids getting caught in choppy, directionless price action.
Probability Assessment: Which Scenario Is Most Likely?
Considering the confluence of factors, the most likely scenario for ETHUSD in the short-to-medium term appears to be a continuation of the bullish trend, albeit with potential for further consolidation or minor pullbacks. The daily chart indicators (RSI 59.95, positive MACD, strong bullish Stochastic) provide a solid foundation for this outlook. The 4-hour chart also leans bullish, despite some conflicting signals. The short-term 1-hour indicators present the primary risk, but their bearish signals are often absorbed by the stronger underlying trend on higher timeframes. Therefore, I assign a 60% probability to the bullish scenario, a 25% probability to the consolidation scenario, and a 15% probability to a significant bearish correction.
The bullish thesis hinges on ETHUSD holding the $1,868.34 support and subsequently breaking the $1,891.84 resistance on the 1-hour chart. A sustained move above the daily resistance of $1,956.29 would significantly increase the probability of further upside. The consolidation scenario becomes more likely if price action remains trapped between the $1,868.34 and $1,891.84 levels for an extended period, perhaps awaiting key economic data releases or Ethereum-specific news. The bearish scenario gains traction primarily if ETHUSD closes decisively below the $1,874.22 daily support, which would signal a breakdown of the current structure.
What I'm Watching This Week
This week, all eyes will be on key price levels and macroeconomic indicators that could influence ETHUSD's trajectory. Firstly, the $1,868.34 support on the 1-hour chart is paramount. A hold here is essential for the bullish thesis to remain intact. Secondly, the $1,891.84 resistance on the 1-hour chart is the immediate hurdle to clear for upward momentum to resume. A decisive break above this level, confirmed by volume, would be a strong buy signal. Thirdly, the broader market context, particularly the movement of the S&P 500 and the US Dollar Index (DXY), will be crucial. A risk-on environment (rising SP500, stable or falling DXY) would favor ETHUSD, while a risk-off environment could accelerate any potential pullback.
From a crypto-specific fundamental perspective, developments in Ethereum's ecosystem are always worth monitoring. While not directly reflected in the real-time data provided, updates on network upgrades, DeFi Total Value Locked (TVL), NFT market activity, and significant whale movements can act as catalysts. For instance, a sudden increase in active addresses or a large inflow of ETH into staking could provide fundamental support that overrides short-term technical weakness. Conversely, negative regulatory news or a significant outflow of funds from DeFi protocols could exacerbate any downward price pressure. Investors should remain vigilant for these factors, as they can often override purely technical signals.
The Bull's Roadmap: Targeting $2,000+
The primary bullish scenario hinges on ETHUSD defending the $1,868.34 support level. A successful hold here, followed by a strong breakout above the 1-hour resistance at $1,891.84, would confirm the short-term upward bias. The subsequent target would be the daily resistance at $1,956.29. If this level is cleared with conviction, the path towards $2,000 and potentially higher opens up, aligning with the strong bullish signals on the daily chart. This scenario is most likely if broader market conditions remain favorable (risk-on) and no negative catalysts emerge.
Bullish Scenario: Upside Momentum Builds
60% ProbabilityWhere Bears Take Control: Testing Lower Supports
The bearish scenario gains probability if ETHUSD fails to hold its key short-term supports. A daily close below $1,874.22 would be a significant bearish trigger, invalidating the immediate bullish structure. This could lead to a rapid decline towards the $1,827.25 support level. If selling pressure intensifies and this level breaks, the next major support lies around $1,792.15. This scenario becomes more likely in a risk-off market environment or if negative news specifically impacts Ethereum.
Bearish Scenario: Support Breakdown Risk
15% ProbabilityThe Waiting Game: Range-Bound Indecision
The neutral scenario suggests that ETHUSD might trade within a defined range for a period, likely awaiting clearer directional cues from macroeconomic data or significant market news. This could see price action oscillating between the immediate 1-hour resistance of $1,891.84 and support at $1,868.34, or a slightly wider daily range between $1,874.22 and $1,956.29. Such a period would be characterized by lower volume and choppier price action, making it difficult for trend-following strategies.
Neutral Scenario: Range-Bound Consolidation
25% Probability| Indicator | Value | Signal | Interpretation |
|---|---|---|---|
| RSI (14) | 59.95 | Bullish | Suggests underlying buying pressure on daily timeframe. |
| MACD Histogram | Positive | Bullish | Indicates positive momentum on daily chart. |
| Stochastic | K=84.55, D=79.73 | Bullish | Strong buy signal, moving towards overbought. |
| ADX | 22.66 | Neutral | Moderate trend strength on daily, indicating potential for movement. |
| Bollinger | Middle Band | Watch | Price is above the middle band, supporting bullish trend. |
Frequently Asked Questions: ETHUSD Analysis
What happens if ETHUSD breaks below the $1,874.22 daily support level?
A daily close below $1,874.22 would invalidate the current bullish structure and trigger a bearish scenario. This could lead to a rapid decline towards the $1,827.25 support, with potential further downside to $1,792.15 if selling pressure intensifies.
Should I buy ETHUSD at current levels of $1,877.38 given the mixed signals?
Buying at current levels carries risk due to conflicting short-term indicators. A more prudent approach would be to wait for confirmation: either a hold of $1,868.34 support with a subsequent break above $1,891.84 resistance, or a clear break below $1,874.22 to reassess bearish targets.
Is the RSI at 59.95 on the daily chart a buy signal for ETHUSD?
An RSI of 59.95 on the daily chart is considered neutral but trending bullishly, indicating room for further upside before becoming overbought. It supports the overall bullish sentiment but isn't a standalone buy signal; confirmation from price action and other indicators is crucial.
How will the strong DXY at 100.7 affect ETHUSD this week?
A strong DXY at 100.7 typically exerts downward pressure on risk assets like ETHUSD. However, ETHUSD's resilience suggests it might be driven by crypto-specific factors. If DXY continues to rise and risk appetite fades, it could exacerbate any bearish move in ETHUSD.
Track markets in real-time
AI-powered analysis, technical indicators and real-time price data.
Join Our Telegram Channel
Breaking market news, AI analysis and trading signals instantly.
Join Channel