

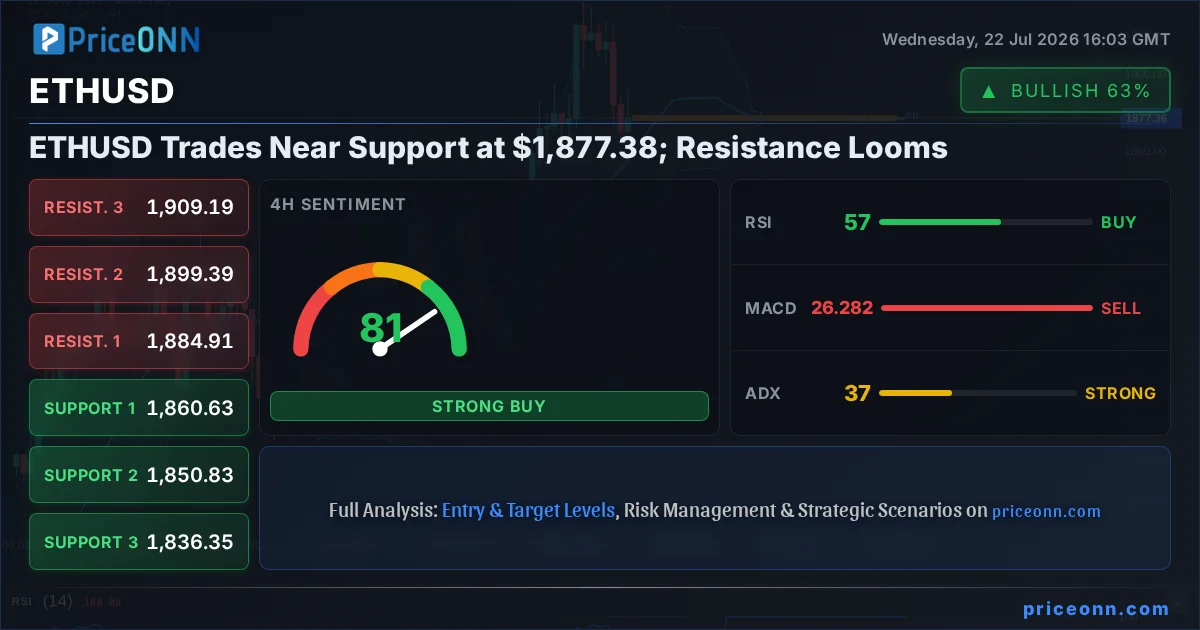
Is ETHUSD poised for a rebound or further decline as it hovers precariously around the $1,877.38 mark? The current market context presents a complex picture, with conflicting technical indicators and a cautious macroeconomic environment. As traders navigate this choppy terrain, understanding the interplay between on-chain data, technical patterns, and broader market correlations becomes paramount. This analysis delves into the intricate details of ETHUSD's current position, exploring the key levels, indicator signals, and potential scenarios that could shape its trajectory in the coming sessions. We aim to provide a data-driven perspective, cutting through the noise to identify actionable insights for both short-term traders and long-term investors.
- ETHUSD is currently trading at $1,877.38, testing crucial support zones.
- The 1-hour RSI at 39.48 signals waning bearish momentum, while the 4-hour RSI at 56.88 suggests underlying bullish strength.
- Key support for ETHUSD is identified at $1,868.34, with immediate resistance seen at $1,891.84.
- The ADX indicator shows a strong trend on multiple timeframes (1H: 29.09, 4H: 37.06, 1D: 22.66), indicating potential for significant price movement.
- Correlation with the rising DXY (100.7) suggests potential headwinds for ETHUSD if dollar strength persists.
The cryptocurrency market, and Ethereum (ETHUSD) in particular, is currently navigating a critical juncture. After a period of volatility, ETHUSD has found itself testing key support levels, with the current price hovering around $1,877.38. This level is not just a random number; it represents a confluence of previous price action and psychological significance for market participants. The daily timeframe shows ETHUSD has experienced a notable daily decline of -2.28%, shedding $43.81 from its previous close. This downward pressure has pushed the price into a zone where previous buying interest was observed, making the defense of $1,877.38 a crucial battleground for the bulls. However, mixed signals from various technical indicators across different timeframes paint a complex picture, demanding a nuanced approach to trading and investment decisions.
Navigating the Technical Landscape: A Multi-Timeframe Perspective
A deep dive into the technicals reveals a fascinating dichotomy. On the 1-hour chart, ETHUSD presents a picture of potential stabilization. The Relative Strength Index (RSI) stands at 39.48, a level that, while not oversold, indicates that the recent selling pressure might be losing steam. This is further supported by the Stochastic Oscillator, where the %K line (26.28) has crossed above the %D line (20.63), historically a precursor to upward momentum. However, the MACD indicator on this timeframe remains in negative territory, with its histogram below the signal line, suggesting that bearish momentum, though potentially weakening, still holds sway. The Average Directional Index (ADX) at 29.09 indicates a strong trend is in play, which could mean that if support holds, the subsequent move might be significant, but if it breaks, the fall could be swift.
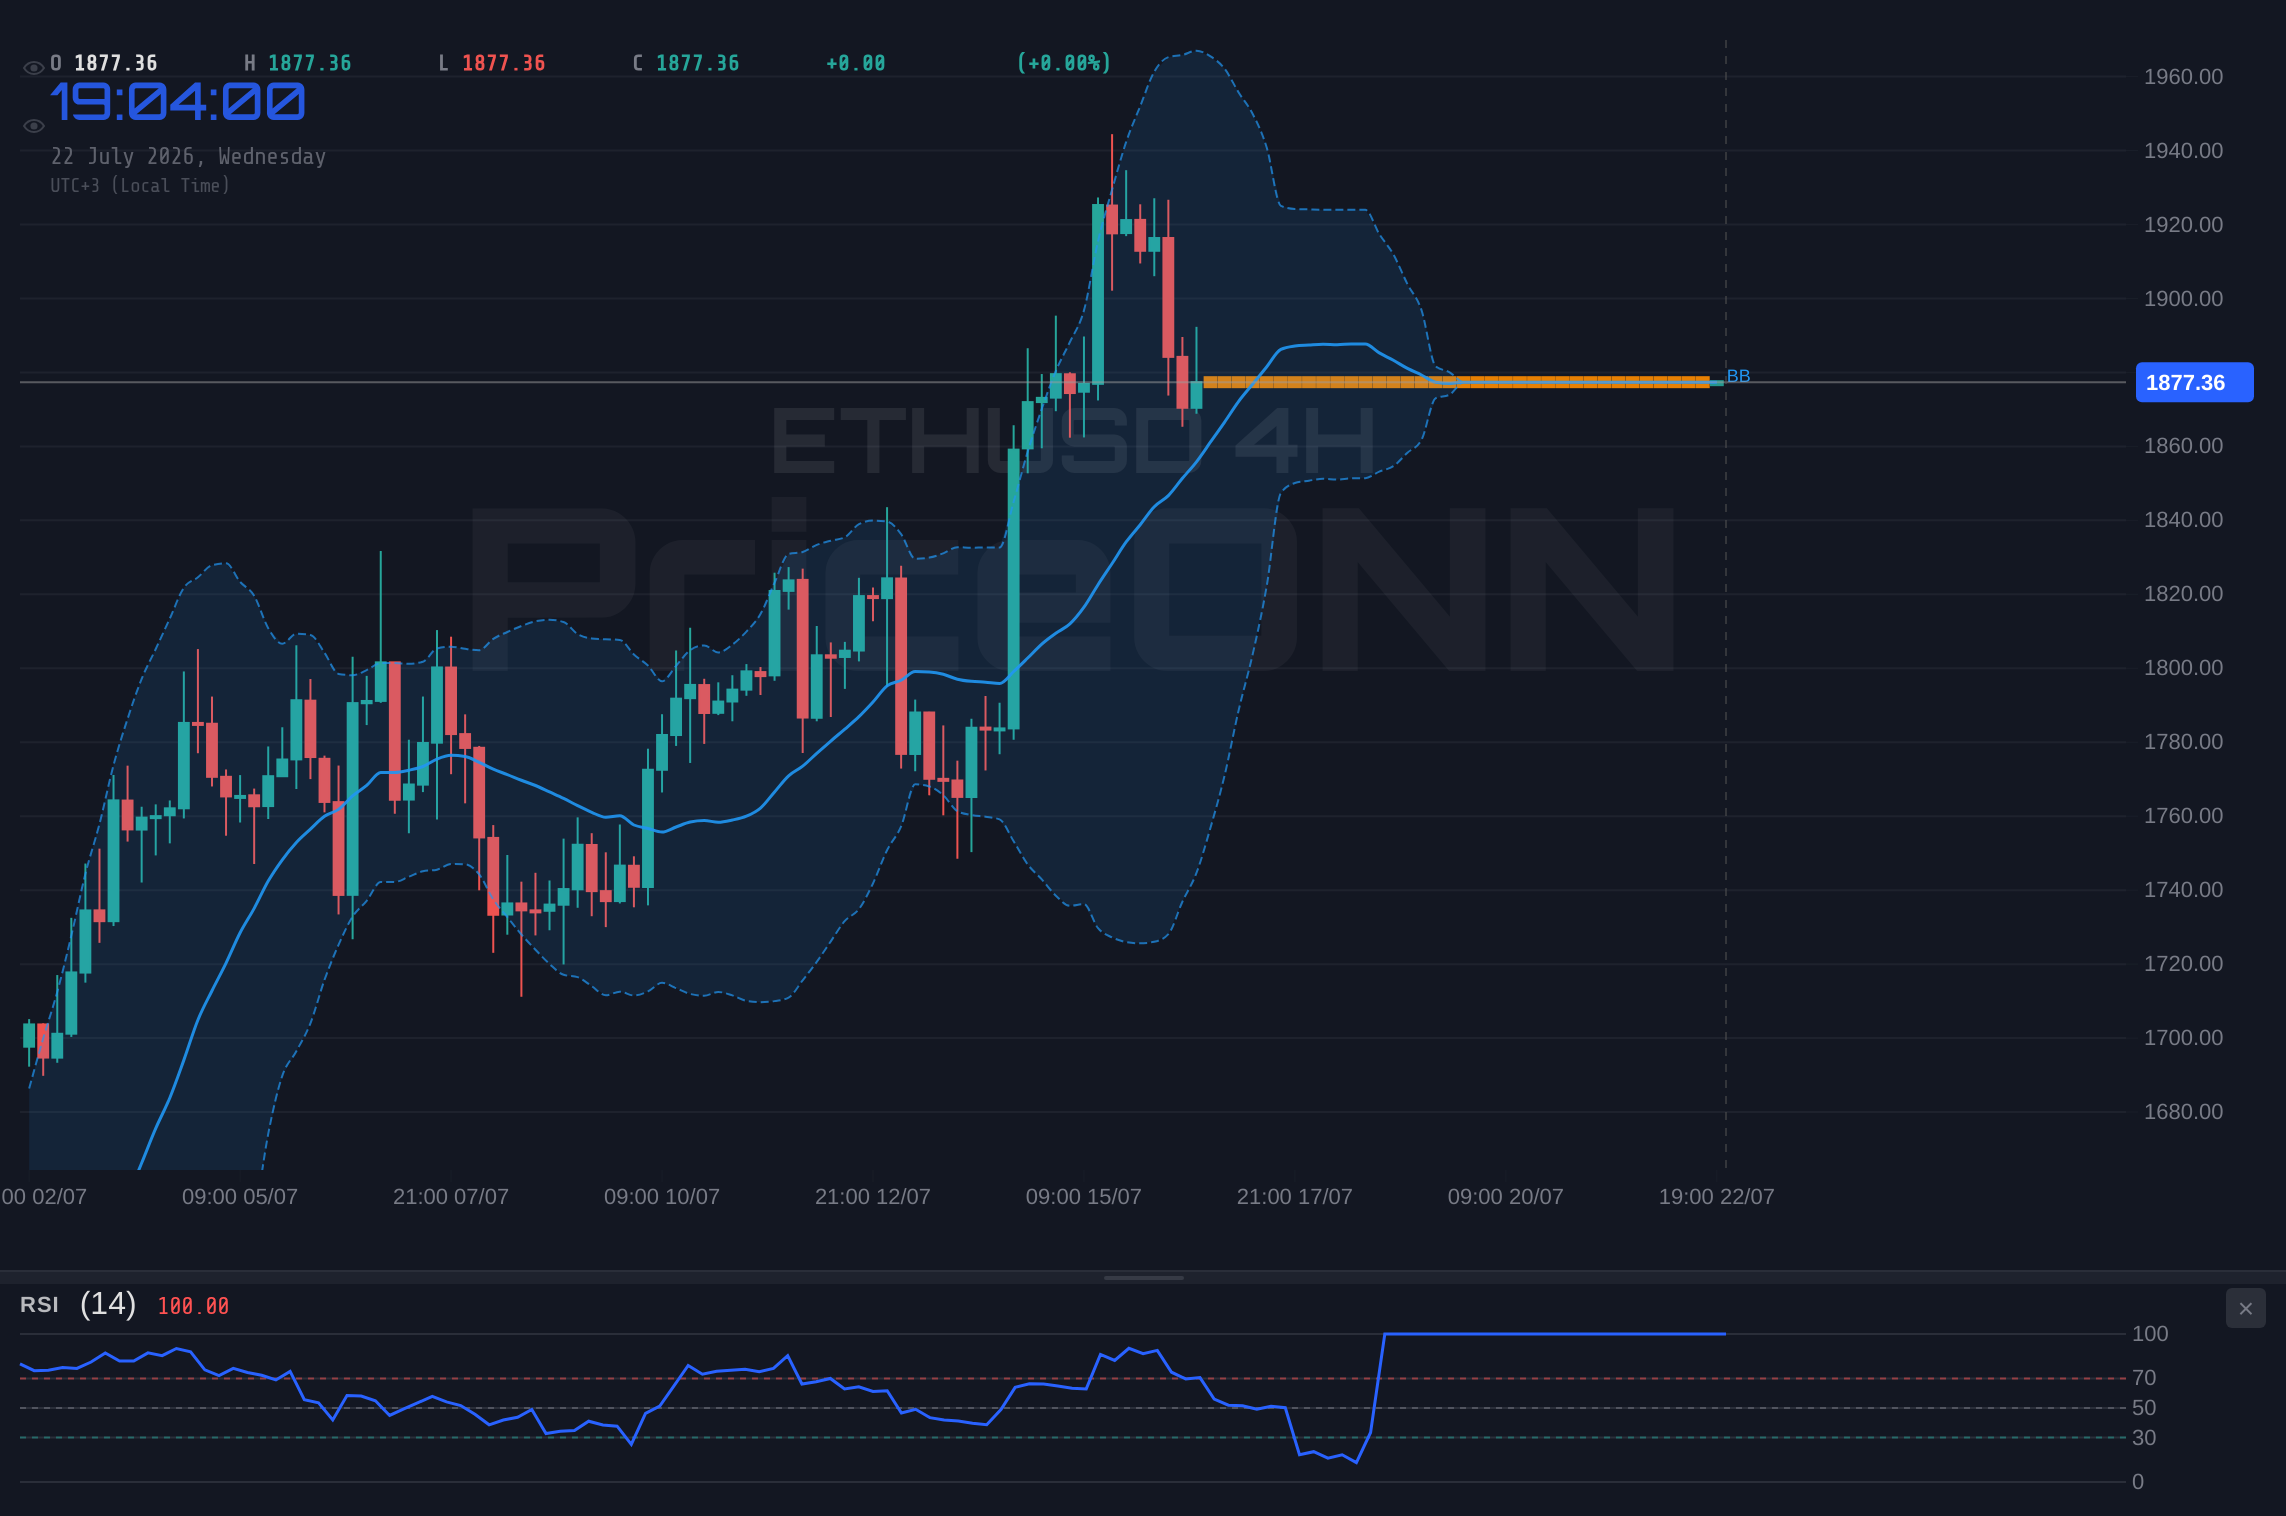
Shifting our focus to the 4-hour timeframe, the narrative gains a more bullish hue. The RSI here sits at a more robust 56.88, firmly within the neutral-to-bullish zone, indicating that buyers might be regaining some control. The ADX on this timeframe is even stronger at 37.06, confirming a powerful trend is active. While the MACD shows negative momentum, the fact that it's above the signal line suggests a potential shift is brewing. The Stochastic Oscillator here, however, presents a bearish signal with %K (18.24) below %D (57.76), indicating a potential short-term pullback within the broader uptrend. This contrast between the 1H and 4H charts highlights the importance of considering multiple timeframes; a short-term trader might see bearish signals on the hourly, while a swing trader might be more inclined to focus on the stronger bullish undertones on the 4-hour chart.
The daily chart provides the long-term context, and here, ETHUSD shows resilience despite recent price action. The RSI at 54.21 is comfortably in the neutral zone, suggesting ample room for both upward and downward movement without being overextended. The MACD is positive, with the MACD line above the signal line, reinforcing the idea that the longer-term trend might still favor the bulls. The Stochastic Oscillator on the daily chart is particularly compelling, with %K at 83.32 and %D at 75.77, showing a strong bullish signal as %K has decisively crossed above %D in overbought territory. This suggests that while there might be immediate selling pressure, the underlying sentiment on the daily chart remains constructive. The ADX at 23.34 indicates a moderate trend, which could accelerate if key levels are breached. The confluence of these indicators on the daily timeframe suggests that the current dip might be a temporary correction within a larger upward trend.
Key Levels and Price Action Insights
Examining the immediate price action, the support levels provided are critical. On the 1-hour chart, the first line of defense is at $1,868.34, followed by $1,856.83. A break below $1,868.34 could trigger further selling pressure, potentially leading to a test of the $1,856.83 level. Conversely, resistance on the hourly chart is located at $1,891.84, and a sustained move above this level could signal a short-term recovery. On the 4-hour chart, the immediate support is at $1,860.63, and a more significant support zone lies around $1,850.83. Breaking these levels would invalidate the bullish bias from this timeframe. The resistance on the 4-hour chart begins at $1,884.91, with a more substantial hurdle at $1,899.39. These levels are not arbitrary; they represent areas where significant buying or selling pressure has historically emerged, and their behavior will be key to understanding ETHUSD's next move.
The daily support levels are even more significant for long-term trend analysis. The first major support is at $1,874.22, which ETHUSD is currently probing. A failure to hold this level could see prices gravitate towards $1,827.25, a more critical support zone. Below that, $1,792.15 represents a deeper level of support, the breach of which would signal a significant bearish shift. On the resistance side, the daily chart points towards $1,956.29 as the first key hurdle, followed by $1,991.39. A decisive break above $1,956.29 would be a strong bullish signal, suggesting a potential continuation of the upward trend. The interplay between these support and resistance levels, dictated by the real-time price action, will be the primary determinant of ETHUSD's short-to-medium term direction. The fact that ETHUSD is trading near the daily support at $1,874.22, while showing some bullish signs on longer timeframes, creates a classic risk/reward scenario for traders.
Macroeconomic Undercurrents and Correlation Analysis
Beyond the charts, macroeconomic factors are playing a significant role. The Dollar Index (DXY) is currently at 100.7, showing a noticeable upward trend on the 1-hour and 4-hour charts, though it shows a neutral signal on the daily. Historically, a stronger dollar tends to exert downward pressure on risk assets like Ethereum. If the DXY continues its ascent, it could act as a significant headwind for ETHUSD, potentially exacerbating any downward price movements. Conversely, a weakening dollar could provide a much-needed tailwind for crypto assets.
The performance of major stock indices also offers crucial context. The SP500 is trading at 6572.87 with a strong bullish trend on the 1-hour and 4-hour charts, despite a bearish signal on the daily. The Nasdaq100, however, shows a more mixed picture, with a bearish trend on the 1-hour and 4-hour charts, and a bearish daily trend. This divergence in equity markets suggests a selective risk appetite. While some sectors are showing strength, others are faltering, which could translate into cautious sentiment towards riskier assets like cryptocurrencies. The recent news regarding Middle East escalations and its impact on oil prices, with Brent crude at $83.79 and WTI at $79.59, adds another layer of complexity. Higher oil prices can fuel inflation concerns, potentially influencing central bank policy and, by extension, risk asset valuations. While gold has shown resilience amid these geopolitical tensions, ETHUSD's correlation with broader risk assets means it could be sensitive to any significant shifts in global risk sentiment.
Trade Scenarios and Probability Assessment
Bearish Scenario: Support Breakdown
65% ProbabilityNeutral Scenario: Consolidation Above Support
25% ProbabilityBullish Scenario: Rebound from Support
10% ProbabilityFrequently Asked Questions: ETHUSD Analysis
What happens if ETHUSD breaks below $1,868.34 support?
A break below $1,868.34 could trigger further selling pressure, with the bearish scenario targeting $1,856.83 as the first key level. The ADX at 29.09 on the 1-hour chart suggests this move could be swift.
Should I buy ETHUSD at current levels of $1,877.38 given the mixed signals?
Caution is advised. While the 4-hour RSI at 56.88 shows bullish potential, the 1-hour chart and a bearish trigger condition for the primary scenario suggest waiting for confirmation. A move above $1,891.84 would be a stronger buy signal.
Is the RSI at 39.48 on the 1-hour chart a buy signal for ETHUSD?
Not necessarily on its own. While it indicates waning bearish momentum, it's not yet oversold. The MACD on the same timeframe is still bearish, and confirmation from price action above resistance at $1,891.84 is needed.
How will the rising DXY at 100.7 affect ETHUSD this week?
A persistently strong DXY can create headwinds for ETHUSD, potentially limiting upside or exacerbating downward moves. Traders should monitor DXY's trend for signs of reversal or continuation, as it often correlates inversely with crypto assets.
Track markets in real-time
AI-powered analysis, technical indicators and real-time price data.
Join Our Telegram Channel
Breaking market news, AI analysis and trading signals instantly.
Join Channel