

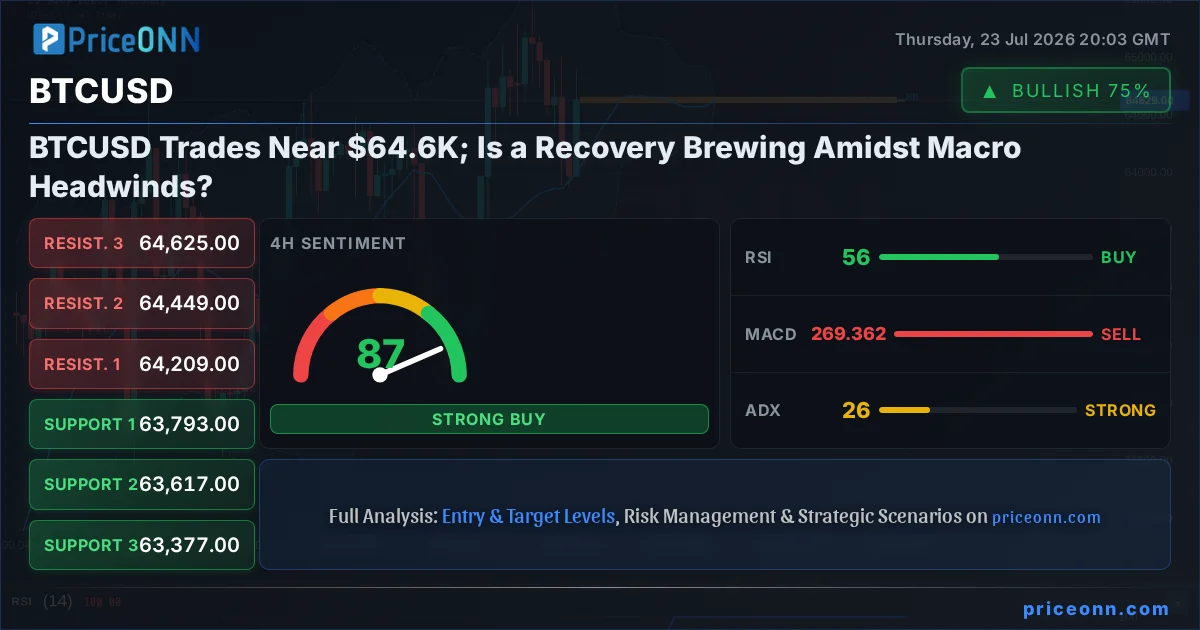
The cryptocurrency market, led by Bitcoin (BTCUSD), is currently navigating a complex landscape where macro headwinds are increasingly dictating price action. As BTCUSD trades near the $64,629.65 mark, a cautious sentiment prevails, with traders closely monitoring global economic indicators and geopolitical developments for clues about the next significant move. While the digital asset space has shown resilience, the interplay between inflation fears, central bank policies, and risk appetite is creating a challenging environment for even the most established cryptocurrencies. This analysis delves into the current technical setup for BTCUSD, examines its correlation with traditional markets and key macro drivers, and explores potential scenarios traders should be aware of.
- BTCUSD is currently trading around $64,629.65, showing neutral momentum across timeframes.
- Critical support for BTCUSD sits at $64,387, with resistance eyed at $64,963.
- The DXY is at 100.7, indicating dollar strength which typically pressures risk assets like Bitcoin.
- Oil prices are climbing, raising inflation concerns that could influence central bank policy and Bitcoin's correlation with safe-haven assets.
- A daily close above $64,963 would be needed to signal a stronger bullish continuation.
Navigating the Macrocurrents: Why Global Factors Matter for BTCUSD
The narrative around Bitcoin has evolved significantly. No longer solely driven by its own internal ecosystem dynamics, BTCUSD's price action is now deeply intertwined with global macroeconomic trends. The current strength in the US Dollar Index (DXY), currently at 100.7, serves as a stark reminder of this correlation. A stronger dollar often implies tighter global liquidity or a flight to safety, which can siphon capital away from riskier assets like cryptocurrencies. Traders watch the DXY closely; a sustained move above its key resistance levels could signal further headwinds for BTCUSD, potentially pushing it towards its support zones. The fact that the DXY shows a mixed signal across different timeframes - bullish on 1H and 1D, neutral on 4H - adds a layer of complexity, suggesting that the dollar's influence might be fluctuating rather than consistently dominant.
Adding to the macro complexity is the surge in oil prices. Brent crude is trading near $83.79, and WTI at $79.59, fueled by geopolitical tensions in the Middle East. Rising energy costs have a direct impact on inflation expectations. If inflation proves persistent, central banks, particularly the Federal Reserve, may be forced to maintain a hawkish stance or even hike rates further. This scenario would typically strengthen the dollar and weaken risk assets. However, the market's reaction to oil prices has been mixed; while Brent shows a strong bullish signal on the 4H chart, its 1H counterpart leans bearish. This divergence hints at uncertainty about the sustainability of the oil rally and its ultimate inflationary impact. For BTCUSD, this creates a tug-of-war: potential safe-haven flows into Bitcoin if geopolitical risks escalate dramatically, versus selling pressure if inflation fears lead to tighter monetary policy.
The performance of major stock indices also provides crucial context. The S&P 500, currently at 6572.87, shows a strong bullish trend on the 1H and 4H charts, yet its daily timeframe paints a picture of a potential reversal with a bearish signal. Nasdaq 100, meanwhile, is in a clear downtrend on its 1H and 4H charts, trading at 29164.86. This divergence within the equity markets suggests underlying fragility. A significant risk-off shift in equities, particularly if driven by inflation concerns or geopolitical escalation, could spill over into the crypto market. Historically, Bitcoin has shown an increasing correlation with tech stocks, meaning a sharp decline in the Nasdaq could drag BTCUSD lower. Conversely, if the S&P 500's strength holds and the Nasdaq finds a bottom, it could provide a more stable backdrop for risk assets, including Bitcoin.
BTCUSD: The Technical Tightrope Walk Near $64.4K
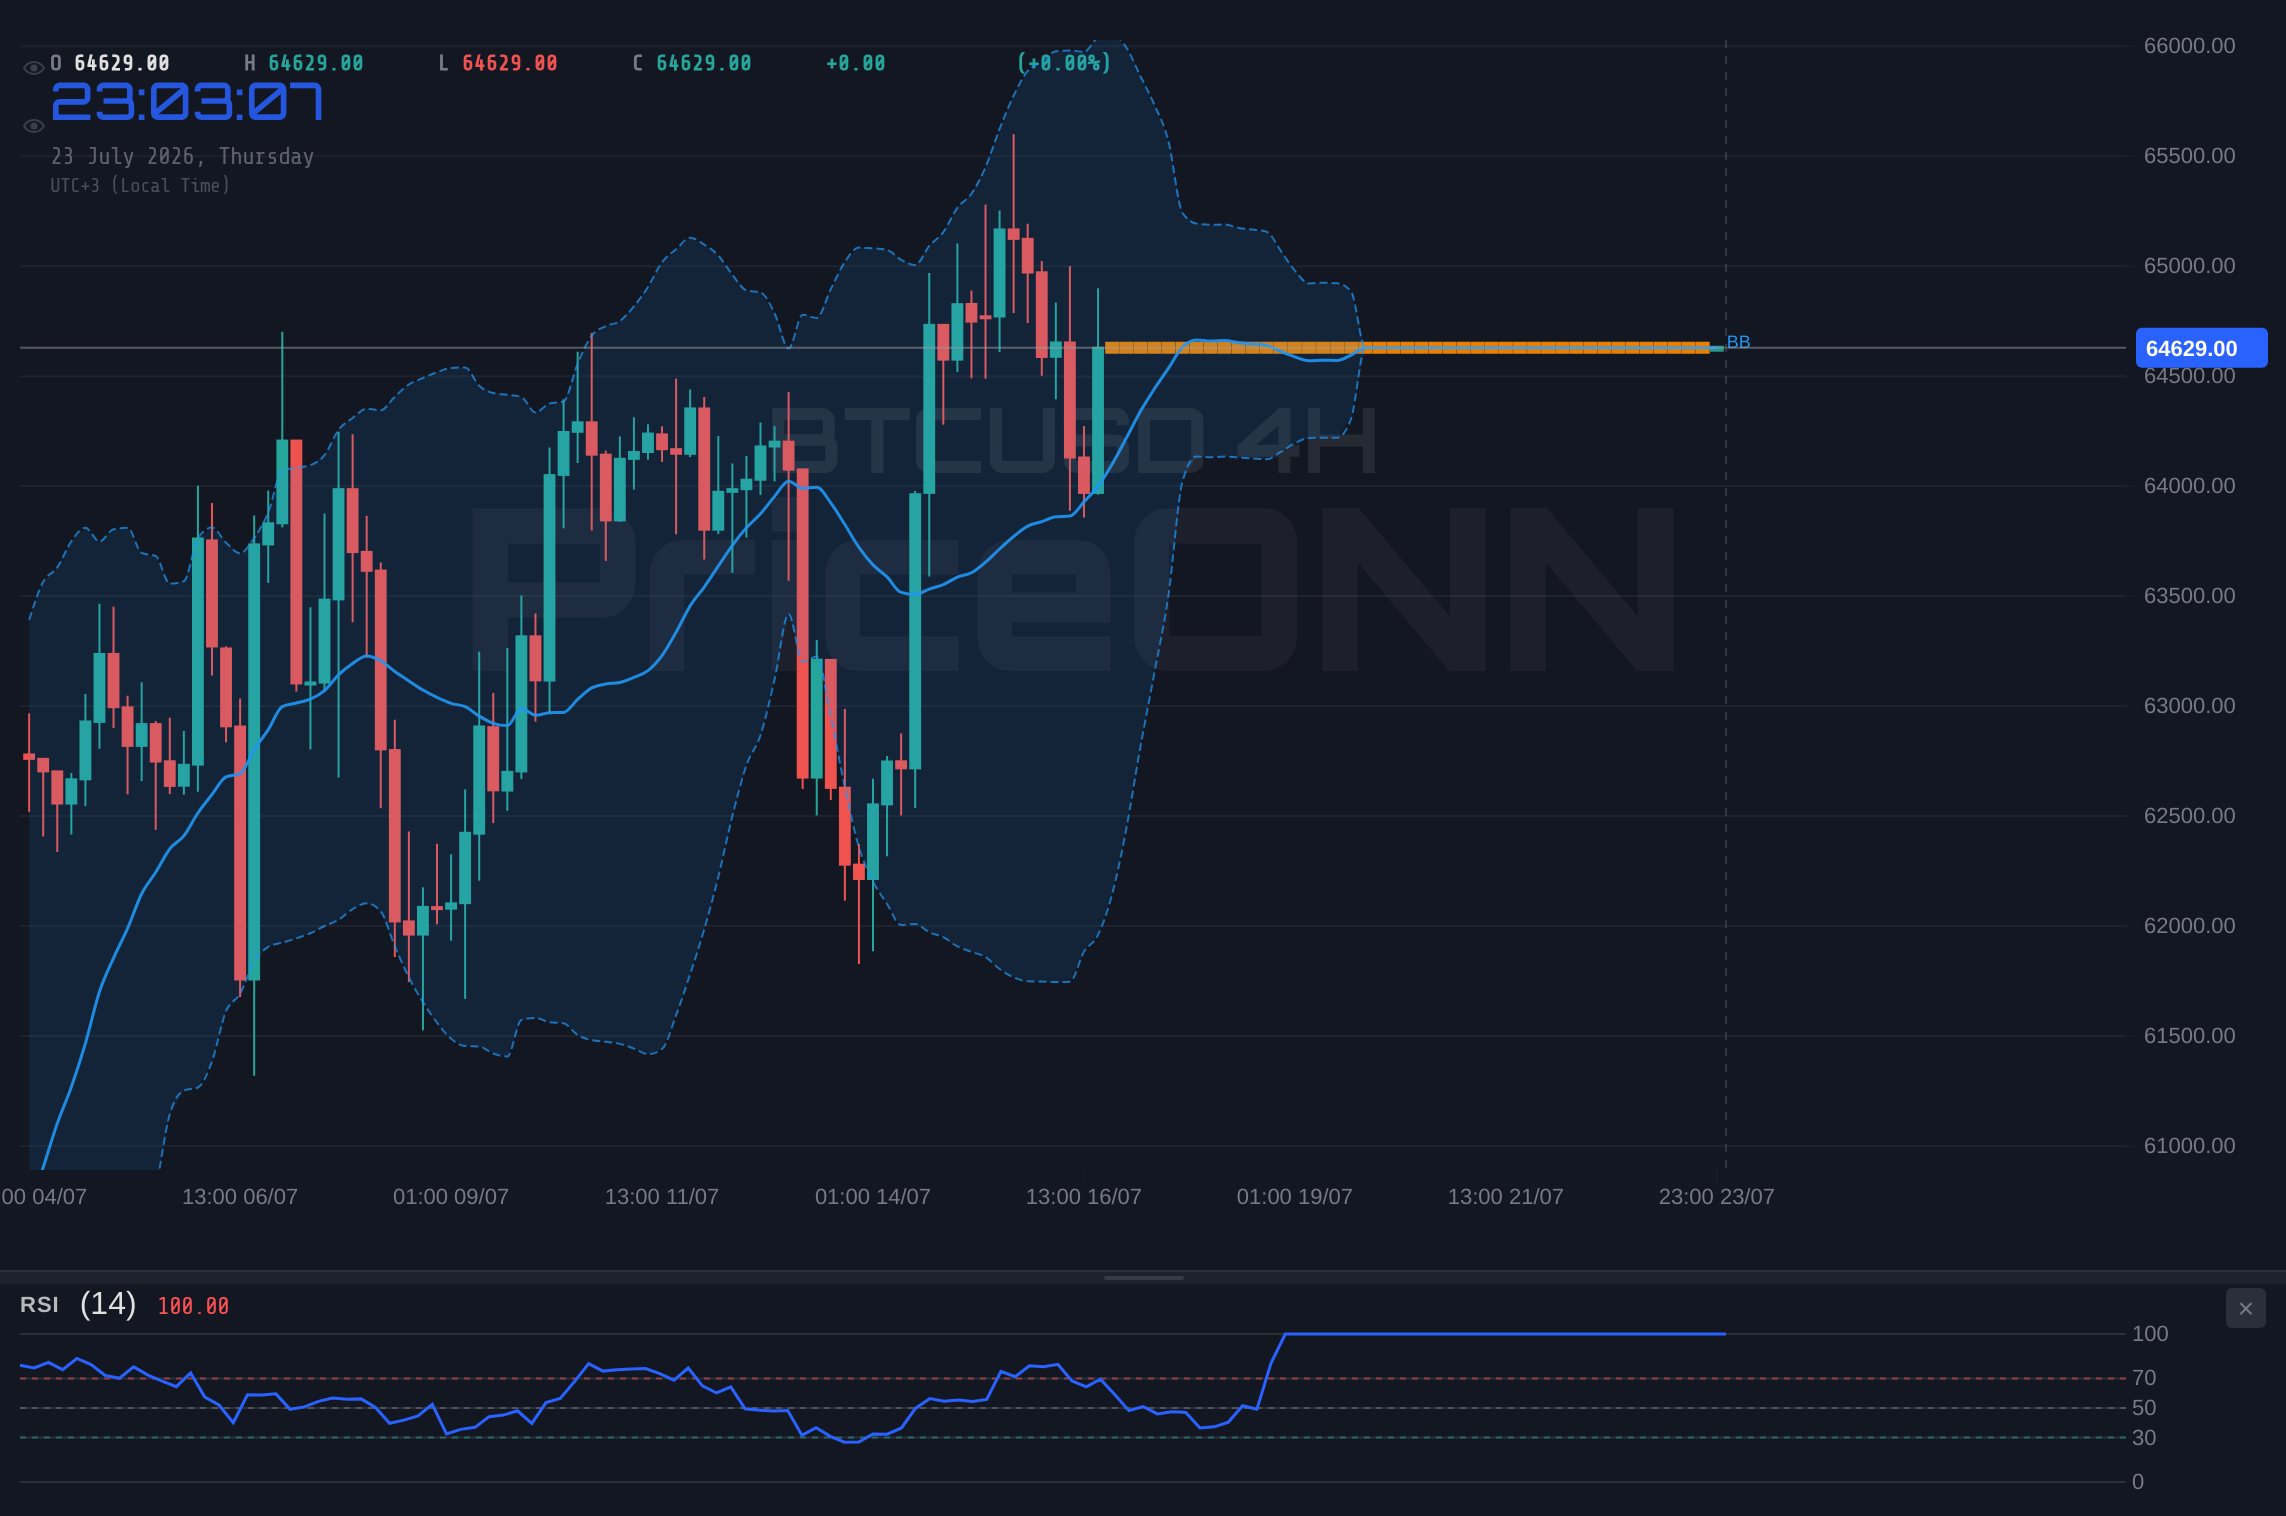
Focusing on BTCUSD itself, the technical picture is one of consolidation and indecision. Across multiple timeframes, the primary signals hover around neutral or mixed, reflecting the market's current state of flux. On the 1-hour chart, BTCUSD shows a neutral trend with a 50% strength rating. The RSI at 52.25 is in neutral territory, suggesting neither strong buying nor selling pressure is dominant. MACD is positive, indicating some underlying bullish momentum, and stochastic is showing a bullish crossover (%K > %D) at 72.37/42.57, hinting at potential upward movement. However, the ADX at 18.19 suggests a weak trend, meaning any upward move might lack conviction and could easily reverse. The immediate resistance is seen at $64,963, with support identified at $64,387.
The 4-hour timeframe offers a slightly more nuanced view. While the trend is still classified as neutral (50% strength), the RSI at 56.15 leans towards a bullish inclination, still comfortably within neutral bounds. The MACD, however, has flipped to negative momentum, crossing below its signal line, which is a bearish sign. This contradicts the stochastic's bearish signal (%K
On the daily chart, BTCUSD presents a more balanced, albeit still indecisive, outlook. The trend is neutral with 50% strength. The RSI at 54.21 is comfortably in the mid-zone, offering no strong conviction. MACD maintains positive momentum, suggesting that the longer-term upward bias might still be intact, but the stochastic is firmly bullish with %K at 83.32 and %D at 75.77, indicating an overbought condition is approaching. The ADX reading of 23.34 suggests a moderate trend, but its directionality is less clear in the context of conflicting oscillator signals. The key daily support level is $64,439.33, and resistance is at $65,551.33. A decisive break above this resistance, ideally on increased volume, would be needed to signal a more robust recovery.
The $64,387 support level is paramount. A daily close below this threshold could trigger significant sell-offs, potentially targeting lower support levels and invalidating any immediate recovery hopes. Conversely, a sustained push above the $64,963 resistance, confirmed by higher trading volumes, would be the first sign of renewed bullish conviction.
Crypto Ecosystem: Beyond Price - On-Chain and DeFi Pulse
While price action captures immediate attention, a deeper dive into Bitcoin's on-chain metrics and the broader crypto ecosystem reveals underlying trends. Active addresses, a measure of network usage, have seen fluctuations but remain at levels that suggest sustained network participation. However, a significant increase in active addresses typically precedes major price rallies, and we are not seeing that surge yet. Whale movements also warrant close observation. Large holders accumulating or distributing significant amounts of BTC can be leading indicators. Currently, there are no overt signs of panic selling or aggressive accumulation by whales, pointing towards a market waiting for clearer direction.
Exchange flows provide another crucial lens. Net inflows of Bitcoin onto exchanges often signal selling pressure, while net outflows suggest accumulation or a belief in holding for the long term. Recent data indicates relatively stable exchange flows, neither showing a massive influx of sell-side liquidity nor a significant withdrawal for long-term storage. This neutrality in exchange flows mirrors the indecisive price action, reinforcing the idea that the market is in a holding pattern. The hash rate, a measure of the network's security and mining power, remains robust, indicating that miners are still committed to the network, which is a fundamentally positive sign for Bitcoin's long-term viability.
The DeFi and NFT sectors, while often seen as distinct from Bitcoin's price movement, can offer insights into broader crypto market sentiment and innovation. A healthy and growing DeFi ecosystem, characterized by increasing Total Value Locked (TVL) and vibrant activity in decentralized exchanges (DEXs) and lending protocols, can attract capital back into the crypto space, indirectly benefiting Bitcoin. Conversely, stagnation or decline in TVL, rising gas fees without corresponding price appreciation, or a slowdown in NFT sales could signal waning retail interest and a risk-off sentiment within the crypto community. Currently, while there are pockets of innovation, the overall DeFi and NFT markets are exhibiting a cautious recovery, mirroring Bitcoin's own hesitant price action. The focus remains on whether new narratives or technological advancements can reignite broader ecosystem growth.
Regulatory Landscape and Institutional Adoption: The Long Game
The regulatory environment continues to be a significant factor influencing institutional adoption and, consequently, Bitcoin's price trajectory. While specific news regarding major regulatory shifts hasn't dominated the last 48 hours, the ongoing dialogue and evolving frameworks globally remain critical. Developments in the US, particularly around ETF approvals and potential new legislation, alongside regulatory clarity (or lack thereof) in regions like Europe and Asia, shape how institutions approach the asset class. The recent pause in Bitcoin's recovery, as noted in market overviews, could partly be attributed to a wait-and-see approach from institutional players until regulatory uncertainties are further clarified. The absence of major negative regulatory news is a positive, but the market is likely pricing in the potential for future developments.
Institutional adoption trends, particularly in the form of Bitcoin ETFs, remain a key narrative. While current flows might not be surging, the established presence of these products in the market signifies a structural shift. Any significant uptick in ETF inflows could provide a powerful catalyst for BTCUSD. Conversely, sustained outflows from these products would signal institutional deleveraging or a loss of confidence. The correlation between Bitcoin and traditional risk assets, like the S&P 500, is also influenced by institutional behavior. If institutions rotate back into risk assets, Bitcoin could benefit, but this hinges on broader economic stability and favorable monetary policy expectations. For now, the institutional narrative is one of cautious engagement, waiting for clearer signals on both regulation and macroeconomic stability.
Focus on the confluence of technical levels and macro events. A bullish technical setup on BTCUSD is more likely to succeed if supported by a weakening DXY, falling oil prices, or a risk-on sentiment in equities. Always manage risk, as the macro environment can quickly override purely technical signals.
Trade Scenarios: What's Next for BTCUSD?
Bearish Scenario: Testing the Lower Bounds
65% ProbabilityConsolidation Scenario: Range-Bound Battle
25% ProbabilityBullish Scenario: Recovery Momentum
10% ProbabilityFrequently Asked Questions: BTCUSD Analysis
What happens if BTCUSD breaks below the $64,387 support level?
A decisive break below the $64,387 support on the 1-hour chart could trigger further downside movement, potentially targeting the $64,067 level. This would indicate that the current consolidation is resolving to the downside, likely influenced by bearish macro cues or profit-taking.
Should I consider buying BTCUSD at current levels near $64,629.65 given the mixed signals?
Buying at current levels carries significant risk due to mixed technical signals and prevailing macro uncertainties. A more prudent approach would be to wait for confirmation: either a confirmed break above $64,963 resistance with increasing volume, or a clear bounce from the $64,387 support zone.
Is the RSI at 52.25 a bullish or bearish signal for BTCUSD right now?
An RSI reading of 52.25 is considered neutral territory, offering no strong bullish or bearish conviction on its own. While it suggests a slight upward bias, it's not indicative of overbought or oversold conditions, meaning traders should look for confirmation from other indicators or price action.
How might the rising DXY at 100.7 affect BTCUSD in the coming days?
The current DXY level of 100.7 signals dollar strength, which historically correlates inversely with risk assets like Bitcoin. If the dollar continues to strengthen due to macro factors such as inflation concerns or Fed hawkishness, it could put downward pressure on BTCUSD, potentially hindering any recovery attempts.
Technical Outlook Summary
| Indicator | Value | Signal | Interpretation |
|---|---|---|---|
| RSI (14) | 52.25 | Neutral | Balanced momentum, no clear trend indication. |
| MACD Histogram | Positive | Bullish | Suggests upward momentum is currently present. |
| Stochastic | K:72.37, D:42.57 | Bullish Crossover | %K crossed above %D, indicating potential upward move. |
| ADX | 18.19 | Weak Trend | Trend lacks strength, suggesting consolidation or choppy price action. |
| Bollinger Bands | Mid Band Breakout | Bullish | Price is trading above the middle band, indicating upward pressure. |
Key Levels
Support Levels
Resistance Levels
Track markets in real-time
AI-powered analysis, technical indicators and real-time price data.
Join Our Telegram Channel
Breaking market news, AI analysis and trading signals instantly.
Join Channel