

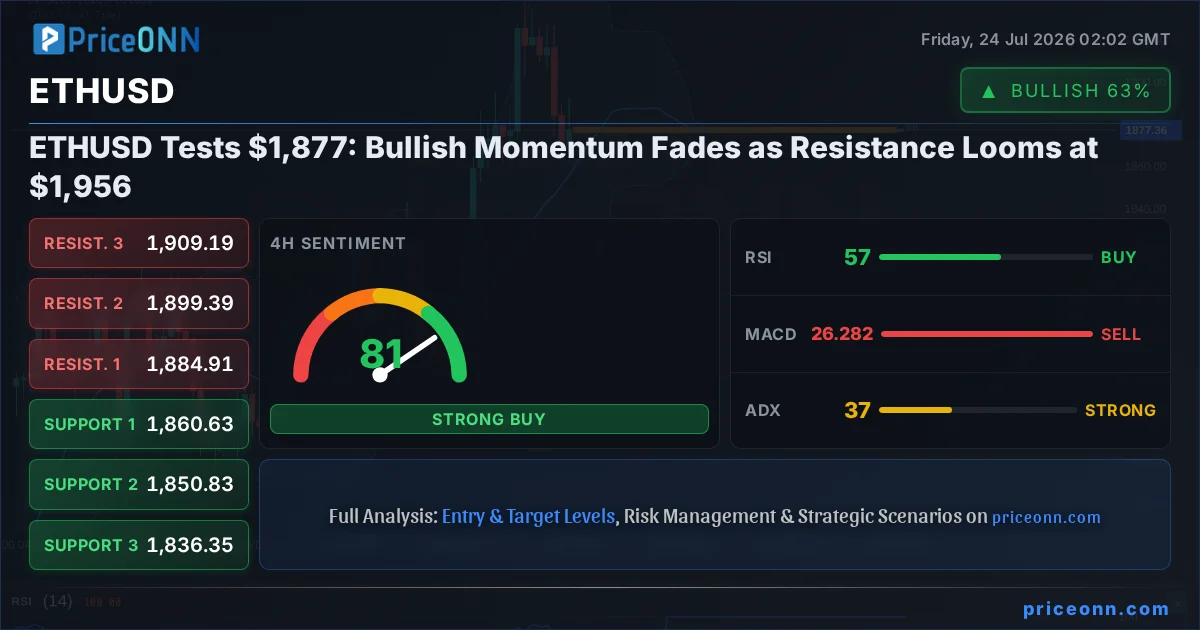
The cryptocurrency market is at a fascinating crossroads, and Ethereum (ETHUSD) is right in the thick of it, currently trading around the critical $1,877.38 level. While short-term technical indicators on the 1-hour and 4-hour charts hint at a possible upward move, the longer-term daily picture, coupled with broader macroeconomic pressures and crypto-specific fundamentals, paints a more complex and cautious narrative. This divergence creates a tense tug-of-war between bulls and bears, making the $1,877.38 price point a crucial battleground. Understanding the forces at play is paramount for navigating this period of uncertainty.
- ETHUSD is currently trading around $1,877.38, with mixed signals across different timeframes.
- The 1H and 4H charts show some bullish indicators, but the daily trend and ADX at 22.66 suggest caution is warranted.
- Key resistance is identified at $1,956.29, with a break above this level needed to confirm a sustained bullish trend.
- Macroeconomic factors like a strengthening DXY at 100.7 and rising oil prices contribute to a risk-averse environment, potentially pressuring ETHUSD.
The current market environment for ETHUSD is a classic example of conflicting signals, a scenario that seasoned traders learn to respect rather than ignore. On the surface, the 1-hour and 4-hour technical data paints a somewhat optimistic picture. The RSI is holding in neutral territory, hovering around 39.48 on the 1H and 56.15 on the 4H, indicating room for upward movement without immediate overbought conditions. MACD on the 1H shows positive momentum, and Stochastic oscillators on both the 1H and 4H charts are showing potential for an uptick. However, the daily chart paints a different story. The ADX reading of 22.66 on the daily chart signifies a moderately strong trend, but the overall signal leans towards caution, with a general sell signal across multiple indicators on the daily timeframe.
This interplay between timeframes is crucial. While short-term traders might see opportunities for quick gains based on the 1H and 4H setups, the dominant daily trend and the cautious overall signal suggest that any upward momentum could be met with significant selling pressure as price approaches higher resistance levels. The $1,877.38 level itself is not just a price point; it's a psychological marker where the market is currently indecisive. A convincing move above the immediate resistance at $1,891.84 is needed to even begin challenging the more significant levels, with the ultimate test lying at the $1,956.29 mark identified on the daily chart.
The Bull Case: Betting on a Breakout Above $1,956
Ethereum's On-Chain Strength Amidst Broader Market Weakness
For the bulls to gain control, they need to overcome not only the immediate technical resistance but also a challenging macroeconomic backdrop. The Dollar Index (DXY) is currently at 100.7, showing strength that typically correlates with pressure on risk assets like Ethereum. Furthermore, Brent crude is trading at $83.79, and WTI at $79.59, indicating rising energy prices that can fuel inflation concerns and prompt tighter monetary policy expectations, further dampening risk appetite. Despite this, the argument for a bullish ETHUSD scenario hinges on the resilience of the Ethereum network itself and its potential to decouple from traditional market pressures, especially if institutional adoption continues to gather steam.
On-chain metrics, while not explicitly provided in the live data, often tell a story of network health. If active addresses remain robust, transaction volumes are healthy, and staking yields are attractive, these fundamental strengths could provide a floor for ETHUSD. The development of the Ethereum ecosystem, including advancements in Layer 2 scaling solutions and the continued growth of DeFi and NFT markets, can create intrinsic demand for ETH, independent of broader market sentiment. A sustained increase in Total Value Locked (TVL) in DeFi protocols or a surge in gas fee efficiency could signal renewed investor confidence in Ethereum's utility and long-term value proposition. The argument here is that Ethereum's unique ecosystem growth can override short-term macro headwinds.
Technical Catalysts for a Bullish ETHUSD Scenario
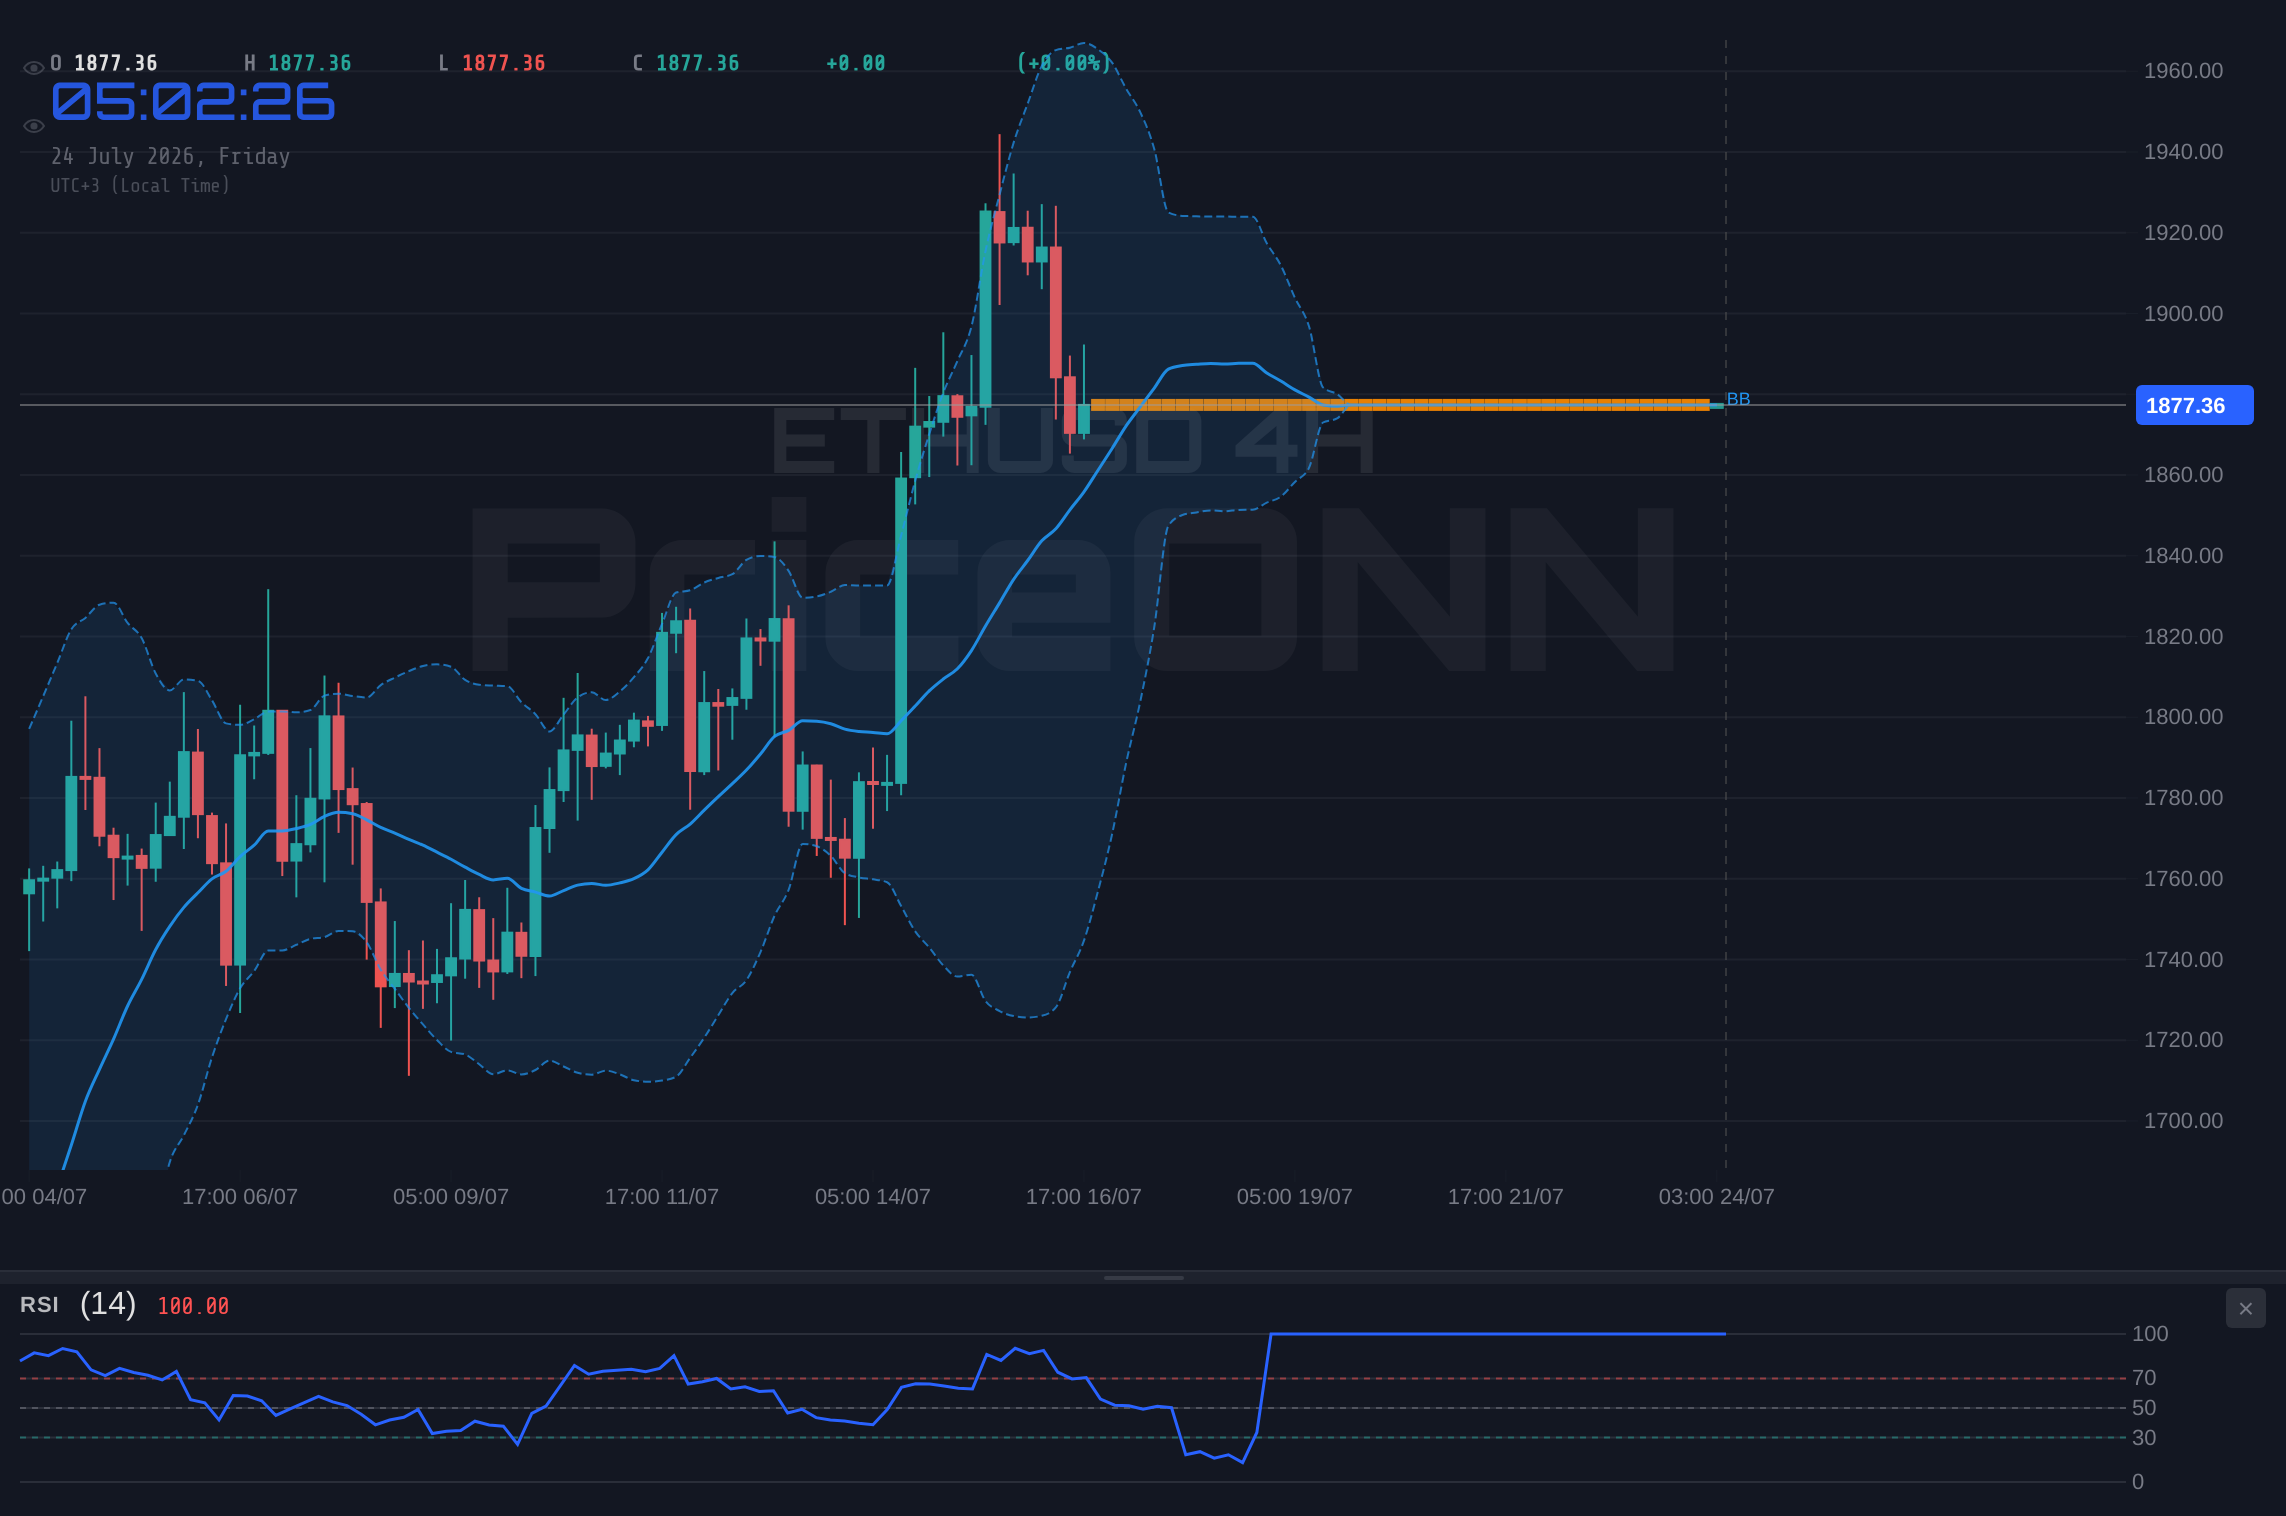
From a purely technical standpoint, the bullish case relies on a decisive break and hold above key resistance levels, particularly the daily resistance at $1,956.29. The 1-hour chart, showing positive MACD momentum and Stochastic K line crossing above D line, suggests immediate buying pressure. If this momentum carries through, the first target would be the 1-hour resistance at $1,891.84. A sustained push through this level, supported by increasing trading volume and a break above the 4-hour resistance at $1,884.91, could then set the stage for a more significant rally towards the daily resistance at $1,956.29. The 1-day Stochastic showing a bullish signal (K=84.55, D=79.73) further supports the idea that, despite the current daily MACD being below its signal line, the longer-term momentum could still swing positive if the price action confirms it.
The ADX indicator provides a nuanced view. While the daily ADX at 22.66 indicates a trend is present, its moderate strength suggests that the current upward move needs more commitment. A bullish scenario would require the ADX to climb above 25, confirming a strengthening trend, ideally accompanied by a rise in trading volume. The RSI, currently at 39.48 on the 1H and 56.88 on the 4H, offers room for growth. A move towards the 70-level on the RSI would signal a more robust bullish trend, though crossing into overbought territory would also necessitate caution regarding potential pullbacks.
The Bear Case: DXY Strength and Macro Headwinds Weighing on ETHUSD
The Dollar's Ascent and Oil's Inflationary Pressure
The bears' argument is significantly bolstered by the current macroeconomic climate. The DXY's current standing at 100.7 is a strong indicator of dollar strength. Historically, a stronger dollar often exerts downward pressure on risk assets, including cryptocurrencies, as it makes dollar-denominated assets more expensive for holders of other currencies. This dynamic can lead to reduced demand for ETHUSD, especially from international investors.
Adding to this pressure is the rise in oil prices. Brent crude at $83.79 and WTI at $79.59 are not just energy market data points; they are signals of potential inflationary pressures. Higher energy costs can translate into broader inflation, which in turn can influence central bank policy. If major central banks, like the Federal Reserve or the European Central Bank (ECB), perceive rising inflation from energy prices, they may be inclined to maintain or even increase interest rates. The ECB, for instance, recently held rates steady at 2.25% but remains watchful of energy shock spillovers. Higher interest rates generally increase the cost of capital, making speculative investments like cryptocurrencies less attractive compared to safer, yield-bearing assets. This macro environment creates a significant headwind for ETHUSD.
Technical Weakness and Conflicting Signals
The technical data, when viewed through a bearish lens, highlights significant challenges for ETHUSD. The daily chart shows a clear downward trend signal, with the overall signal leaning towards 'SELL'. While the 1-hour chart shows some positive MACD momentum, this is overshadowed by the negative MACD on the 4-hour chart and the overall bearish sentiment indicated by the daily signal. The daily RSI, while not yet in oversold territory at 46.36, is trending downwards, suggesting that any upward moves might be short-lived and met with selling pressure.
The ADX on the daily chart, though at 22.66, indicates a trend is in play, and the general signal for ETHUSD across timeframes leans heavily towards 'SELL' on the 1-hour (7 sell, 2 buy) and 4-hour (8 sell, 0 buy) charts. This widespread bearish sentiment across multiple timeframes is a strong signal. The Stochastic on the 4-hour chart (K=18.24, D=57.76) shows a clear bearish signal, and on the daily (K=58.96, D=53.46), it shows a potential for a reversal after an upward move. The Bollinger Bands on the 1-hour and 4-hour charts are below the middle band, reinforcing the bearish short-to-medium term outlook. For the bears, the key is the failure to decisively break above resistance levels, particularly the $1,956.29 daily resistance. A failure to hold above the current support at $1,868.34 on the 1-hour chart would be an immediate bearish confirmation.
The Verdict: Navigating the Neutral Zone with Caution
Synthesizing the Signals: A WATCH_ZONE Recommendation
The current technical and fundamental landscape for ETHUSD presents a clear conflict. The short-term bullish signals on the 1-hour and 4-hour charts are enticing for day traders, but they are significantly challenged by the daily trend, the prevailing macro-economic conditions, and the overall bearish signal across multiple timeframes. The DXY strength and rising oil prices create a risk-off environment that is generally unfavorable for cryptocurrencies. Therefore, despite the pockets of bullishness in the intraday charts, the dominant narrative points towards caution.
The most prudent approach here is a 'WATCH_ZONE' strategy. This means waiting for clearer signals before committing to a significant position. The key level to watch is the daily resistance at $1,956.29. A sustained break and hold above this level, confirmed by increasing volume and a shift in daily indicators towards bullish momentum (e.g., daily MACD crossing above signal line, RSI moving decisively above 50), would be required to invalidate the bearish short-to-medium term outlook. Conversely, a break below the immediate support at $1,868.34 would likely trigger further downside, with the next significant support level at $1,860.63 on the 4-hour chart.
What Traders Should Watch Next
For ETHUSD traders, the immediate focus should be on price action around the $1,877.38 level and the resistance at $1,891.84. A failure to decisively break these levels could lead to a retest of the support at $1,868.34. The broader market context, particularly movements in the DXY and oil prices, will also be critical. Significant shifts in these correlated assets could quickly alter the sentiment for ETHUSD. Furthermore, any news regarding institutional adoption of Ethereum or significant developments within its DeFi and NFT ecosystems could act as catalysts, potentially overriding the current macro pressures. Until a clear directional conviction emerges, characterized by a confirmed breakout above $1,956.29 or a breakdown below key support, patience and risk management remain the most valuable tools.
The Path Forward: Preparing for Clarity
The current market sentiment for ETHUSD is one of anticipation, with bulls and bears locked in a battle around the $1,877.38 mark. While intraday charts offer glimmers of hope for a bullish reversal, the daily technicals, coupled with a strengthening dollar and rising oil prices, present a formidable case for caution. The critical resistance at $1,956.29 stands as a significant barrier that needs to be convincingly breached to signal a true shift in momentum. Until then, traders are advised to adopt a 'WATCH_ZONE' approach, closely monitoring price action, key levels, and correlated market movements. The market always presents opportunities, but they are best seized when the signals are clear and the risk is well-defined. Patient observation around the $1,877.38 level will likely be rewarded with a more predictable trading setup in the near future.
Frequently Asked Questions: ETHUSD Analysis
What happens if ETHUSD breaks above the $1,956.29 resistance level?
A sustained break above $1,956.29, confirmed by daily indicators turning bullish and increased volume, would likely open the door for further upside towards the $2,038.36 level. This would signal a significant shift in market sentiment.
Should I buy ETHUSD at current levels around $1,877.38 given the mixed signals?
Given the conflicting signals between intraday and daily charts, and macro headwinds, it's prudent to wait for confirmation. A close above $1,891.84 on the 1H chart could offer a short-term entry, but a daily close above $1,956.29 provides a higher-probability setup.
Is the RSI at 39.48 on the 1H chart a buy signal for ETHUSD?
An RSI of 39.48 on the 1-hour chart is in the neutral zone, indicating some room for upward movement but not yet an oversold condition. While it doesn't signal an immediate sell, it needs to be viewed in conjunction with other indicators and the broader daily trend, which leans cautious.
How will the strong DXY at 100.7 and rising oil prices affect ETHUSD this week?
A strong DXY at 100.7 and rising oil prices (Brent at $83.79) typically create a risk-off environment, which can pressure ETHUSD. This macro backdrop suggests that any bullish moves might face significant headwinds, and a breakdown below key support levels becomes more probable if these trends persist.
Track markets in real-time
AI-powered analysis, technical indicators and real-time price data.
Join Our Telegram Channel
Breaking market news, AI analysis and trading signals instantly.
Join Channel