

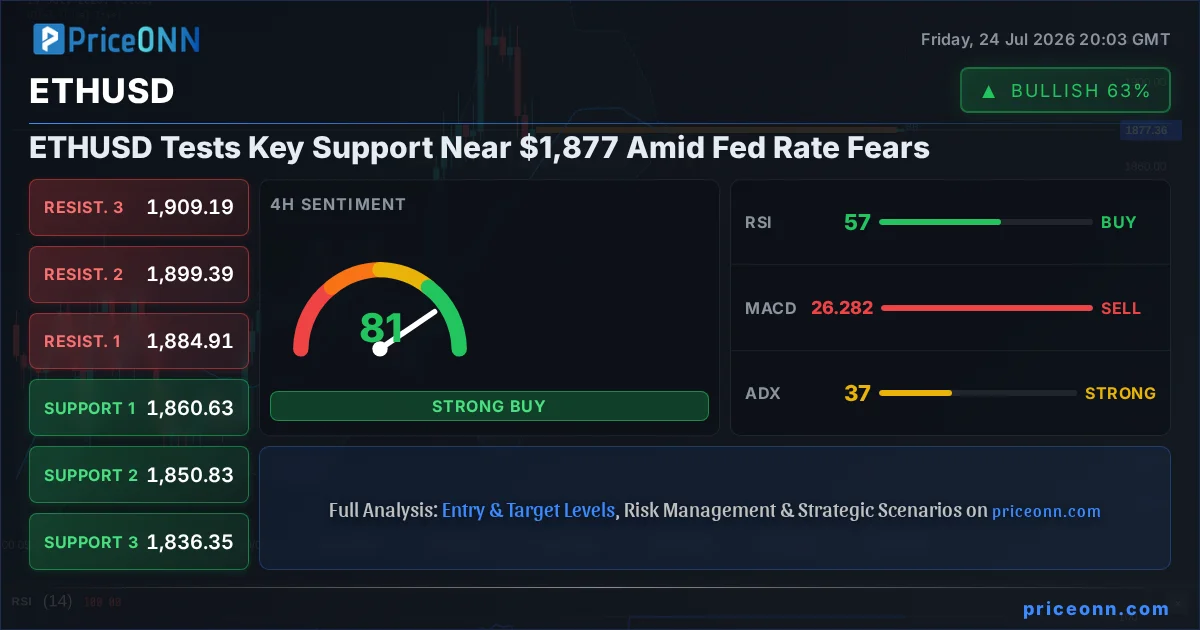
The specter of continued Federal Reserve tightening is casting a long shadow over risk assets, and Ethereum (ETHUSD) is feeling the heat. Currently trading at $1,877.38, ETHUSD has dipped towards critical support levels, mirroring broader market anxieties surrounding inflation and interest rate paths. This analysis delves into the technical underpinnings and macroeconomic forces shaping ETHUSD's immediate future, providing a roadmap for traders navigating this complex environment.
- ETHUSD is currently trading at $1,877.38, showing a bearish trend on 1H and 4H timeframes.
- The Dollar Index (DXY) is at 100.70, contributing to pressure on risk assets like ETHUSD.
- On the 1D chart, RSI is at 59.95, indicating a bullish eğilim within a neutral trend.
- Key support for ETHUSD lies at $1,874.22, while resistance is seen at $1,956.29.
- Fed rate hike expectations are a primary driver, correlating ETHUSD's weakness with DXY strength.
The global financial landscape is currently dominated by a tug-of-war between persistent inflation and central bank resolve. Recent data, particularly the rally in oil prices, has reignited concerns that inflation may prove more stubborn than anticipated. This has led markets to reprice interest rate expectations, with a growing probability that the Federal Reserve might need to maintain a hawkish stance for longer, or even deliver further rate hikes. The Dollar Index (DXY), a key barometer of US dollar strength, currently stands at 100.70 and is showing upward momentum, further pressuring assets like ETHUSD that tend to move inversely to the dollar. This macroeconomic backdrop is crucial for understanding the current price action in the cryptocurrency market.
On the technical front, ETHUSD presents a complex picture across different timeframes. The 1-hour chart suggests a neutral trend with a slight bearish leaning, indicated by a 'SAT' overall signal, although the ADX at 29.09 points to a strong downtrend. The MACD is negative, and RSI is at 39.48, sitting comfortably in neutral territory but trending downwards. Stochastic is showing a potential for a bounce with %K at 26.28 and %D at 20.63, indicating a possible upward signal as %K crosses above %D. However, this is happening below the middle Bollinger band, reinforcing the bearish sentiment on this shorter timeframe. The immediate resistance on the 1H chart is observed at $1,891.84, with support found at $1,868.34. This short-term view suggests caution for day traders, with a bias towards downside risk unless key resistance levels are decisively breached.
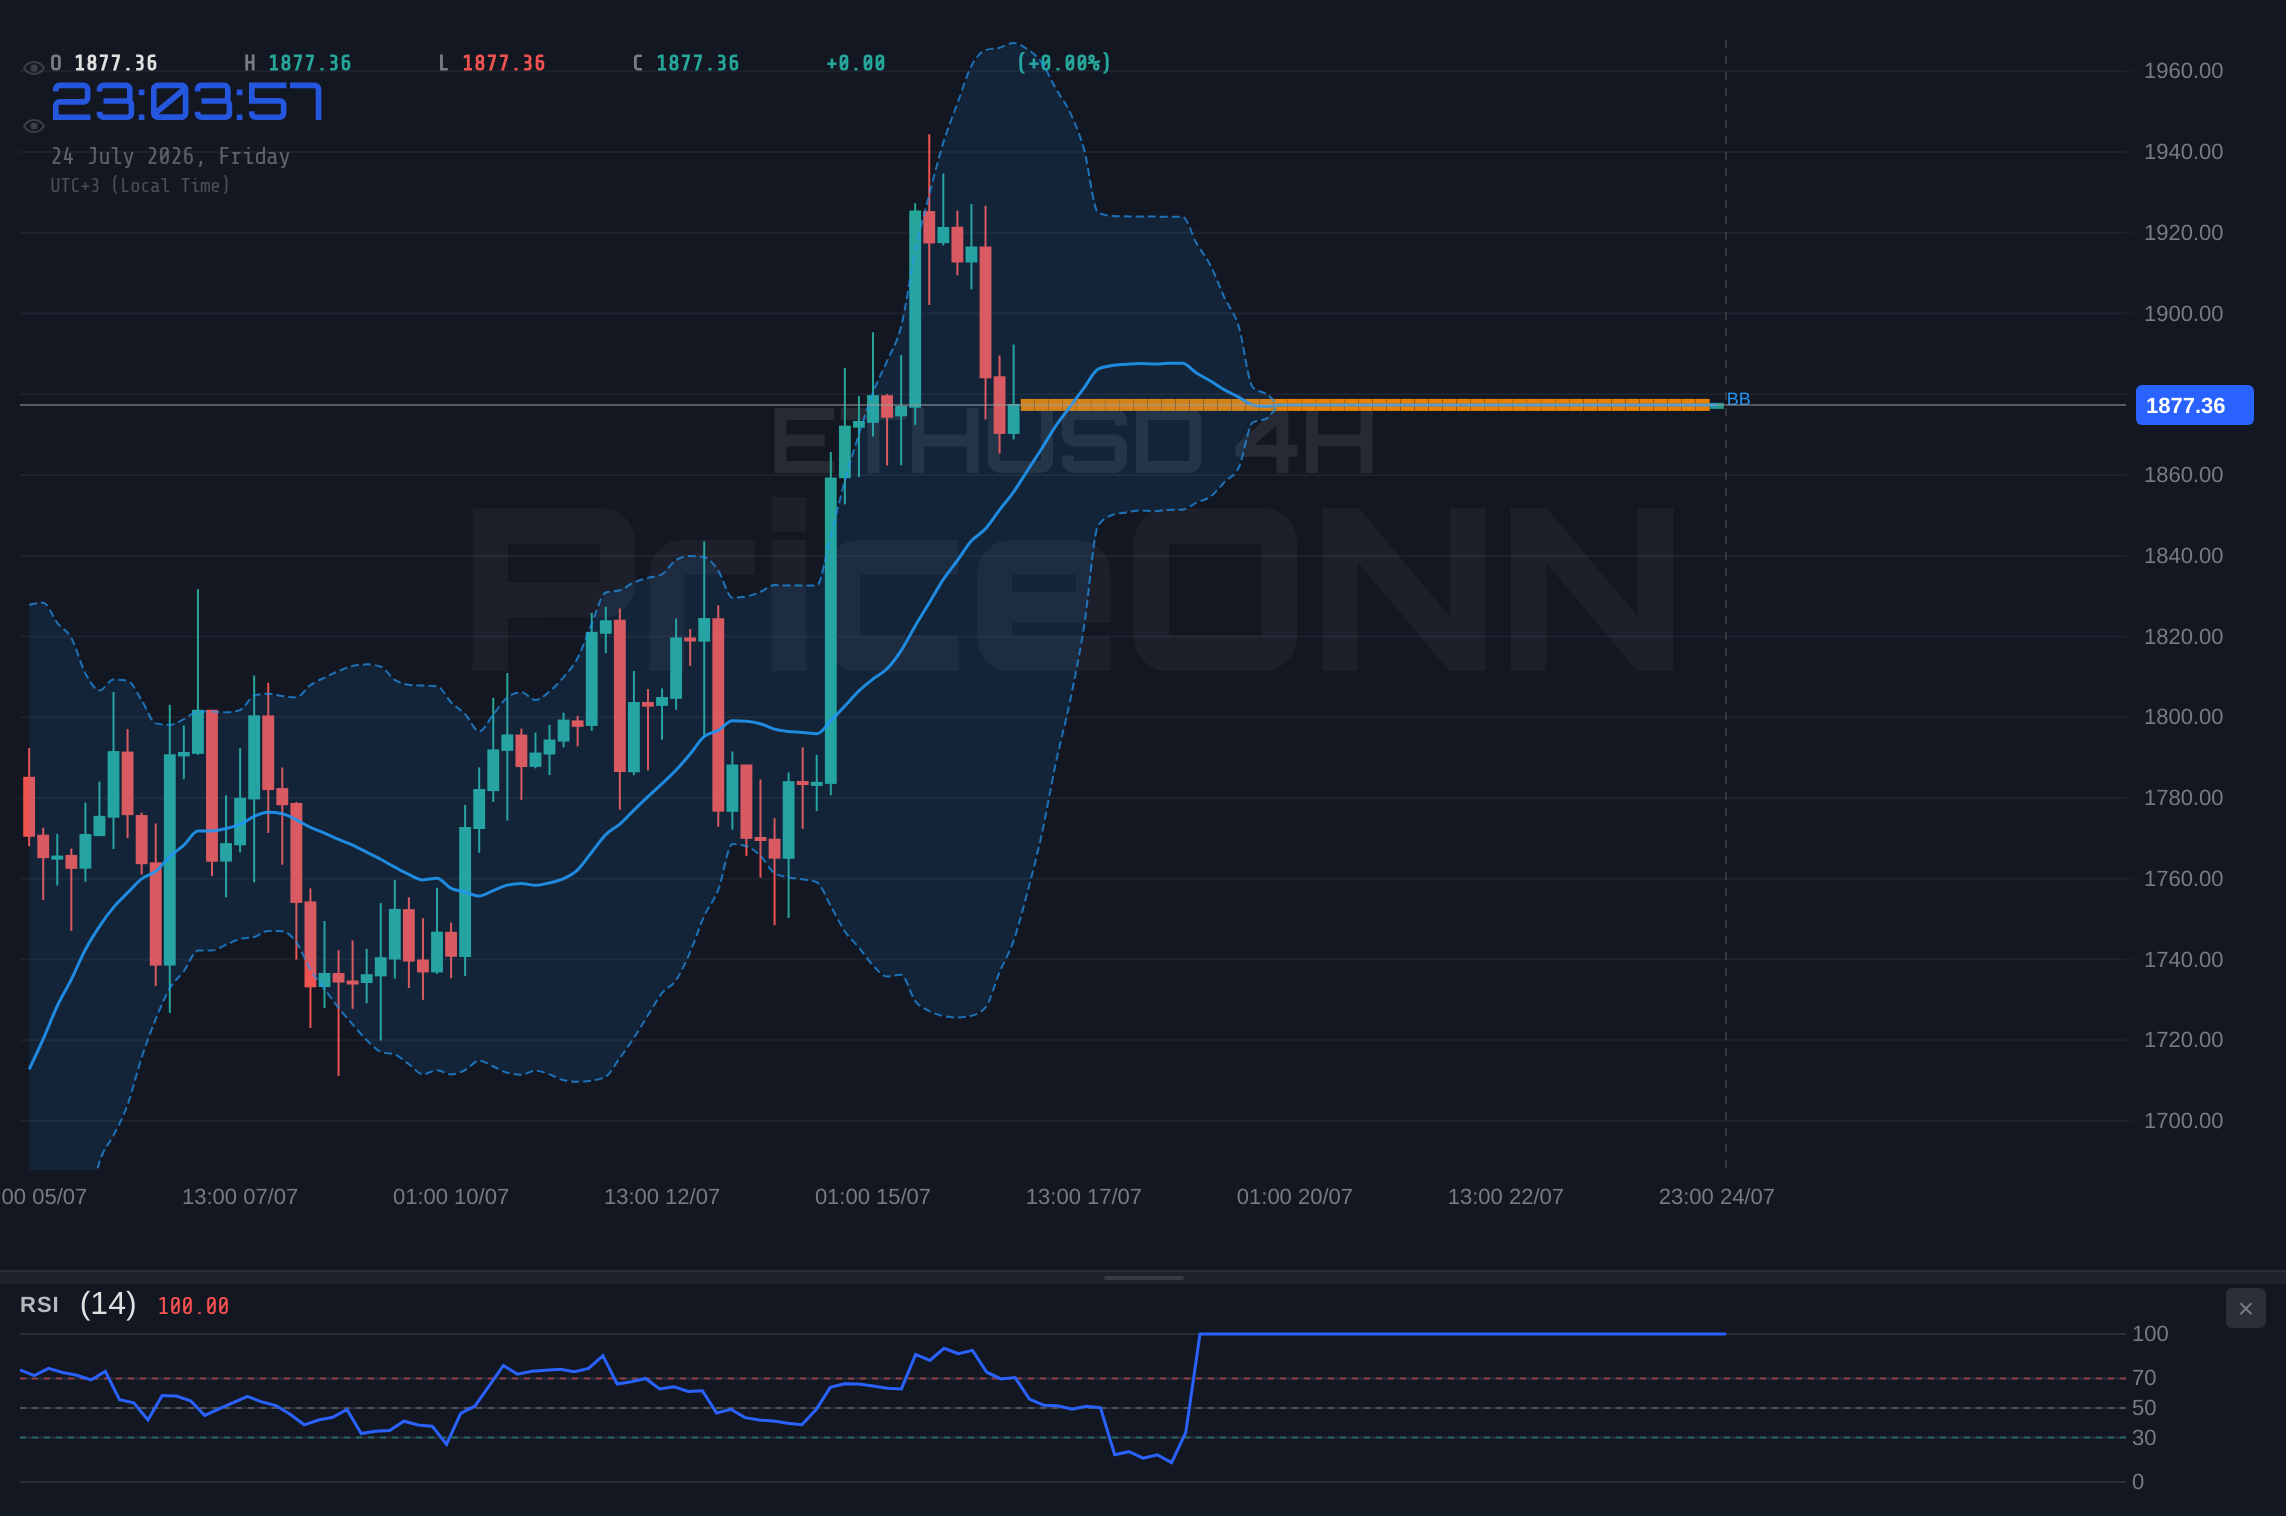
The 4-hour timeframe paints a more bullish picture for ETHUSD, despite the prevailing downtrend in the broader crypto market. The trend is identified as 'Yükseliş' (Bullish) with a high strength of 94%, and the overall signal is 'AL' (Buy). RSI is at 56.88, in neutral territory but trending upwards, suggesting increasing buying pressure. The MACD, while showing negative momentum, is nearing a potential crossover, and the Stochastic indicator has dipped into oversold territory with %K at 18.24 and %D at 57.76, suggesting a potential reversal or at least a pause in the downtrend. Bollinger Bands are showing the price above the middle band, indicating an upward trend. However, the ADX at 37.06 signifies a strong trend, which could mean that the current downtrend might continue with vigour if the bullish signals fail to materialize. The immediate resistance levels on this timeframe are $1,884.91, $1,899.39, and $1,909.19, while support is found at $1,860.63, $1,850.83, and $1,836.35.
Zooming out to the daily chart, the technical indicators for ETHUSD reveal a strengthening bullish bias, despite the immediate price action. The trend is classified as 'Yükseliş' (Bullish) with a strength of 86%, and the overall signal is 'AL' (Buy). RSI stands at 59.95, firmly in the neutral zone but trending upwards, suggesting room for further appreciation. The MACD is positive and above its signal line, confirming bullish momentum. Stochastic is in overbought territory with %K at 84.55 and %D at 79.73, indicating strong buying pressure, though it also suggests the possibility of a short-term pullback. The price is trading above the middle Bollinger Band, reinforcing the bullish outlook. The ADX at 22.66 indicates a moderately strong uptrend. This daily perspective offers a more optimistic outlook compared to the shorter timeframes, suggesting that the current dip might be a temporary consolidation within a larger upward move.
Navigating the Fed's Influence and Inflationary Headwinds
The persistent strength of the US Dollar, currently at 100.70 on the DXY, is a significant factor weighing on ETHUSD. As the dollar strengthens, it typically becomes more expensive for holders of other currencies to acquire dollar-denominated assets, including cryptocurrencies like Ethereum. This inverse correlation is often amplified when the Fed signals a hawkish stance. Recent news highlights that the Fed is facing an 'inflation test,' with markets repricing interest rate paths. The rally in Brent crude, which has approached $100, is a major contributor to these inflationary concerns. Brent Crude is currently trading at $83.79, and its upward trajectory fuels expectations that central banks may need to keep monetary policy tighter for longer to combat rising prices. This dynamic creates a challenging environment for risk assets, as higher interest rates increase the cost of capital and can dampen investor appetite for speculative investments.
The interplay between oil prices, inflation, and Fed policy is critical. When oil prices surge, they not only increase transportation and energy costs directly but also have a ripple effect across various sectors of the economy, potentially leading to broader price increases. If the Fed perceives this as a sustained inflationary pressure, they may be compelled to maintain higher interest rates, which in turn can strengthen the dollar and weaken assets like ETHUSD. The market is actively digesting these developments, with Fed Fund Futures showing increased probabilities of future rate hikes. This uncertainty surrounding the Fed's next move creates volatility and makes it difficult for traders to establish firm directional bets.
The recent news flow underscores this tension. Reports indicate that the Dollar and Yields are surging as Brent Near $100 Sparks Broader Market Repricing. This suggests that the market is reacting to the potential inflationary impact of higher oil prices and adjusting its expectations for Fed policy accordingly. For ETHUSD, this translates into increased downside risk as the cost of capital rises and risk appetite diminishes. The correlation between ETHUSD and the DXY is particularly noteworthy; a rising DXY typically implies a weakening ETHUSD, and vice-versa. Traders are closely watching this relationship to gauge the immediate pressure on the cryptocurrency market.
Furthermore, geopolitical tensions, such as those in the Middle East, and trade disputes, like potential tariffs, add another layer of complexity. These factors can disrupt supply chains, influence commodity prices (especially oil), and generally increase market uncertainty. Such an environment often leads to a 'risk-off' sentiment, where investors flock to safer assets like the US dollar and US Treasuries, while pulling capital from riskier investments like cryptocurrencies. The current market conditions, characterized by rising oil prices and geopolitical uncertainty, are therefore inherently bearish for ETHUSD.
The confluence of rising oil prices, persistent inflation concerns, and a hawkish Fed stance creates a significant headwind for ETHUSD. Traders should exercise extreme caution, as a potential continuation of the downtrend is indicated across multiple timeframes, despite some bullish signals on the daily chart.
Looking at the broader market context, the S&P 500 (SP500) is trading at 6572.87, showing a recent uplift but with a daily trend classified as 'Düşüş' (Bearish) and an ADX of 47.51 indicating a strong downtrend. Similarly, the Nasdaq 100 (Nasdaq100) is at 29164.86, also showing a bearish trend and negative momentum. This risk-off sentiment in traditional equity markets often spills over into the cryptocurrency space. When major stock indices are under pressure, investors tend to reduce their exposure to highly volatile assets like ETHUSD. The correlation between crypto and tech stocks has been well-documented, and a downturn in equities suggests that ETHUSD may face further selling pressure.
The Dow Jones Industrial Average (DowJones30) at 52748.53 shows a more resilient picture, with a bullish trend on the daily chart. However, the overall market sentiment is being dictated by the tech-heavy Nasdaq and the broader S&P 500, which are exhibiting weakness. This divergence within the stock market itself adds another layer of complexity, but the prevailing bearish trend in the Nasdaq and S&P 500 cannot be ignored when assessing the outlook for ETHUSD.
In this environment, the key support level for ETHUSD at $1,874.22 becomes paramount. A sustained break below this level, especially on the 4-hour or daily chart, would likely trigger further liquidations and accelerate the downtrend, potentially targeting the next support at $1,860.63. Conversely, a failure of the dollar to maintain its strength, perhaps due to a less hawkish-than-expected Fed statement or a de-escalation of geopolitical tensions, could provide a reprieve for ETHUSD. In such a scenario, the immediate resistance levels on the 1-hour chart at $1,891.84 and subsequently on the 4-hour chart at $1,884.91 would be the first hurdles to overcome.
Pay close attention to the $1,874.22 support level. A decisive break below this on significant volume could signal a deeper correction. Conversely, holding this level and seeing a bounce towards $1,891.84 could be the first sign of stabilization.
The technical indicators on the daily chart offer a glimmer of hope, showing an RSI of 59.95 and positive MACD momentum. This suggests that while short-term pressures are bearish, the longer-term trend may still be intact. However, this bullish divergence on the daily chart needs to be confirmed by price action and a sustained weakening of the dollar or a less hawkish Fed stance. Without these catalysts, the short-to-medium term outlook remains tilted towards the downside, influenced by the macroeconomic headwinds and the bearish technical signals on the 1-hour and 4-hour charts.
The Stochastic indicator on the daily chart showing %K at 84.55 and %D at 79.73 is in overbought territory, signaling a potential for a pullback. This aligns with the idea that even within an uptrend, pullbacks are healthy and can occur, especially when faced with strong macroeconomic resistance. Therefore, while the daily indicators are bullish, they do not negate the immediate risks posed by the current market environment. Traders should be looking for confirmation of a trend reversal or continuation based on how ETHUSD interacts with its key support and resistance levels in the coming trading sessions.
The ADX on the daily chart at 22.66 indicates a moderately strong uptrend, but the ADX on the 1-hour (29.09) and 4-hour (37.06) charts points to strong downtrends. This conflict in trend strength across different timeframes highlights the current indecision and volatility in the ETHUSD market. The higher ADX values on shorter timeframes suggest that downward momentum is currently more potent in the short term, while the daily chart indicates that the longer-term bullish thesis is still plausible but under pressure.
The scenario cards below outline potential paths forward, considering the conflicting signals and the dominant macroeconomic narrative. The probabilities assigned reflect the current technical and fundamental landscape, with a strong emphasis on the bearish pressures from inflation and Fed policy. Traders are advised to manage risk diligently, as the market remains sensitive to news flow regarding inflation data and central bank communications.
Bearish Scenario: Downside Acceleration
65% ProbabilityNeutral Scenario: Consolidation and Range-Bound Trading
25% ProbabilityBullish Scenario: Rebound from Support
10% ProbabilityFrequently Asked Questions: ETHUSD Analysis
What happens if ETHUSD breaks below the $1,874.22 support level?
A break below $1,874.22 on the 4-hour chart would likely trigger the bearish scenario, potentially accelerating the downtrend towards $1,860.63. This would be invalidated if price quickly recovers above $1,891.84.
Should I consider buying ETHUSD at current levels near $1,877.38 given the daily chart's bullish signals?
While daily indicators like RSI at 59.95 show potential for an uptrend, the immediate 1H and 4H charts exhibit bearish momentum and strong downtrend ADX readings. A cautious approach is advised; consider waiting for confirmation of a hold above $1,874.22 or a break above $1,891.84, with a low probability of 10% for a strong bullish reversal from current levels.
Is the RSI at 39.48 on the 1-hour chart a sell signal for ETHUSD?
An RSI of 39.48 on the 1-hour chart sits in neutral territory but is trending downwards, aligning with the bearish sentiment on this timeframe. While not strictly oversold, it suggests sellers have the upper hand in the short term, reinforcing the potential for further downside towards $1,860.63.
How will Fed rate hike expectations impact ETHUSD this week?
Persistent inflation concerns are driving expectations of a hawkish Fed, which strengthens the dollar (DXY at 100.70) and pressures ETHUSD. If upcoming economic data reinforces these expectations, ETHUSD could face further downside risk as capital flows towards safer assets.
Track markets in real-time
AI-powered analysis, technical indicators and real-time price data.
Join Our Telegram Channel
Breaking market news, AI analysis and trading signals instantly.
Join Channel