

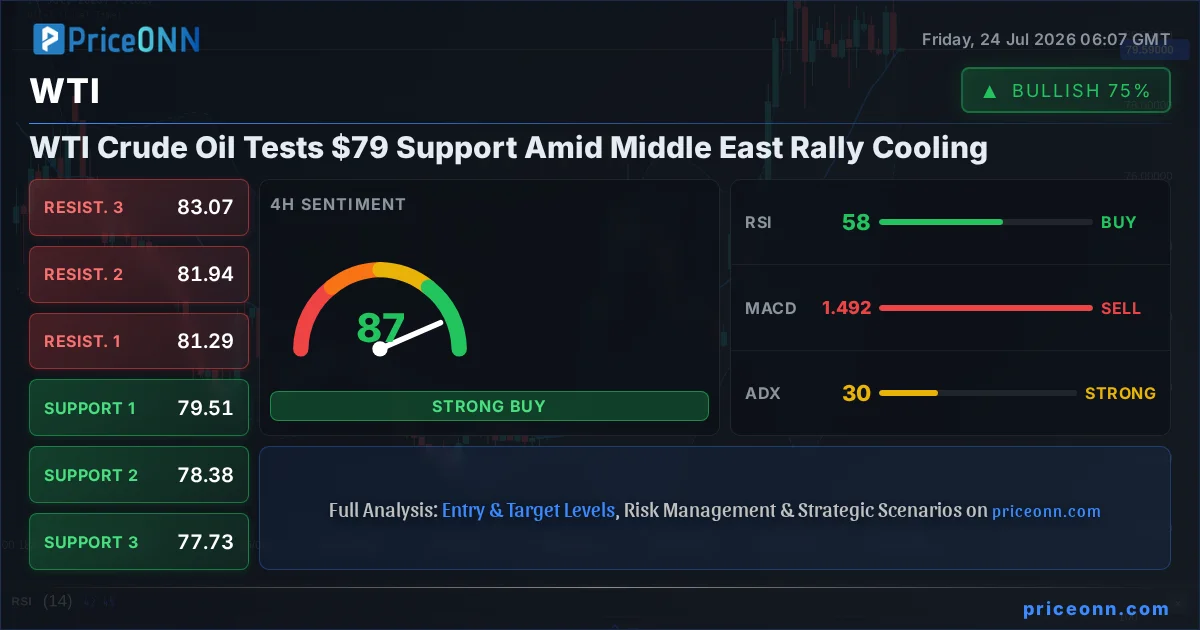
The relentless climb in oil prices, particularly WTI Crude, seems to be hitting a temporary pause near the critical $79.59 mark. While geopolitical escalations in the Middle East have been a primary driver for the recent surge, the market is now assessing whether this rally has the legs to continue or if a consolidation phase is due. My analysis of the technical indicators and key price levels suggests a period of heightened caution for traders as we navigate this crucial juncture. The energy markets are at a fascinating crossroads, and understanding the interplay between supply-side risks and demand-side signals is paramount.
- WTI Crude Oil is currently trading at $79.59, testing support near the $79.00 level.
- RSI at 46.91 on the 1H chart suggests downward momentum, while the 1D ADX at 29.46 indicates a strong uptrend is still in play.
- Key support for WTI is identified at $79.23, with resistance looming at $79.83 on the hourly chart.
- The cooling Middle East tensions, coupled with a strong dollar (DXY at 100.7), may be contributing to the pause in oil's upward trajectory.
Navigating the $79.59 Threshold: WTI's Current Technical Landscape
WTI Crude Oil is currently finding itself at a pivotal point, trading at precisely $79.59. This level represents more than just a price point; it's a psychological and technical battleground where the forces of bullish momentum meet the potential for profit-taking and a reassessment of risk. The daily change shows a slight dip of -0.83%, translating to a $0.83 move from its previous close, within a daily range that has seen fluctuations between $79.04 and $81.00. This intraday volatility is a clear signal that the market is not yet settled on a definitive direction, and the $79.59 level is being closely watched by traders and analysts alike. The question on everyone's mind is whether this support will hold, paving the way for a potential retest of higher ground, or if the bears will manage to push prices lower, triggering a broader correction.
On the 1-hour chart, the trend is currently neutral with a power of 50%. This lack of strong directional conviction is reflected in the technical indicators. The RSI(14) sits at 46.91, indicating a slight downward momentum but still comfortably within neutral territory. This suggests that while sellers are present, they haven't yet overwhelmed the buyers. The MACD is showing negative momentum, with the MACD line below its signal line, reinforcing the idea of a short-term bearish bias. However, the Bollinger Bands are positioned below the middle band, indicating a bearish inclination on this timeframe, but it's the stochastic oscillator that offers a glimmer of hope for the bulls. With K at 28.74 and D at 52.74, the %K line is below the %D line, signaling a bearish move, yet both are in oversold territory. The ADX at 10.18 signifies a weak trend, which often precedes a significant move, but it doesn't give us a clear indication of the direction yet. The overall signal leans towards 'SELL' (1 Buy, 7 Sell, 0 Neutral), highlighting the immediate bearish pressure.
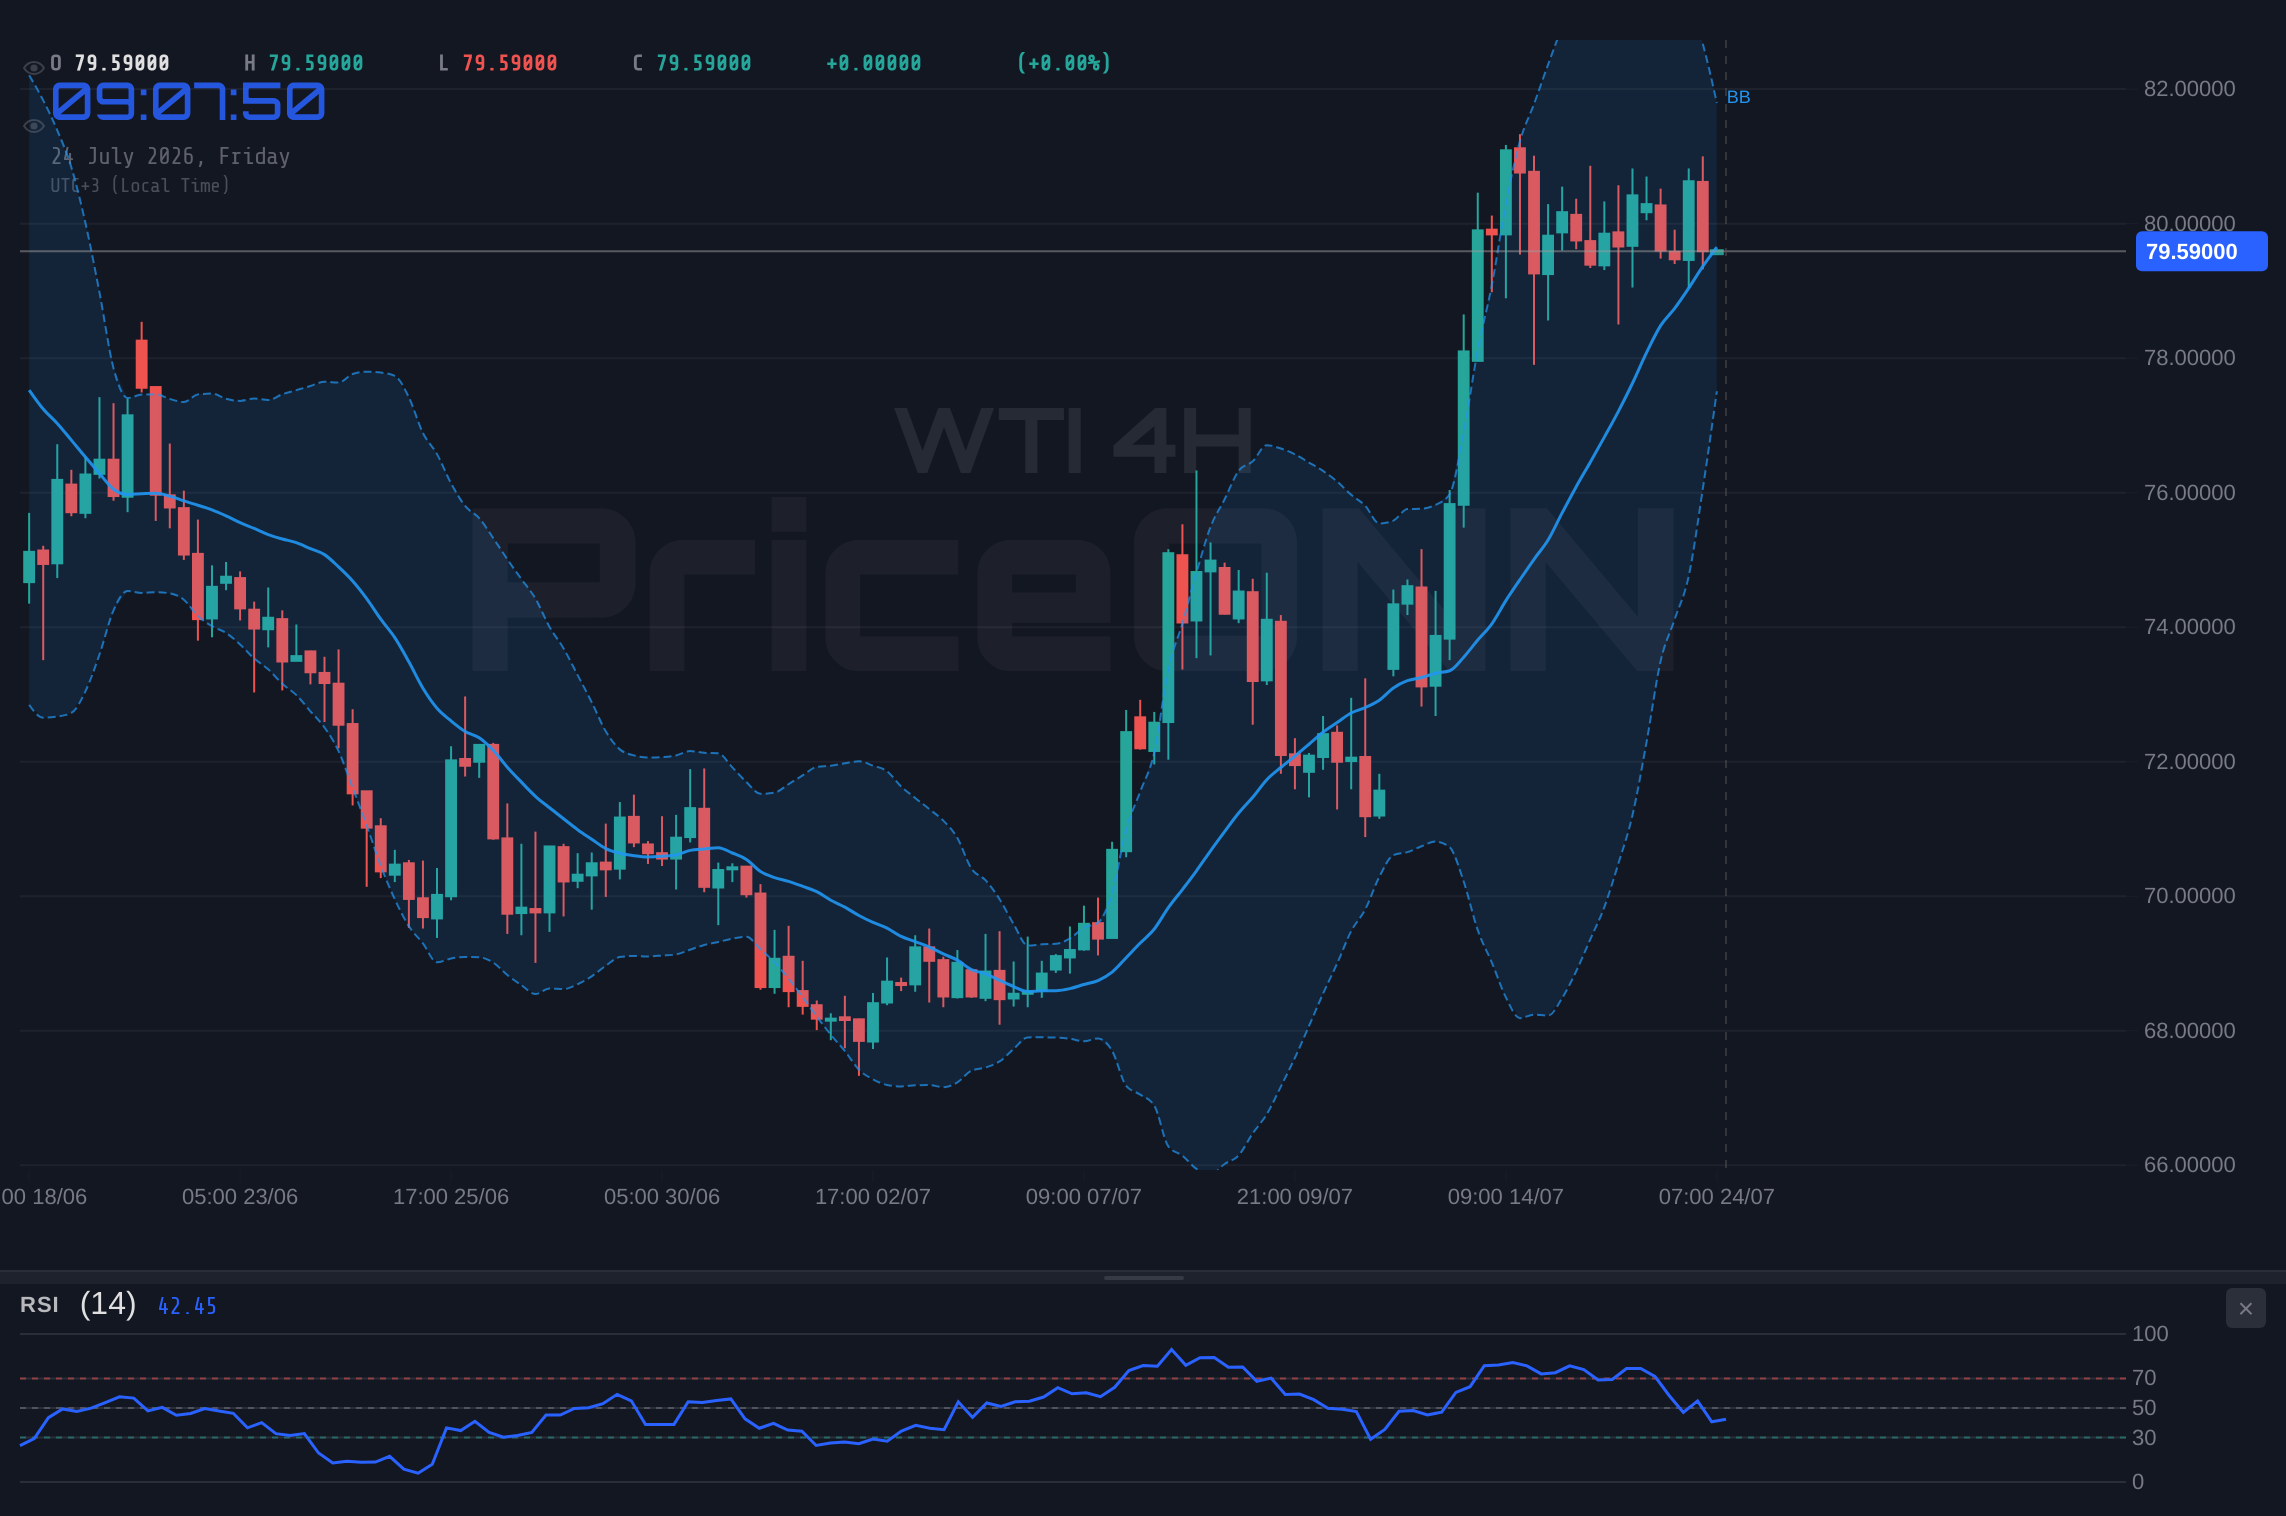
Shifting to the 4-hour timeframe, the picture becomes more complex. The trend is still considered neutral (50% power), but the indicators begin to show a more supportive environment for a potential bounce. The RSI(14) is at 58.47, moving upwards and suggesting strengthening bullish sentiment. This is a notable shift from the 1-hour chart. The MACD, however, still displays negative momentum, but the Bollinger Bands are now above the middle band, hinting at an upward price movement. The stochastic oscillator presents a bullish signal, with K at 58.32 and D at 60.98, indicating a potential crossover and upward movement. The ADX at 30.49 suggests a strong uptrend is forming, which contradicts the neutral trend power. This conflict between indicators is common during consolidation phases. The overall signal here is 'BUY' (6 Buy, 2 Sell, 0 Neutral), indicating that longer-term traders might be seeing value at these lower levels.
On the daily chart, WTI Crude Oil shows a neutral trend with 50% power. The RSI(14) is at 53.65, indicating a slight upward bias and staying in the neutral zone. This suggests that the market is not yet overextended in either direction. The MACD is positive, with the MACD line above its signal line, confirming bullish momentum on a daily basis. The Bollinger Bands are above the middle band, reinforcing the bullish inclination. The stochastic oscillator is showing a strong bullish signal, with K at 89.73 and D at 76.8, firmly in overbought territory. This is a critical point: while it confirms strong buying pressure, it also signals that the market could be due for a correction or consolidation soon. The ADX at 29.46 indicates a strong uptrend, suggesting that the underlying bullish sentiment remains robust despite the intraday fluctuations. The overall signal is 'BUY' (7 Buy, 1 Sell, 0 Neutral), pointing towards a generally positive outlook for WTI in the longer term.
The Geopolitical Undercurrents: Middle East Tensions and Their Impact
The recent surge in oil prices, pushing WTI towards the $80 mark and Brent even higher to $83.79, has been significantly fueled by escalating geopolitical tensions in the Middle East. The conflict has naturally raised concerns about supply disruptions, creating a risk premium that has been baked into oil prices. News reports from July 22nd indicated that oil was climbing on Middle East escalation, but markets were resisting a full risk-off shift. This implies that while the supply-side concerns are real, the broader market sentiment hasn't fully capitulated to a widespread risk aversion, which could have dragged down other assets like equities. The fact that Brent reached near $100 at one point, as reported by some outlets, underscores the severity of the perceived supply risk, forcing a broader market repricing. However, recent developments suggest a slight cooling of these immediate fears, allowing for a technical reassessment.
The European Central Bank's (ECB) stance on interest rates, as reported on July 23rd, also plays a role. While the ECB held rates steady, keeping the deposit rate at 2.25%, they are closely watching energy shocks and their inflation spillovers. This hawkish hold, as suggested by EUR/CHF movements, means that the central bank is prioritizing inflation control, even amidst rising energy costs. This could indirectly influence oil demand if higher rates eventually dampen economic activity. Furthermore, the strengthening dollar, evidenced by the DXY index reaching 100.7, acts as a headwind for oil prices. A stronger dollar typically makes dollar-denominated commodities like oil more expensive for holders of other currencies, potentially dampening demand. The interplay between geopolitical risk premiums, central bank policies, and currency strength creates a complex environment for WTI traders.
The news that WTI Crude Oil is powering ahead, putting $90 back on the radar, as reported on July 23rd, highlights the underlying bullish narrative that has been building. A bullish trend line forming with support at $81 suggests that many traders were anticipating further upside. However, the current price action around $79.59 indicates that this upward momentum has stalled, at least temporarily. This stall could be attributed to several factors: profit-taking after a significant run-up, a slight de-escalation in geopolitical rhetoric, or a stronger-than-expected dollar. The market is constantly weighing these factors, and the current pause near $79.59 could be a precursor to either a renewed push higher or a more significant pullback if the geopolitical risk premium continues to fade.
The Three Paths Forward: Scenarios for WTI Crude Oil
Given the current technical readings and the evolving geopolitical landscape, we can outline three primary scenarios for WTI Crude Oil over the coming days and weeks. Each scenario is contingent on specific price action, indicator behavior, and the unfolding of geopolitical events. The market is currently at a critical juncture, and the probabilities assigned reflect the immediate technical signals and the prevailing sentiment.
Bearish Reversal: Bears Take Control Below $79.23
65% ProbabilityConsolidation Phase: Caught Between Levels
25% ProbabilityBullish Continuation: Bulls Reclaim the Momentum
10% ProbabilityThe current technical setup, with multiple indicators showing conflicting signals and the ADX indicating a weak trend on the 1-hour chart, leans towards a bearish bias in the short term. The higher probability scenario (65%) is a bearish reversal, as the immediate pressure points towards a test of lower support levels. The neutral scenario (25%) acknowledges the possibility of a temporary pause before a clearer direction emerges. The bullish continuation scenario (10%) currently appears less likely based on the immediate technical readings, but it remains a possibility should geopolitical events take a sharp turn or if strong buying emerges unexpectedly.
What I'm Watching: Key Triggers for WTI This Week
To navigate this potentially choppy price action, traders should keep a close eye on a few key triggers. Firstly, the immediate price action around the $79.23 support level is critical. A failure to hold this level on the 1-hour chart could accelerate selling pressure, as indicated in the bearish scenario. Conversely, a decisive break and hold above the $79.83 resistance on the 1-hour chart would be the first sign of a potential bullish reversal, aligning with the less probable bullish scenario. This requires confirmation from other indicators, particularly the RSI moving decisively above 50 and MACD showing renewed strength.
Secondly, the broader market sentiment, as reflected by the DXY and SP500, will be crucial. If the dollar index (currently at 100.7) continues its upward trend, it will likely exert downward pressure on WTI. Similarly, any significant decline in the SP500 (currently at 6572.87 with a daily rise, but showing mixed signals on lower timeframes) could signal a broader risk-off move, potentially benefiting safe-haven assets and pressuring commodities like oil. The geopolitical narrative remains a wildcard; any significant escalation or de-escalation in the Middle East will immediately impact oil prices and could override purely technical considerations.
Finally, keep an eye on the ADX across different timeframes. The current readings suggest a lack of strong trend conviction on the 1-hour chart (ADX: 10.18), but a strong uptrend on the daily (ADX: 29.46). A break in the ADX trend strength on the daily chart could signal a significant shift in market dynamics. For instance, if the ADX starts to fall below 20 while prices are consolidating, it would reinforce the neutral scenario. Conversely, a strong surge in the ADX above 30 on the 1-hour chart would indicate that a new trend is forming, and traders should be prepared to act accordingly.
| Indicator | Value | Signal | Interpretation |
|---|---|---|---|
| RSI (14) | 46.91 | Bearish | Slight downward momentum, indicating sellers are present. |
| MACD | Negative | Bearish | Momentum below signal line suggests short-term weakness. |
| Stochastic | K=28.74, D=52.74 | Bearish | Both lines in oversold territory, but K |
| ADX | 10.18 | Neutral | Weak trend strength on 1H chart suggests consolidation. |
| Bollinger Bands | Below Middle | Bearish | Price action below the middle band indicates bearish pressure. |
Frequently Asked Questions: WTI Analysis
What happens if WTI breaks below $79.23 support?
A break below $79.23 on the 1-hour chart could trigger a bearish reversal, potentially sending WTI down to test the $78.97 and $78.63 support levels. This would be invalidated if price quickly recovers above $79.83.
Should I buy WTI at current levels of $79.59 given the mixed signals?
Buying at $79.59 is a speculative move given the current conflicting indicators. A more prudent approach would be to wait for confirmation: either a hold of $79.23 with a bullish bounce or a break above $79.83. Risk management is key.
Is the RSI at 46.91 a sell signal for WTI right now?
An RSI of 46.91 indicates slight downward momentum but is not yet in oversold territory. While it suggests bearish pressure, it's not a standalone sell signal. Confirmation from price action and other indicators like MACD is needed.
How will the ECB's stance on inflation affect WTI this week?
The ECB's hawkish hold, prioritizing inflation control despite rising energy costs, could indirectly dampen oil demand if higher rates slow economic growth. This adds a layer of caution to the bullish outlook for WTI, especially if geopolitical risks continue to subside.
The path forward for WTI Crude Oil hinges on the resolution of conflicting technical signals and the ever-present geopolitical backdrop. While the immediate pressure appears to be to the downside, the underlying strength indicated on the daily chart cannot be ignored. Traders must remain vigilant, focusing on the key levels discussed and waiting for clear confirmation before committing to a direction. Patience and disciplined risk management will be the keys to navigating this period of uncertainty. The market always provides another opportunity, and waiting for the right setup is crucial for long-term success.
Track markets in real-time
AI-powered analysis, technical indicators and real-time price data.
Join Our Telegram Channel
Breaking market news, AI analysis and trading signals instantly.
Join Channel