

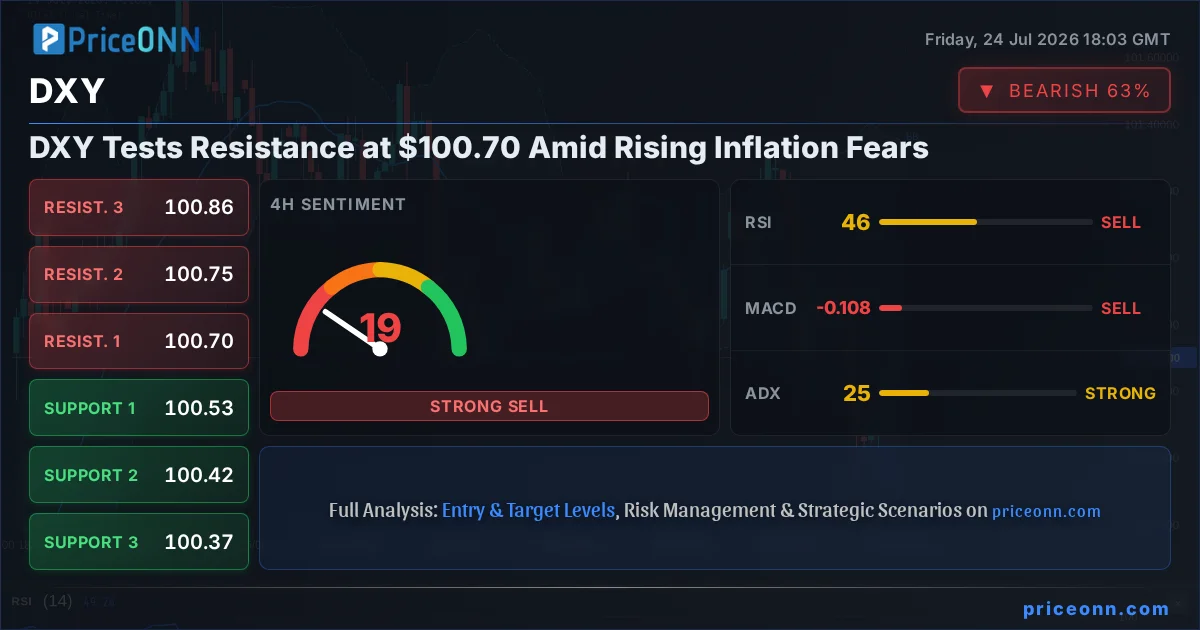
The global financial stage is currently dominated by a potent mix of resurgent inflation fears and geopolitical tensions, with the US Dollar Index (DXY) finding itself at a critical juncture near the $100.70 mark. This strategic position, just shy of significant resistance, places the DXY under intense scrutiny as traders grapple with the implications of rising oil prices and the Federal Reserve's potential policy responses. The narrative that has unfolded over the past 48 hours, particularly the surge in Brent crude oil prices towards $83.79, is not merely an energy market story; it's a potent catalyst reshaping interest rate expectations and influencing currency valuations worldwide. As the DXY approaches a key resistance level, understanding the interplay between these macro drivers and the technical underpinnings becomes paramount for navigating the complex market landscape.
- RSI at 56.6 on the 1H chart signals upward momentum, but caution is advised as DXY approaches key resistance at $100.73.
- Critical resistance sits at $100.70, a level DXY is currently testing, with further upside targets at $100.73 and $100.79.
- The MACD histogram shows positive momentum on the 1H chart, suggesting strength, but the ADX at 27.71 indicates a strong uptrend that needs careful observation.
- The correlation with rising oil prices and potential Fed rate hike expectations is a key driver for DXY's current position.
The recent surge in Brent crude oil prices, now hovering around $83.79, has sent ripples through global markets, primarily by reigniting inflation concerns. This commodity price escalation, driven by a confluence of geopolitical factors and supply-demand dynamics, presents a significant challenge for central banks worldwide, particularly the US Federal Reserve. Historically, higher oil prices translate into higher energy costs for consumers and businesses, feeding into broader inflation metrics. This inflationary pressure forces policymakers to consider tighter monetary stances, which typically includes raising interest rates or maintaining a hawkish tone to curb price pressures. For the DXY, this dynamic is a double-edged sword: while higher rates can strengthen the dollar by increasing its attractiveness to yield-seeking investors, the potential economic slowdown induced by such policies can also dampen demand for riskier assets, indirectly supporting the dollar as a safe-haven. The current market sentiment suggests that traders are repricing their expectations for future Fed actions, with a growing probability of more aggressive rate hikes being factored into the yields. This anticipation is a primary driver behind the DXY's recent ascent towards the $100.70 level.
The Dollar's Ascent: A Tale of Oil, Rates, and Risk Appetite
The narrative driving the DXY's current advance is deeply intertwined with the sharp rise in oil prices and the subsequent recalibration of interest rate expectations. As Brent crude oil tests levels around $83.79, the immediate concern is a potential resurgence of inflation. This is particularly relevant for the Federal Reserve, which has been battling to bring inflation back to its target. Data from the last 48 hours highlights this correlation: news outlets reported that 'oil rally near $100 sparks broader market repricing,' and 'Week Ahead – Fed, BoE and BoJ Face Inflation Test as Markets Reprice Interest Rate Paths.' This suggests a market consensus that higher energy costs will indeed translate into sticky inflation. Consequently, traders are increasingly pricing in the possibility of more aggressive monetary tightening from the Fed. The CME FedWatch tool, if available, would likely show a shift in probabilities towards higher rate hikes in the coming months. This anticipation of a tighter monetary policy makes the US dollar more attractive, as higher interest rates generally lead to capital inflows seeking better returns. The DXY's movement towards $100.70 is a direct reflection of these evolving expectations. The dollar's strength, however, is not solely a function of Fed policy; it's also influenced by global risk sentiment. When oil prices surge and geopolitical tensions (such as those in the Middle East) escalate, a 'risk-off' environment often emerges. In such scenarios, investors tend to flee to perceived safe-haven assets, and the US dollar, backed by the world's largest economy and deepest financial markets, is a primary beneficiary. This dual support from interest rate differentials and safe-haven demand is reinforcing the DXY's upward momentum.
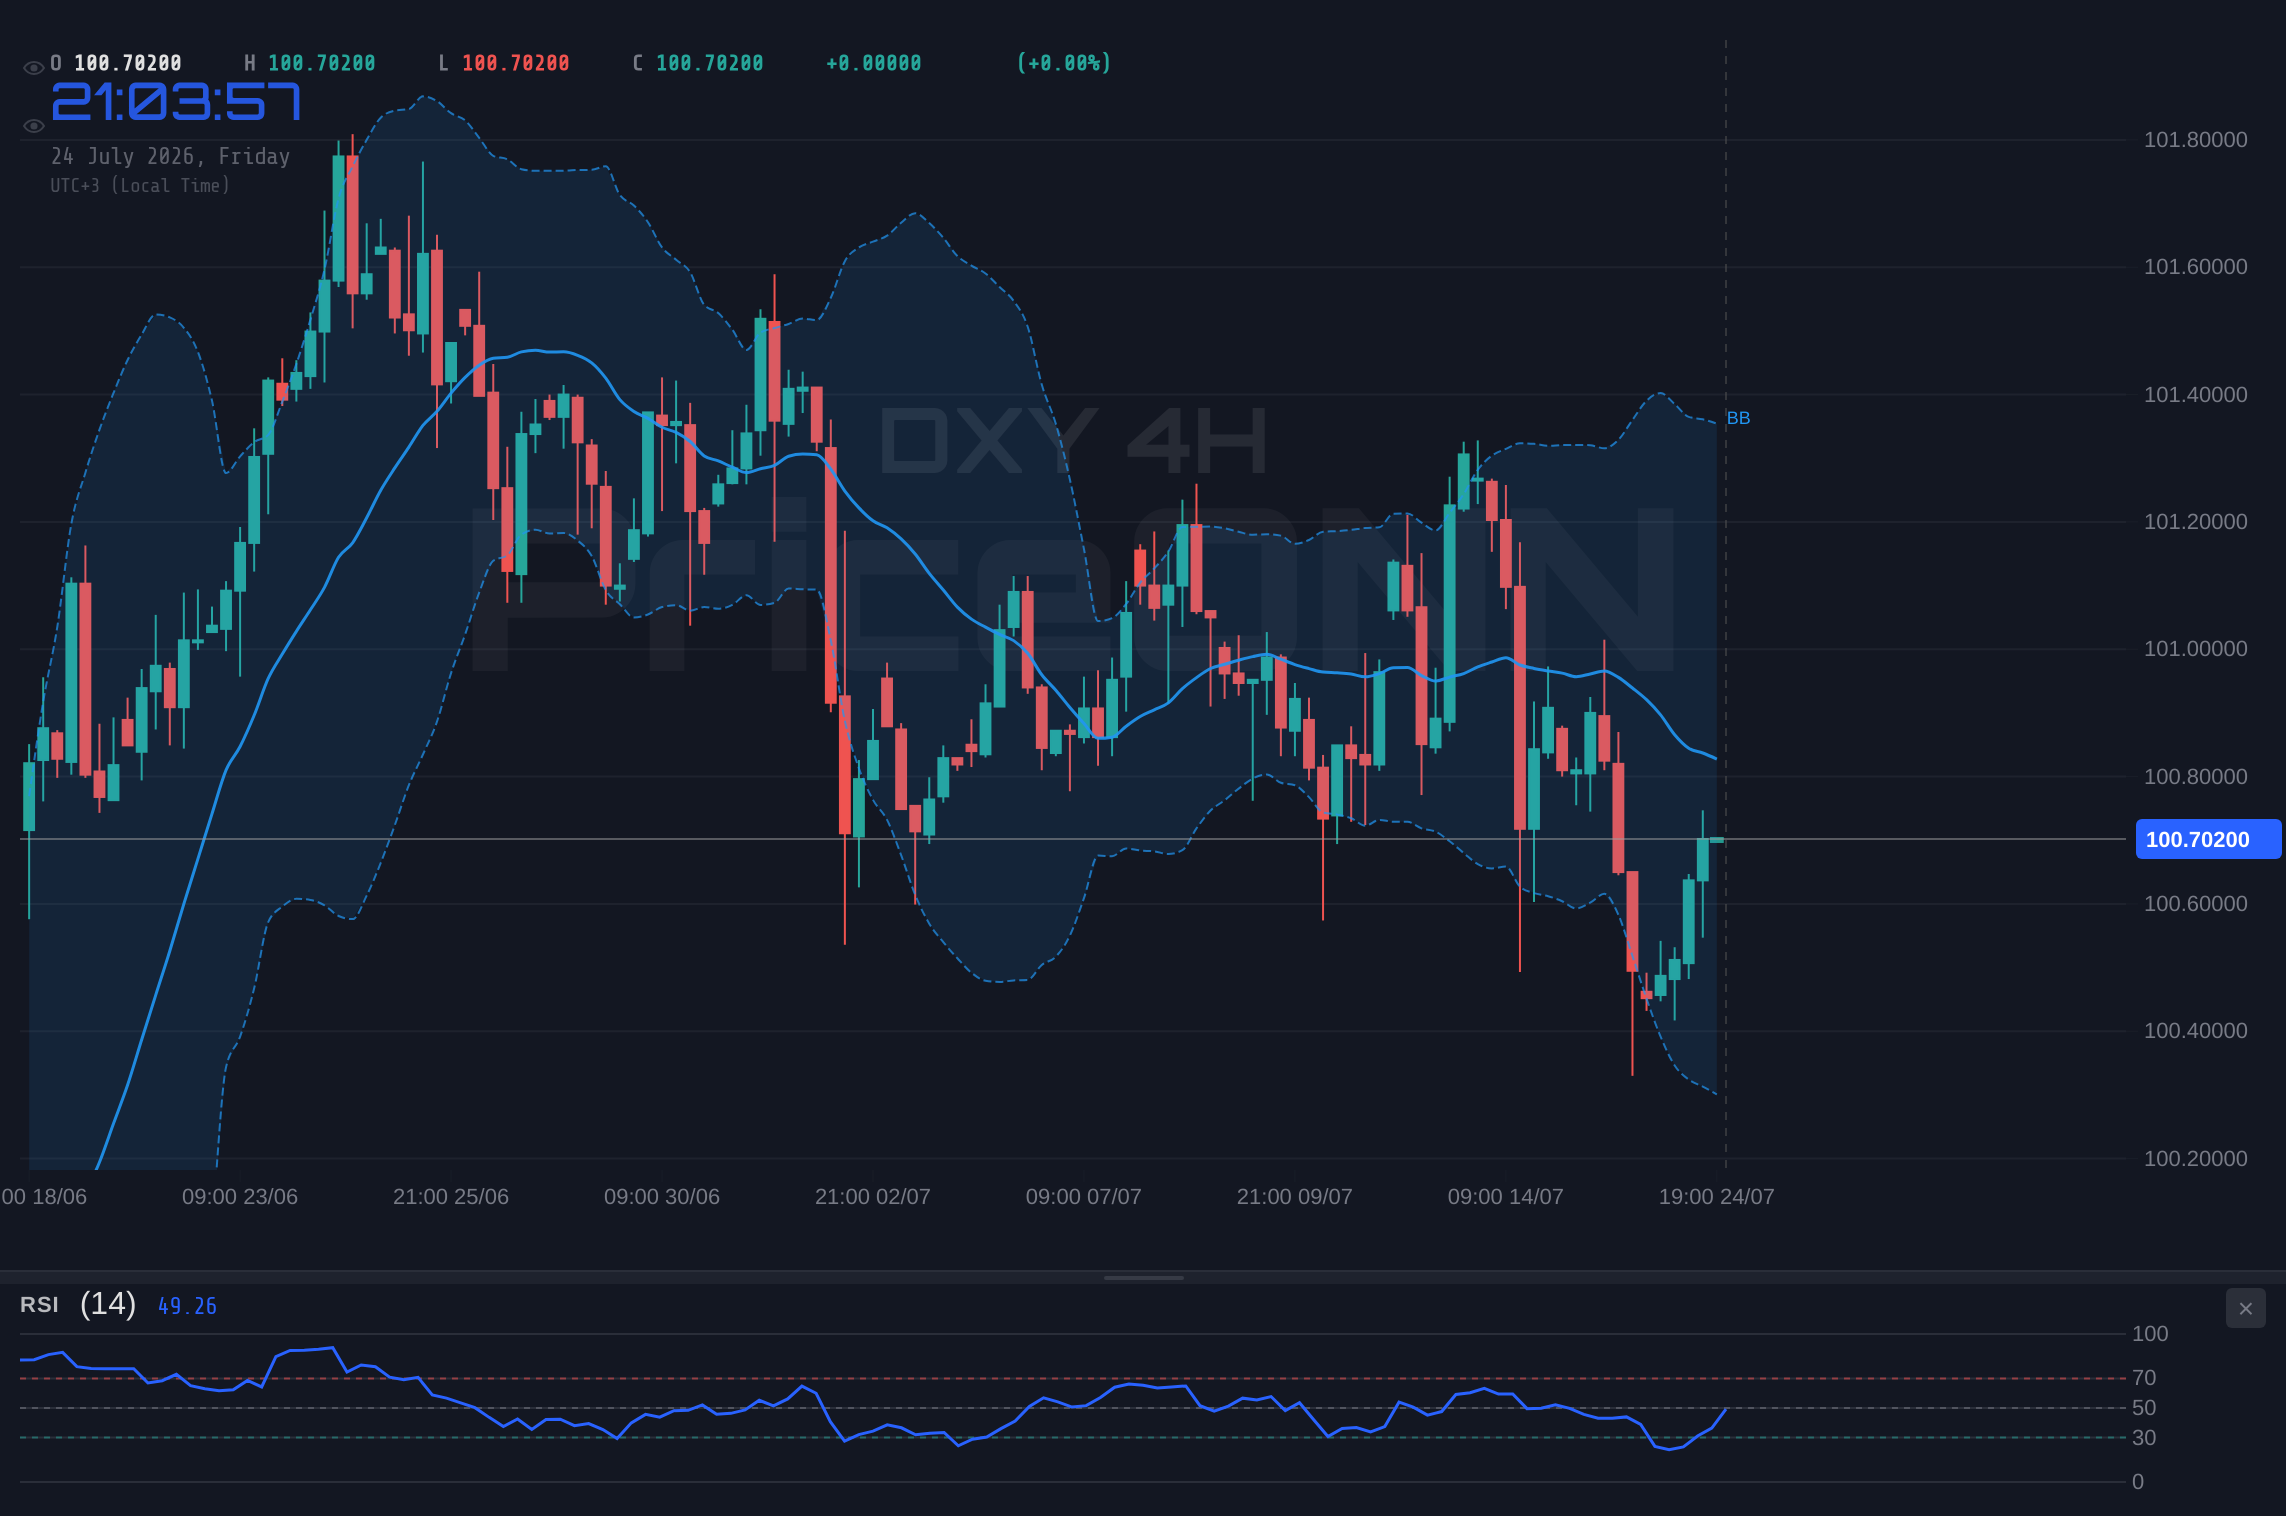
The technical picture on the DXY further supports the notion of upward pressure, though it also highlights the significance of the current price zone. On the 1-hour chart, the DXY is trading at $100.70, approaching immediate resistance at $100.73. The Relative Strength Index (RSI) at 56.6 indicates a healthy upward momentum, suggesting that buyers are still in control, but it's far from being in overbought territory, leaving room for further gains. The MACD histogram is also showing positive momentum, trading above its signal line, which typically reinforces a bullish outlook. However, the Average Directional Index (ADX) reading of 27.71 on the 1-hour chart points to a strong uptrend, but the overall trend strength might need further confirmation across higher timeframes. The Stochastic Oscillator, with K at 86.15 and D at 82.01, is firmly in overbought territory on the 1-hour timeframe, suggesting that a short-term pullback or consolidation could be imminent before any sustained move higher. This divergence between the MACD's bullish signal and the Stochastic's overbought condition warrants caution for immediate entry. It suggests that while the trend is upward, the pace might be unsustainable without a brief pause or correction.
Zooming out to the 4-hour timeframe, the DXY presents a slightly different, yet still predominantly bullish, technical profile. The index is trading at $100.70, with key support levels identified at $100.53, $100.42, and $100.37. Resistance is seen around $100.70, $100.75, and $100.86. The RSI here is at 46.15, which is in neutral territory and shows a slight downward tendency, contrasting with the 1-hour chart's momentum. This could indicate that the upward push is losing some steam on this timeframe. The MACD is displaying negative momentum, with the MACD line below its signal line, suggesting a potential shift towards bearish pressure or at least a pause in the rally. The Bollinger Bands show the price trading below the middle band, indicating a bearish bias on this timeframe. However, the Stochastic Oscillator is showing a rising signal with K at 41.9 and D at 27.16, suggesting potential for an upward move. The ADX at 25.26 indicates a strong downtrend on this timeframe, which contradicts the general upward bias seen on the 1-hour chart and the overall market sentiment driven by macro factors. This mixed signal on the 4-hour chart suggests that while the broader trend might be bullish, there's a lack of conviction and potential for consolidation or even a minor pullback.
The daily chart provides the most comprehensive view of the DXY's longer-term trend and its current position relative to significant historical levels. Currently trading at $100.70, the DXY is approaching substantial resistance. The daily RSI is at 51.34, sitting squarely in neutral territory and showing a slight upward inclination, suggesting that the market is balanced but leaning towards buyers. The MACD indicator on the daily chart is exhibiting negative momentum, with the MACD line below its signal line, which typically signals a bearish outlook or a potential reversal. This contrasts sharply with the short-term bullish signals and the macro-driven optimism. The Bollinger Bands are also showing the price below the middle band, reinforcing the bearish bias on the daily timeframe. The Stochastic Oscillator, with K at 32.61 and D at 44.07, is displaying a bearish signal, indicating that a downtrend might be favored. However, the ADX at 27.03 suggests a strong uptrend, which creates a significant divergence among the daily indicators. This divergence is crucial: it implies that while the trend strength might be present, the underlying momentum indicators are not fully supporting a sustained rally from these levels. This complex interplay of signals suggests that while the DXY has room to move higher in the short term, the daily chart indicates significant headwinds and potential for a reversal or consolidation phase once the current upward momentum wanes.
The interplay between the DXY and other major markets is critical for a holistic understanding of the current financial environment. As the DXY strengthens, typically we see inverse correlation with major currency pairs like EURUSD and GBPUSD, as well as with commodities like gold (XAUUSD). The provided data shows the DXY at $100.70, exhibiting upward momentum. Concurrently, EURUSD is trading at 1.14436, showing a mixed technical picture across timeframes but a generally weaker short-term trend signal. GBPUSD is at 1.34773, also showing a predominantly bearish signal on the 1-hour chart, aligning with a stronger dollar. Gold, XAUUSD, is trading at $4001.21, showing a clear bearish trend on all timeframes, consistent with a strengthening dollar and potential risk-off sentiment. The S&P 500 (SP500) is trading at 6572.87, showing a mixed to bullish short-term trend but a bearish daily outlook, suggesting potential risk aversion in the broader equity market. Nasdaq100, at 29164.86, also shows a predominantly bearish trend across timeframes. This broad market reaction underscores the DXY's role as a barometer of global risk sentiment and interest rate expectations. When the DXY rallies, it often signals a preference for dollar-denominated assets and a move away from riskier investments or currencies perceived to be less stable or offering lower yields.
Looking at the economic calendar, the upcoming week is packed with crucial events that could significantly influence the DXY's trajectory. The Federal Reserve's monetary policy decisions are always a focal point, and with inflation fears resurfacing due to the oil price rally, any hawkish commentary or signals from the Fed will likely provide a substantial boost to the dollar. Reports from financial news outlets indicate that markets are 'pricing in more US rate hikes,' and that the Fed faces an 'Inflation Test.' This suggests that any deviation from the expected path, whether through aggressive forward guidance or unexpected policy shifts, could trigger significant market movements. Furthermore, the Bank of England (BoE) and Bank of Japan (BoJ) also have policy meetings scheduled. While the Fed's actions often have the most direct impact on the DXY, the BoE's stance on inflation in the UK and the BoJ's ongoing battle with deflationary pressures will also contribute to the global currency landscape. The market's sensitivity to inflation data, such as CPI and employment reports, will be heightened, making these releases critical catalysts for short-term DXY fluctuations. Any indication that inflation is proving more persistent than anticipated could lead to further dollar strength as markets anticipate a prolonged period of higher interest rates.
Navigating the Resistance: Scenarios for the DXY
Given the confluence of technical signals and macro-driven narratives, the DXY at $100.70 presents a complex trading environment. The immediate challenge lies in overcoming the resistance levels identified around $100.73, $100.75, and $100.86. The bullish momentum seen on shorter timeframes, fueled by oil prices and rate hike expectations, suggests potential for an upward break. However, the conflicting signals on the daily chart, particularly the bearish MACD and Stochastic readings, temper the optimism and highlight the risk of a stall or reversal. Traders must carefully weigh these factors and prepare for various outcomes.
Bearish Reversal Scenario: Dollar Fades at Resistance
65% ProbabilityConsolidation Phase: Choppy Trading Near Resistance
25% ProbabilityBullish Breakout: Dollar Extends Gains
10% ProbabilityThe immediate outlook for the DXY hinges on its ability to decisively break through the $100.70-$100.73 resistance zone. The bullish momentum fueled by rising oil prices and the anticipation of a hawkish Federal Reserve stance provides a tailwind. However, the conflicting signals on the daily chart, particularly the bearish divergence on key oscillators like the MACD and Stochastic, suggest that any upward move may face significant selling pressure. If the DXY fails to hold above $100.70, a pullback towards the $100.53 support level is highly probable, especially if upcoming economic data fails to reinforce the inflation narrative or if geopolitical risks subside temporarily. Conversely, a strong close above $100.73, confirmed by sustained buying volume and positive daily chart developments, could pave the way for a test of higher resistance levels, potentially extending towards $100.75 and beyond. Traders should remain vigilant, monitor the price action around the $100.70 mark closely, and be prepared to adjust their positions based on the evolving technical and fundamental landscape. The coming days, laden with crucial economic data and central bank commentary, will likely provide the clarity needed to determine the DXY's next significant move.
Upcoming economic data releases, including key inflation reports and central bank statements, pose a significant risk of increased volatility. Traders should exercise caution and ensure adequate risk management strategies are in place.
Frequently Asked Questions: DXY Analysis
What happens if DXY fails to break above $100.73 resistance?
If DXY fails to break and hold above the $100.73 resistance level, a bearish reversal scenario becomes more probable. This could lead to a pullback towards the $100.64 support on the 1-hour chart, and potentially further down to the $100.53 support level on the 4-hour chart as momentum fades.
Should I buy DXY at current levels of $100.70 given the mixed signals?
Buying DXY at $100.70 carries risk due to the approaching resistance and conflicting signals between short-term bullish momentum and longer-term bearish indicators. A more prudent approach might be to wait for confirmation of a breakout above $100.73 or a confirmed pullback to a more attractive support level like $100.53.
Is the RSI at 56.6 a sell signal for DXY right now?
An RSI of 56.6 on the 1-hour chart is not typically considered a sell signal; it indicates upward momentum but is not yet in overbought territory. However, on the daily chart, the RSI at 51.34 is more neutral, and combined with other bearish daily indicators, it suggests that the upward pressure might be limited from current levels.
How will the upcoming Fed decision affect DXY this week?
The upcoming Federal Reserve decision is a critical catalyst. If the Fed signals a more hawkish stance due to persistent inflation fears (exacerbated by oil prices), it could significantly boost the DXY above $100.70, potentially targeting higher resistance levels. Conversely, a more dovish tone could lead to a sharp reversal.
Track markets in real-time
AI-powered analysis, technical indicators and real-time price data.
Join Our Telegram Channel
Breaking market news, AI analysis and trading signals instantly.
Join Channel