

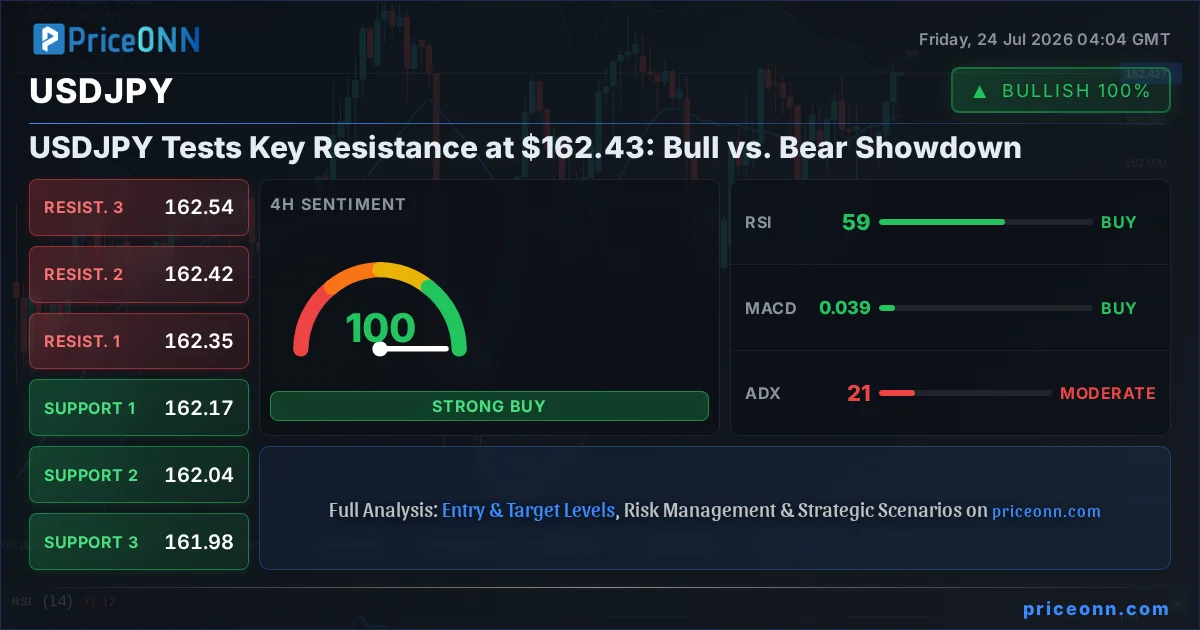
The relentless climb in USDJPY has brought the pair to a crucial juncture, currently hovering around the $162.43 mark. This level isn't just another price point; it represents a significant battleground where bullish momentum clashes with potential bearish reversals. With the Dollar Index (DXY) showing renewed strength and oil prices adding inflationary pressure, the landscape is set for a fierce tug-of-war. This analysis dives deep into the USDJPY today analysis, exploring the technical indicators, fundamental drivers, and market sentiment that will dictate its next move. We'll dissect the arguments for both the bulls and the bears, examining the data that supports each case and looking for the confluence of factors that could tip the scales.
- USDJPY faces critical resistance at $162.43, a key level tested multiple times this week.
- The DXY is trading around 100.7, showing strength that typically pressures USDJPY.
- On the 1D chart, RSI is at 60.52, indicating a neutral-to-bullish bias, while ADX at 18.76 suggests a weak trend.
- With oil prices rising and geopolitical tensions simmering, inflation concerns could support further USDJPY gains, but caution is warranted.
The question on every trader's mind is whether USDJPY can break through this formidable resistance, extending its impressive rally, or if this is the point where profit-taking and a potential reversal come into play. The daily chart shows a pair pushing higher, but the underlying trend strength, as indicated by the ADX at 18.76, remains weak, suggesting a lack of sustained commitment. This presents a classic scenario: a strong upward move encountering a significant hurdle, with conflicting signals from various technical indicators. The interplay between the US Dollar's strength, Japanese Yen's potential intervention risks, and broader market sentiment will be key in determining the outcome.
The Bull Case: Momentum and Macro Tailwinds
The Yen's Vulnerability Amidst Global Pressures
The primary engine driving USDJPY higher has been the persistent weakness in the Japanese Yen, exacerbated by the Bank of Japan's (BoJ) ultra-loose monetary policy contrasting sharply with tightening cycles elsewhere. While the European Central Bank (ECB) held rates steady recently, the narrative around inflation and potential future policy shifts keeps the Euro somewhat supported, indirectly strengthening the dollar against the Yen. Recent news flow highlights this divergence: oil prices are climbing, reigniting inflation risks, which usually benefits the dollar as it prompts speculation about a more hawkish Federal Reserve stance. Even though the Fed has paused its hiking cycle, the market anticipates that higher inflation could delay any potential rate cuts, keeping US Treasury yields elevated. This yield differential is a powerful driver for USDJPY, and as long as it persists, the bulls have a strong argument.
Technical Affirmation for the Bulls
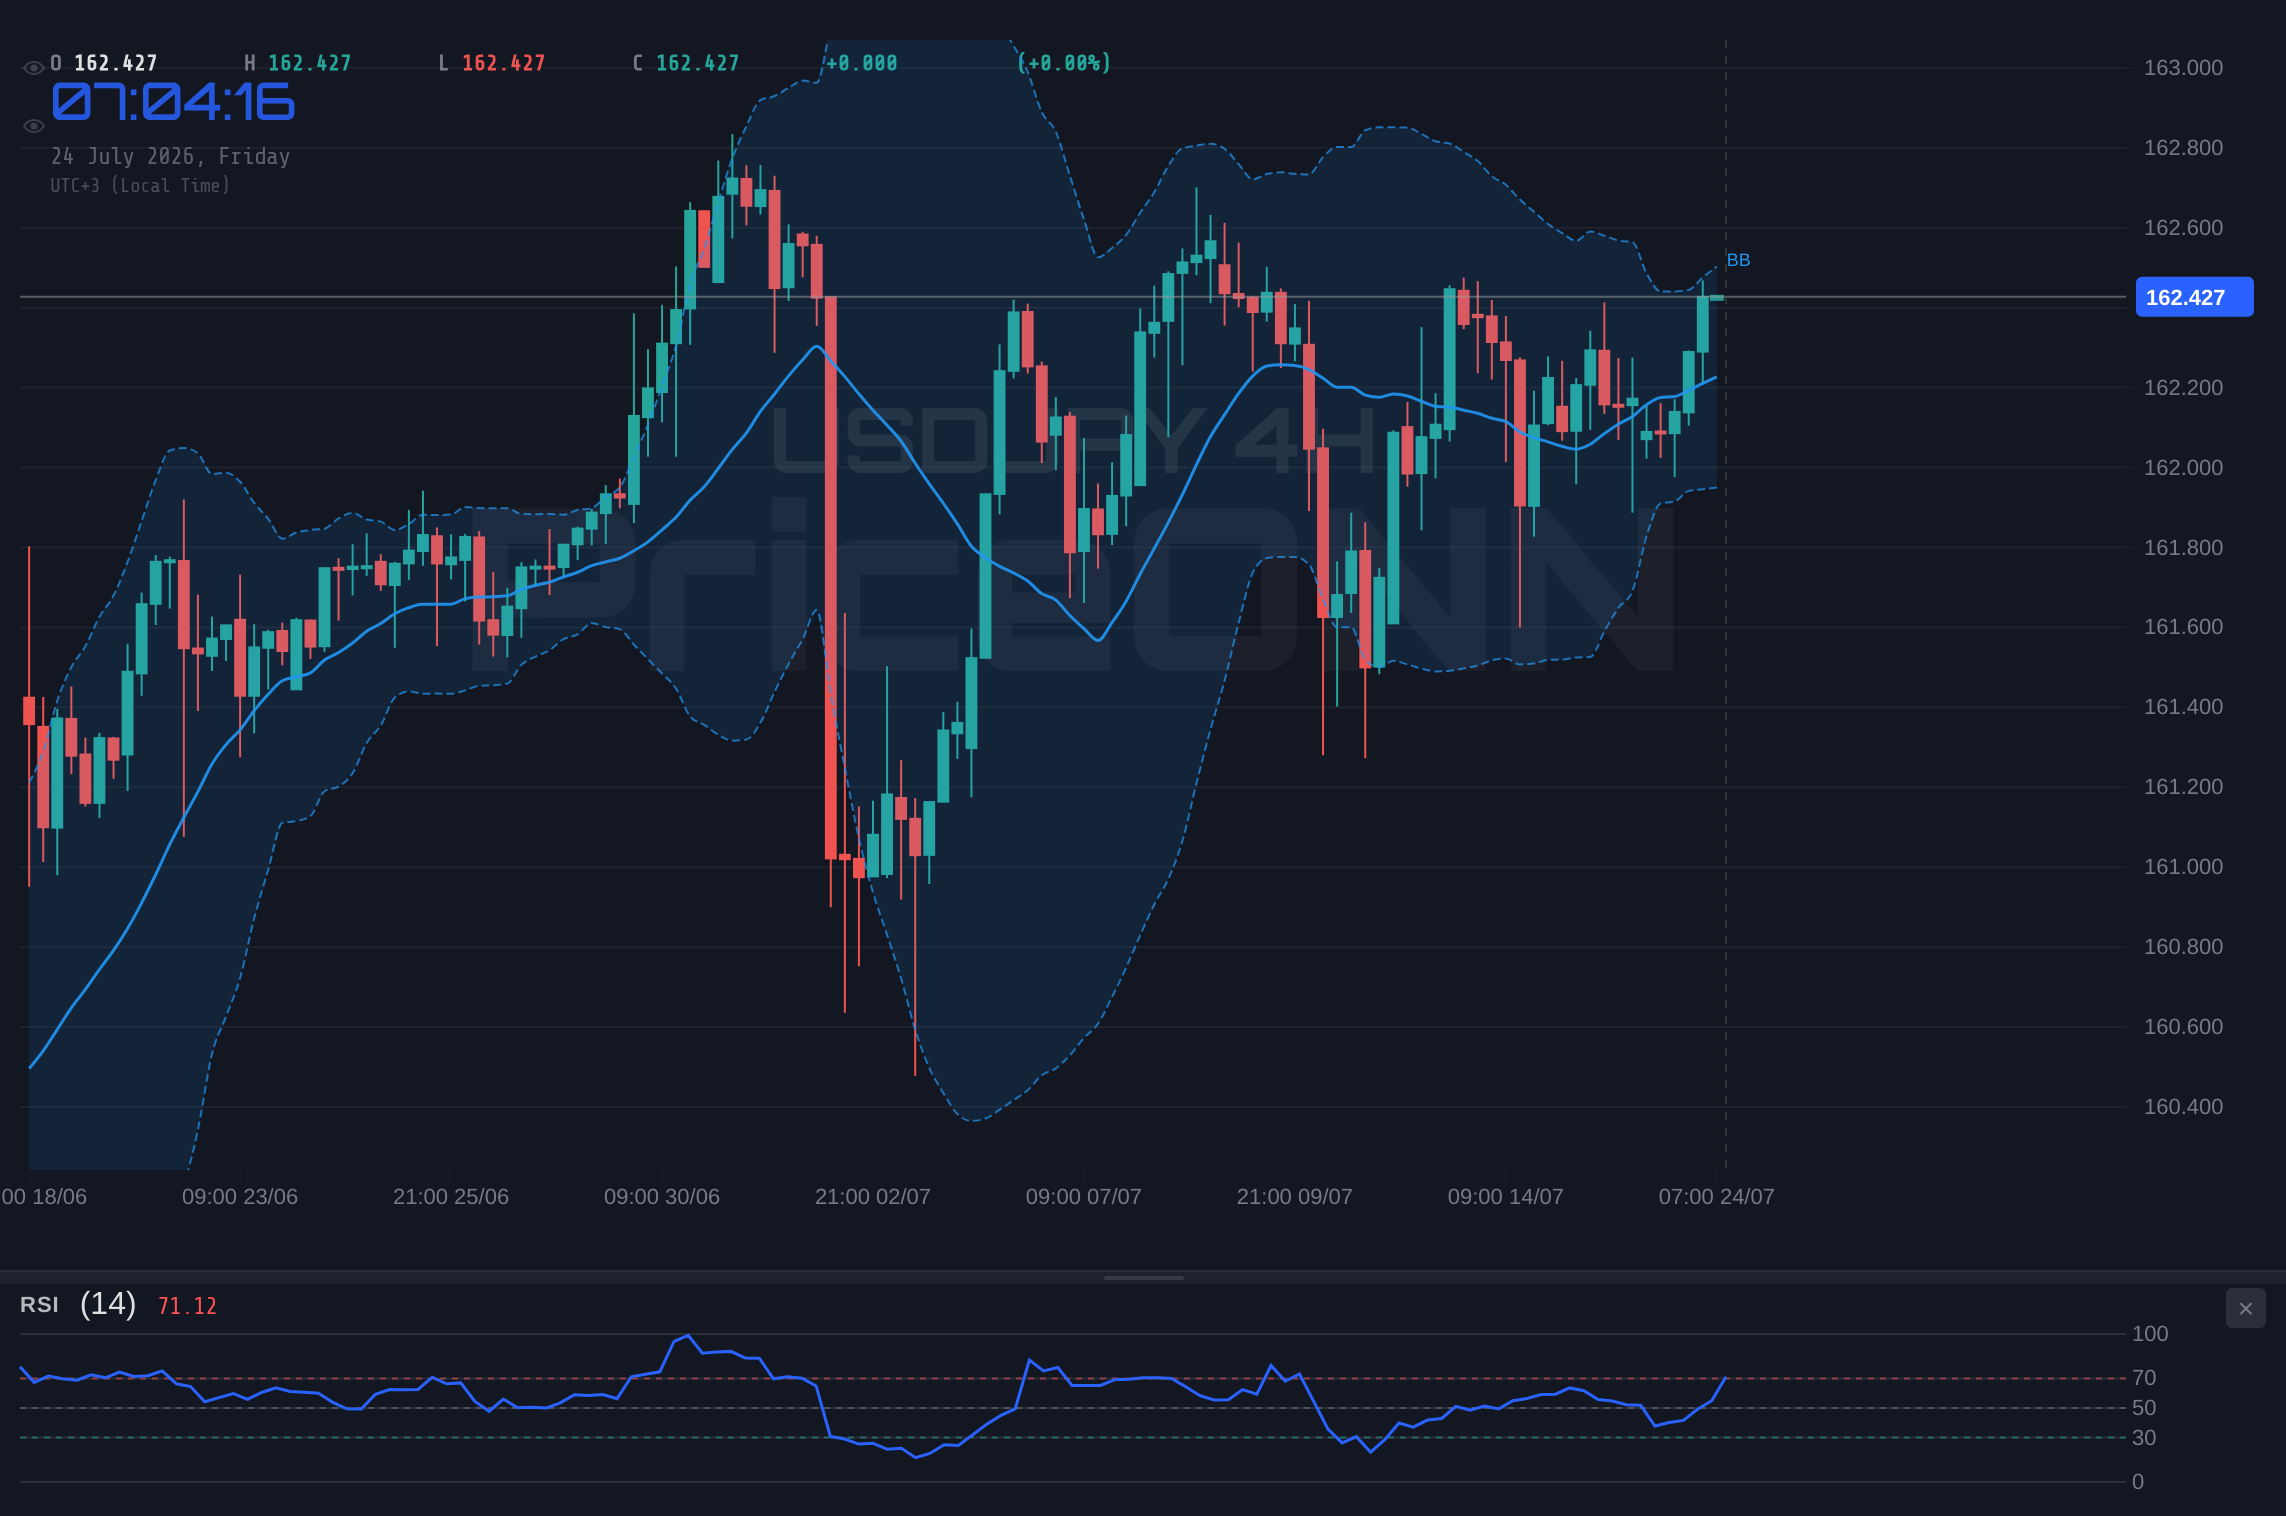
Looking at the technical data, several indicators on the daily chart suggest that the bullish momentum, while perhaps not overwhelming, is still in play. The RSI(14) is sitting at 60.52, comfortably in the neutral-to-bullish territory and trending upwards, indicating room for further appreciation before hitting overbought conditions. The MACD, although showing negative momentum on the 1H and 4H charts, is positive on the daily timeframe, with its histogram above the signal line, suggesting that the longer-term trend still has some legs. Furthermore, the Stochastic Oscillator on the daily chart is showing a bullish signal with %K at 83.32 and %D at 75.77, indicating an upward crossover in an overbought zone, which can sometimes precede further upside in strong trends. The Bollinger Bands on the daily chart are also above the middle band, reinforcing the upward bias. The 4-hour chart, in particular, shows a strong trend (ADX: 25.63) with a bullish signal, and the 1-hour chart, despite some recent pullback, also leans towards a 'BUY' signal with a strong majority of indicators suggesting upside potential.
Correlation with DXY and Oil
The correlation between USDJPY and the DXY (Dollar Index) is a critical factor. Currently, the DXY is trading around 100.7, showing a moderate increase. Historically, a rising DXY often correlates with a stronger USDJPY. The DXY's upward move suggests that the US dollar is gaining strength against a basket of major currencies, which aligns with the bullish case for USDJPY. Adding to this, Brent crude oil prices are climbing, nearing $83.79 on the 1H chart. Rising oil prices can signal increasing inflationary pressures, which could lead the Federal Reserve to maintain a higher-for-longer stance on interest rates, thereby supporting the dollar. This macro backdrop, where a stronger dollar is supported by both yield differentials and inflation concerns, provides a fundamental tailwind for USDJPY. The upward trend on the 1D chart for USDJPY, with support at $161.90, $161.63, and $161.37, suggests that dips might be seen as buying opportunities by market participants.
The Bear Case: Resistance, Intervention Fears, and Divergences
The $162.43 Barrier and Intervention Risk
Despite the bullish arguments, the immediate obstacle at $162.43 is significant. This resistance level has been tested, and the pair's inability to decisively break above it on the 1H chart, coupled with the ADX reading of 19.33 suggesting a weak trend on this timeframe, points to potential exhaustion. More importantly, the psychological barrier and the increasing likelihood of direct intervention from Japanese authorities loom large. Japanese officials have repeatedly warned about excessive Yen weakness, and a sustained push above $162.43 could trigger direct market intervention aimed at supporting the Yen. Such an event could lead to a sharp, rapid reversal, catching many long positions off guard. The daily chart's resistance levels at $162.428, $162.683, and $162.954 highlight the significant price ceiling ahead.
Conflicting Technical Signals and Short-Term Weakness
While the daily chart offers some bullish signals, a closer look at shorter timeframes reveals significant counter-arguments. On the 1-hour chart, the overall signal is 'SELL', with RSI at 43.67 trending down and MACD showing negative momentum. The Stochastic Oscillator is also in a bearish configuration (%K
Macroeconomic Nuances and Risk Sentiment
The narrative around inflation and central bank policy is not entirely straightforward. While rising oil prices (Brent at $83.79) do stoke inflation fears, they also risk dampening global growth. If the market starts to price in a significant global slowdown due to high energy costs, risk appetite could diminish. In such a 'risk-off' scenario, safe-haven assets like the Japanese Yen might see renewed demand, contrary to the prevailing trend. The recent news about oil climbing on Middle East escalation, but markets resisting a full risk-off shift, indicates this delicate balance. Furthermore, the recent ECB meeting, where rates were held steady but the central bank closely watched energy shocks, suggests that while tightening is on the table, growth concerns are also significant. This nuanced macro environment means that the bullish case for USDJPY isn't a one-way street. The fact that the Nasdaq 100 is showing a strong downward trend on the 1H chart (ADX: 33.23) and SP500 has a strong bearish trend on the daily (ADX: 47.51) also hints at potential risk aversion that could benefit the Yen.
Weighing the Evidence: A Technical and Fundamental Confluence
The Battle at $162.43
The immediate focus remains squarely on the $162.43 resistance level. On the 1-hour chart, the ADX at 19.33 indicates a weak trend, making a decisive breakout less likely without significant fundamental catalysts or a clear shift in risk sentiment. The Stochastic Oscillator is giving a bullish signal (%K > %D), but it's emerging from oversold territory, which can sometimes lead to a false breakout. The RSI at 43.67 is still below 50, suggesting that sellers are still present. This confluence of a weak intraday trend and resistance makes a move higher a high-risk proposition without further confirmation. The support levels at $162.392, $162.367, and $162.329 are crucial to watch on the downside.
Intermarket Dynamics: DXY, Oil, and Equities
The relationship with the DXY (currently at 100.7) is paramount. If the DXY continues its upward trajectory, it provides a strong tailwind for USDJPY. However, the DXY itself is facing mixed signals, with its 1H chart showing bullish momentum (RSI 56.6, MACD positive) but its 4H and 1D charts exhibiting negative momentum and bearish signals. This suggests that the dollar's strength might not be as robust as the USDJPY bulls hope. Rising oil prices, while potentially supporting the dollar via inflation expectations, could also trigger risk aversion if they escalate geopolitical tensions further. The weakness in major equity indices like Nasdaq 100 (daily trend: bearish, ADX: 15.12) and SP500 (daily trend: bearish, ADX: 47.51) indicates that a broader market downturn could indeed lead to a flight to safety, benefiting the Yen and putting pressure on USDJPY. This is a critical point: while inflation might support the dollar, a severe risk-off event could undermine the USDJPY rally.
The Verdict: Cautious Optimism with a Strong Caveat
Given the data, the USDJPY trading at $162.43 presents a complex picture. The daily technicals offer a degree of bullish validation, particularly the RSI and Stochastic signals, suggesting that the underlying trend still has potential. The macro environment, with persistent yield differentials and rising oil prices, also leans towards dollar strength. However, the immediate resistance at $162.43, coupled with the threat of Japanese intervention and the conflicting signals on shorter timeframes, demands extreme caution. The weak trend strength indicated by the ADX on the 1H and 1D charts means that a breakout needs strong conviction. Therefore, while the bulls have a case, the risk of a sharp reversal or consolidation is significant. The key levels to watch remain $162.43 for resistance and $161.902 for immediate support.
Trade Scenarios for USDJPY at $162.43
Bearish Scenario: Intervention or Exhaustion at Resistance
60% ProbabilityNeutral Scenario: Consolidation Around Resistance
25% ProbabilityBullish Scenario: Breakout Above Resistance
15% ProbabilityFrequently Asked Questions: USDJPY Analysis
What happens if USDJPY breaks above the $162.43 resistance level?
A decisive break above $162.43, supported by strong volume and bullish technical signals like RSI above 60 and MACD confirmation, could propel USDJPY towards the next daily resistance levels at $162.683 and potentially $162.954. This scenario would likely be fueled by continued dollar strength and persistent Yen weakness.
Should I buy USDJPY at current levels of $162.43 given the mixed signals?
Buying at current levels carries significant risk due to the strong resistance at $162.43 and conflicting signals on shorter timeframes. A more prudent approach would be to wait for confirmation: either a clear breakout above resistance with bullish follow-through, or a pullback to support levels like $161.902 where risk/reward might be more favorable. A probability of 15% is assigned to a bullish breakout scenario.
Is the RSI at 60.52 a buy signal for USDJPY on the daily chart?
An RSI reading of 60.52 on the daily chart indicates a neutral-to-bullish bias, suggesting that while there is upward momentum, it's not yet in overbought territory (typically above 70). It's not a standalone buy signal but rather a component of a broader bullish picture, especially when aligned with other indicators like the MACD and Stochastic on the daily timeframe. However, shorter-term bearish signals necessitate caution.
How will rising oil prices and DXY strength affect USDJPY this week?
Rising oil prices ($83.79 Brent) can indirectly support USDJPY by fueling inflation expectations, potentially keeping the Fed hawkish and widening the yield gap with Japan. Simultaneously, a strong DXY (around 100.7) also typically correlates with higher USDJPY. However, extreme oil price spikes could trigger risk aversion, potentially benefiting the Yen and capping USDJPY gains, making this a complex interplay to monitor.
The path forward for USDJPY hinges on its ability to decisively overcome the $162.43 resistance. While the daily charts present a somewhat optimistic outlook, the immediate technicals and the ever-present threat of intervention inject a significant dose of caution. Traders must remain vigilant, watching for confirmation of a breakout or clear signs of reversal. The market is at a critical juncture, and patience will likely be rewarded for those who wait for a clearer setup, manage their risk diligently, and adhere to the data. The interplay of macroeconomics, technical levels, and potential intervention creates a dynamic environment where opportunities can arise, but only for those who are prepared.
Technical Outlook Summary
| Indicator | Value | Signal | Interpretation |
|---|---|---|---|
| RSI (14) | 60.52 | Neutral | On daily chart, suggests room to move; shorter timeframes show caution. |
| MACD Histogram | 0.178 | Bullish | Positive on daily, but negative momentum on 1H/4H requires monitoring. |
| Stochastic | 83.32 / 75.77 | Bullish | Daily shows bullish crossover in overbought zone; caution advised. |
| ADX | 18.76 | Weak Trend | Daily trend strength is low, indicating potential for range-bound or reversal. |
| Bollinger | Middle Band | Bullish | Price is above the middle band on daily chart, indicating upward bias. |
Key Levels
Track markets in real-time
AI-powered analysis, technical indicators and real-time price data.
Join Our Telegram Channel
Breaking market news, AI analysis and trading signals instantly.
Join Channel