

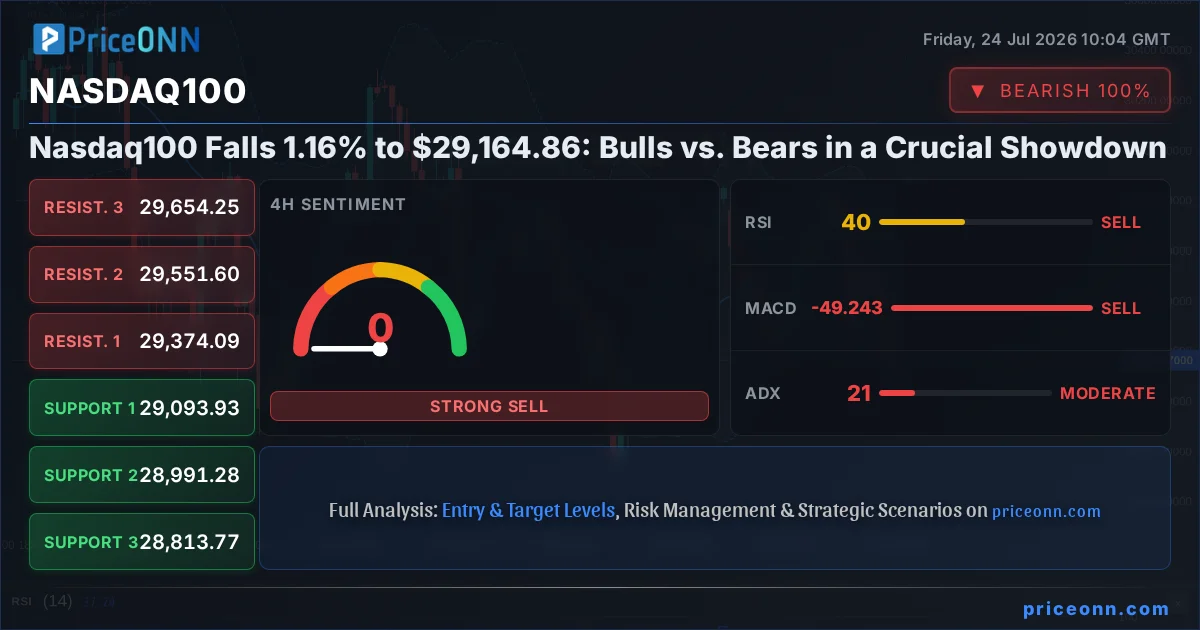
The Nasdaq100 is currently locked in a fierce battle between bulls and bears, trading at $29,164.86 after a significant 1.16% drop. This pivotal moment demands a deep dive into the competing forces shaping the index's immediate future. With the daily range spanning from 29,064.43 to 29,599.7, the market is clearly showing signs of indecision, but the recent downward pressure suggests the bears might be gaining a temporary upper hand. Understanding the intricate interplay between technical indicators, broader market correlations, and underlying sentiment is crucial for navigating this volatile landscape. This analysis will dissect the arguments for both sides, weighing the evidence to determine the most probable path forward for the tech-heavy index.
- RSI at 32.77 on the 1H chart signals oversold pressure, but the 1D RSI at 46.36 indicates room for further decline.
- Critical support sits at $29,064.43, the lower bound of today's trading range, with the next significant level at $28,511.31 on the daily chart.
- MACD histogram on the 1H and 4H charts shows negative momentum, suggesting bearish sentiment is currently dominant.
- The correlation with a strengthening DXY (100.7) and falling oil prices (Brent $83.79) suggests a risk-off environment, potentially weighing on tech equities.
The Bulls' Last Stand: Can Nasdaq100 Find Its Footing?
The Argument for a Rebound
The bulls are clinging to the hope that the recent dip represents a healthy pullback within a larger uptrend, rather than the start of a significant correction. They point to the Nasdaq100's resilience throughout the year, driven by innovation in artificial intelligence, cloud computing, and robust corporate earnings from tech giants. The argument is that the current price action is merely a pause for breath, a necessary consolidation before the next leg higher. Key to this thesis is the ability for the index to hold above the $29,064.43 daily low and, more importantly, the critical support at $28,511.31. Historical patterns suggest that after sharp declines, markets often find their footing at significant psychological and technical levels. The bulls are betting that $29,064.43 will act as a temporary floor, potentially leading to a bounce towards the 1H resistance at $29,260.86. A decisive break above this level, coupled with increasing volume, could signal a renewed buying interest, pushing towards the 4H resistance at $29,374.09 and eventually challenging the daily resistance at $29,848.39.
Furthermore, the bulls find some solace in the Stochastic indicator on the 1H chart, which shows a rising %K line above %D (K=30.97, D=20.52), hinting at a potential short-term reversal from oversold conditions. While this is a minor signal against the backdrop of broader bearish momentum, it represents the best hope for an immediate turnaround. They also look at the 1D RSI at 46.36, noting it's not yet in deeply oversold territory, implying there's still room for the index to fall before a significant oversold bounce is mathematically probable. However, this also means that if buyers step in aggressively, there's ample space for the RSI to climb back towards the 50-level and beyond, signaling a return of strength. The narrative here is one of opportunistic buying, believing that the dip has created an attractive entry point for long-term investors who are betting on the continued dominance of technology.
Underlying Strengths to Support the Bull Case
Beyond the immediate technicals, the bulls are counting on several underlying factors. The relentless pace of technological advancement, particularly in AI, continues to fuel long-term growth prospects for many Nasdaq100 constituents. Companies are investing heavily in infrastructure, and the demand for semiconductors, cloud services, and advanced software remains strong. Even with the recent market jitters, the fundamental growth story for many of these tech giants remains largely intact. They are also looking at the broader market context: while the DXY is showing strength at 100.7, and oil prices are elevated, the immediate threat of a major geopolitical escalation might be receding, allowing some risk appetite to return. If this sentiment shift occurs, it would directly benefit growth-oriented assets like the Nasdaq100.
The bulls also argue that market participants may have overreacted to recent inflation fears or geopolitical tensions. They believe that central banks, particularly the Federal Reserve, are still likely to pivot towards easing monetary policy later in the year or early next year, which would be a significant tailwind for equities. While current Fed rate expectations might be fluctuating, the long-term trajectory of interest rates is a key consideration. If inflation proves to be more transitory than feared, and if central banks can engineer a soft landing, the Nasdaq100 could resume its upward trajectory. The fact that the Dow Jones 30 is showing a strong daily trend (93% strength) and the S&P 500 is also in a strong uptrend on the 1H chart (100% strength) provides some cross-market support, suggesting that the weakness in Nasdaq might be a sector-specific rotation rather than a broad market collapse.
The Bears' Grip: Why Caution is Warranted
The Case for Further Declines
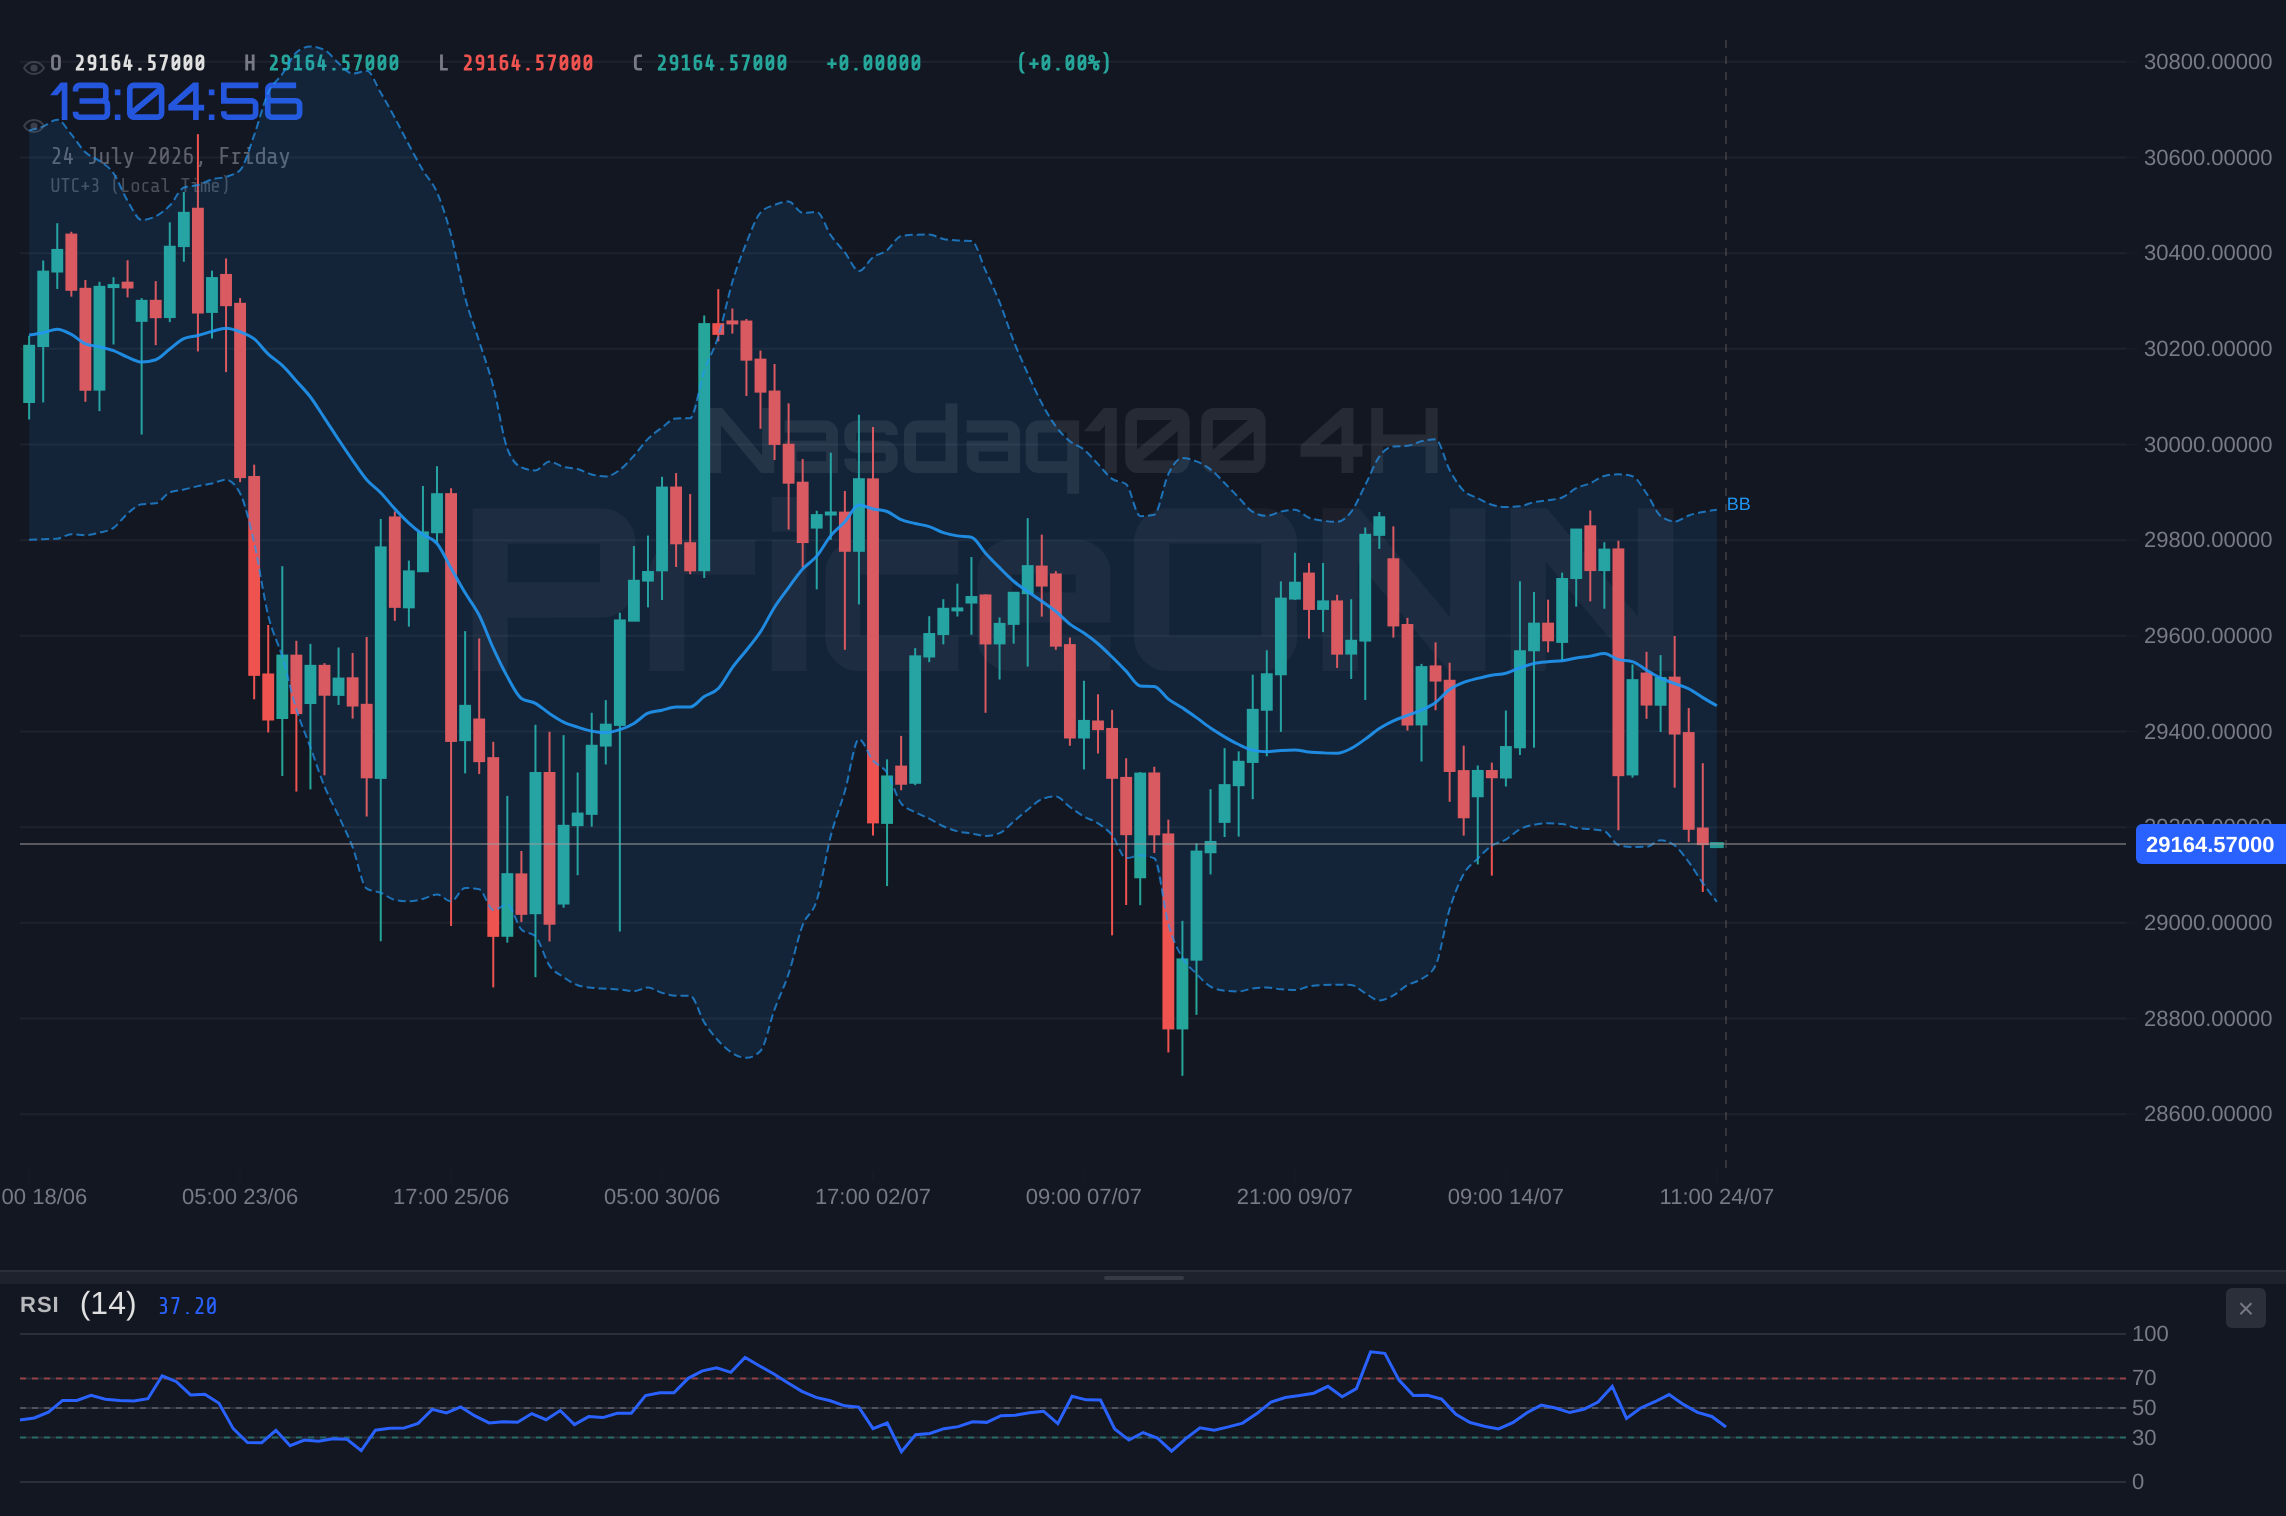
On the other side of the ledger, the bears see the current Nasdaq100 price action as a clear warning sign. The 1.16% drop on the day, coupled with negative momentum across multiple timeframes (1H and 4H MACD histograms are negative), paints a bearish picture. They highlight that the index is trading below the middle Bollinger Band on the 1H and 4H charts, indicating downward pressure. The ADX at 33.23 on the 1H chart suggests a strong downtrend is in play, and the fact that the RSI (14) is at 32.77 on the 1H chart, while not deeply oversold, shows significant selling momentum. The bears' primary target is the daily support level at $28,511.31. They believe the current price of $29,164.86 is merely a temporary pause before the inevitable test of this lower, more significant support zone. A break below $29,064.43 would be the first confirmation of this bearish thesis.
The bears also point to the broader macroeconomic environment as a reason for concern. The strengthening US Dollar Index (DXY) to 100.7, a move typically inversely correlated with risk assets like the Nasdaq100, is a significant headwind. Furthermore, rising oil prices, with Brent crude at $83.79 and WTI at $79.59, are reigniting inflation concerns. This could force central banks to maintain a hawkish stance for longer, or even hike rates further, which is detrimental to growth stocks. The recent news of Middle East escalation, even if markets are resisting a full risk-off shift, adds an undercurrent of geopolitical uncertainty that favors safer assets over speculative tech plays. The bears see the current price as an opportunity to short the market, expecting a move down towards the 4H support of $28,813.77 and ultimately the daily support at $28,511.31.
Indicators Aligning with the Bearish View
Several technical indicators lend credence to the bears' argument. On the 1H chart, the Stochastic indicator (K=30.97, D=20.52) shows the %K line above %D, which technically signals a potential bounce, but this is occurring in an oversold territory, suggesting a weak bounce at best, or a continuation of the downtrend. More importantly, on the 4H chart, Stochastic shows K=15.62 and D=35.37, a clear bearish signal as %K is below %D and both are in oversold territory, indicating strong downward momentum. The MACD on both the 1H and 4H charts is firmly in negative territory, with the MACD line below the signal line, confirming bearish momentum. The ADX values, particularly the 33.23 on the 1H and 21.06 on the 4H, suggest that a strong trend is either in place or developing, favoring the direction of the current move – which is down.
The bears are also watching the Nasdaq100's correlation with other indices. The fact that the Nasdaq 100 is down 1.16% while the Dow Jones 30 is up 0.21% and the S&P 500 is up 0.74% on the 1H chart suggests a potential underperformance within the tech sector. This could indicate specific headwinds affecting tech stocks, such as regulatory scrutiny, slowing innovation, or a rotation out of growth into value sectors. The bears believe this divergence is a precursor to a broader market correction, where the Nasdaq100, being more growth-sensitive, will lead the decline. They are targeting the key psychological level of $29,000, and then the more significant daily support at $28,511.31, viewing any price action above these levels as temporary.
Navigating the Crossroads: Scenarios and Probabilities
The current market sentiment presents a classic bull vs. bear tug-of-war, with the Nasdaq100 perched at a critical juncture. The technical indicators offer conflicting signals across different timeframes, reflecting this indecision. While the 1H charts show some oversold conditions that could prompt a short-term bounce, the broader daily and 4H trends, coupled with macroeconomic headwinds, lean towards further downside. The key will be how the market reacts to the immediate support levels. A failure to hold $29,064.43 would likely accelerate selling pressure, while a sustained bounce from this area could reignite bullish sentiment, especially if it breaks through the 1H resistance at $29,260.86.
The correlation with the DXY at 100.7 and rising oil prices further complicates the picture. If the DXY continues its ascent, it will exert downward pressure on equities. Conversely, if oil prices stabilize or fall, it could ease inflation concerns and support a risk-on environment. The market is keenly watching for any signs of a Fed pivot or a de-escalation in geopolitical tensions, which could dramatically shift the sentiment. For traders, the strategy hinges on risk management and waiting for clear confirmation. Trading within the current range might offer short-term opportunities, but a decisive break above resistance or below support will likely dictate the next major move.
Bearish Scenario: Momentum Sells Off
60% ProbabilityNeutral Scenario: Range-Bound Consolidation
25% ProbabilityBullish Scenario: Reversal and Rally
15% ProbabilityThe Verdict: Leaning Towards Caution
While the bulls can point to some short-term oversold signals and the long-term growth story of tech, the immediate technical picture and the prevailing macroeconomic environment favor the bears. The negative momentum on the 4H and daily charts, coupled with the strengthening dollar (DXY at 100.7) and rising oil prices (Brent at $83.79), creates a challenging backdrop. The Nasdaq100's current price of $29,164.86 sits precariously close to key support levels. The ADX at 33.23 on the 1H chart indicates a strong downtrend, and the RSI at 32.77 suggests further downside potential before a significant oversold bounce. The divergence with other indices like the Dow Jones 30, which shows a strong daily uptrend, might also be a warning sign of sector-specific weakness.
The bears' target of $28,511.31 on the daily chart seems increasingly plausible if the $29,064.43 support fails. This would represent a significant drawdown from current levels and validate the bearish sentiment driven by inflation fears and geopolitical uncertainty. Traders should exercise caution, looking for confirmation of a move below immediate support before considering bearish positions, or waiting for a decisive break above resistance levels like $29,260.86 for a potential bullish reversal. The market is currently pricing in a risk-off sentiment, and until that narrative shifts, the Nasdaq100 faces headwinds. Patience and disciplined risk management are paramount as the index navigates this critical juncture.
Frequently Asked Questions: Nasdaq100 Analysis
What happens if the Nasdaq100 breaks below the $29,064.43 support level?
A break below $29,064.43 would likely trigger further selling pressure, validating the bearish scenario. The next key target would be the 4H support at $28,813.77, followed by the significant daily support at $28,511.31.
Should I consider buying the Nasdaq100 at current levels of $29,164.86 given the RSI at 32.77?
Buying at current levels carries significant risk due to the negative momentum and proximity to support. While the 1H RSI is low, the 4H and daily RSI are not deeply oversold. A confirmed break above $29,260.86 resistance would be a more prudent buy signal, indicating a potential reversal.
Is the MACD histogram showing a bearish signal for the Nasdaq100 trend analysis right now?
Yes, the MACD histogram is negative on both the 1H and 4H charts, with the MACD line below the signal line. This confirms bearish momentum and suggests that the current trend is downward, favoring further price declines.
How might the rising DXY at 100.7 and oil prices affect the Nasdaq100 this week?
A stronger DXY typically puts pressure on risk assets like the Nasdaq100. Coupled with rising oil prices that fuel inflation concerns, this creates a risk-off environment. This macro backdrop suggests continued headwinds for the index unless geopolitical tensions de-escalate or Fed policy expectations shift significantly.
Track markets in real-time
AI-powered analysis, technical indicators and real-time price data.
Join Our Telegram Channel
Breaking market news, AI analysis and trading signals instantly.
Join Channel