

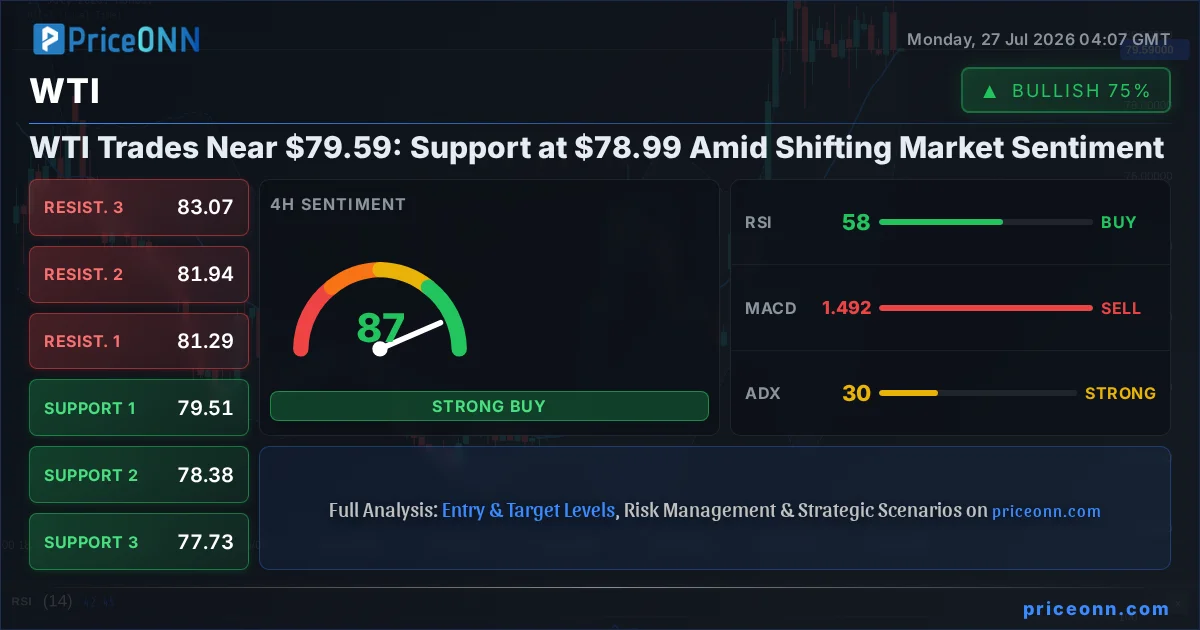
The West Texas Intermediate (WTI) crude oil benchmark is currently navigating a critical juncture, trading near the $79.59 mark. This price level represents a pivotal point, with significant support identified at $78.99. The market's sentiment is a complex interplay of technical indicators flashing mixed signals and persistent geopolitical undercurrents, particularly concerning Middle East tensions and their ripple effects on global energy supply chains.
- WTI hovers near $79.59, with key support at $78.99.
- 1H RSI at 46.91 suggests cautious momentum, while 4H RSI at 58.47 indicates a more positive outlook.
- ADX readings show a weak trend (1H: 10.18) and strong upward trend (4H: 30.49), indicating potential for a breakout.
- Geopolitical risks, including Middle East tensions and their impact on oil prices, remain a key driver.
The technical landscape for WTI crude oil presents a nuanced picture, demanding careful observation across multiple timeframes. On the 1-hour chart, the Relative Strength Index (RSI) stands at 46.91. This reading places it firmly in the neutral territory, leaning slightly towards a bearish inclination as it hovers below the 50-mark. This suggests that while selling pressure has eased, the momentum for a bullish reversal is not yet robust. The Average Directional Index (ADX) on this timeframe is a mere 10.18, signaling a very weak trend. This lack of directional conviction indicates that the market is largely range-bound or consolidating, with price action lacking strong momentum in either direction. The Stochastic Oscillator further supports this, with the K line at 28.74 and the D line at 52.74, presenting a bearish signal as %K has crossed below %D and both are in oversold territory, hinting at potential downside pressure or a continued lack of buying interest.
However, shifting focus to the 4-hour timeframe paints a potentially different, albeit still cautious, narrative. Here, the RSI climbs to 58.47, moving out of the neutral zone and into a more bullish territory. This indicates a strengthening upward momentum, suggesting that buyers might be regaining some control. The ADX on the 4-hour chart jumps significantly to 30.49, confirming a strong upward trend. This divergence in ADX readings between the 1-hour and 4-hour charts highlights the conflicting signals and the current indecision in the market. While the shorter timeframe suggests a lack of direction, the longer timeframe points towards a developing uptrend. The Stochastic Oscillator on the 4-hour chart shows K at 58.32 and D at 60.98, indicating a bearish signal as %K has crossed below %D, but both are in a strong bullish zone, suggesting that this pullback might be a temporary pause before a potential continuation.
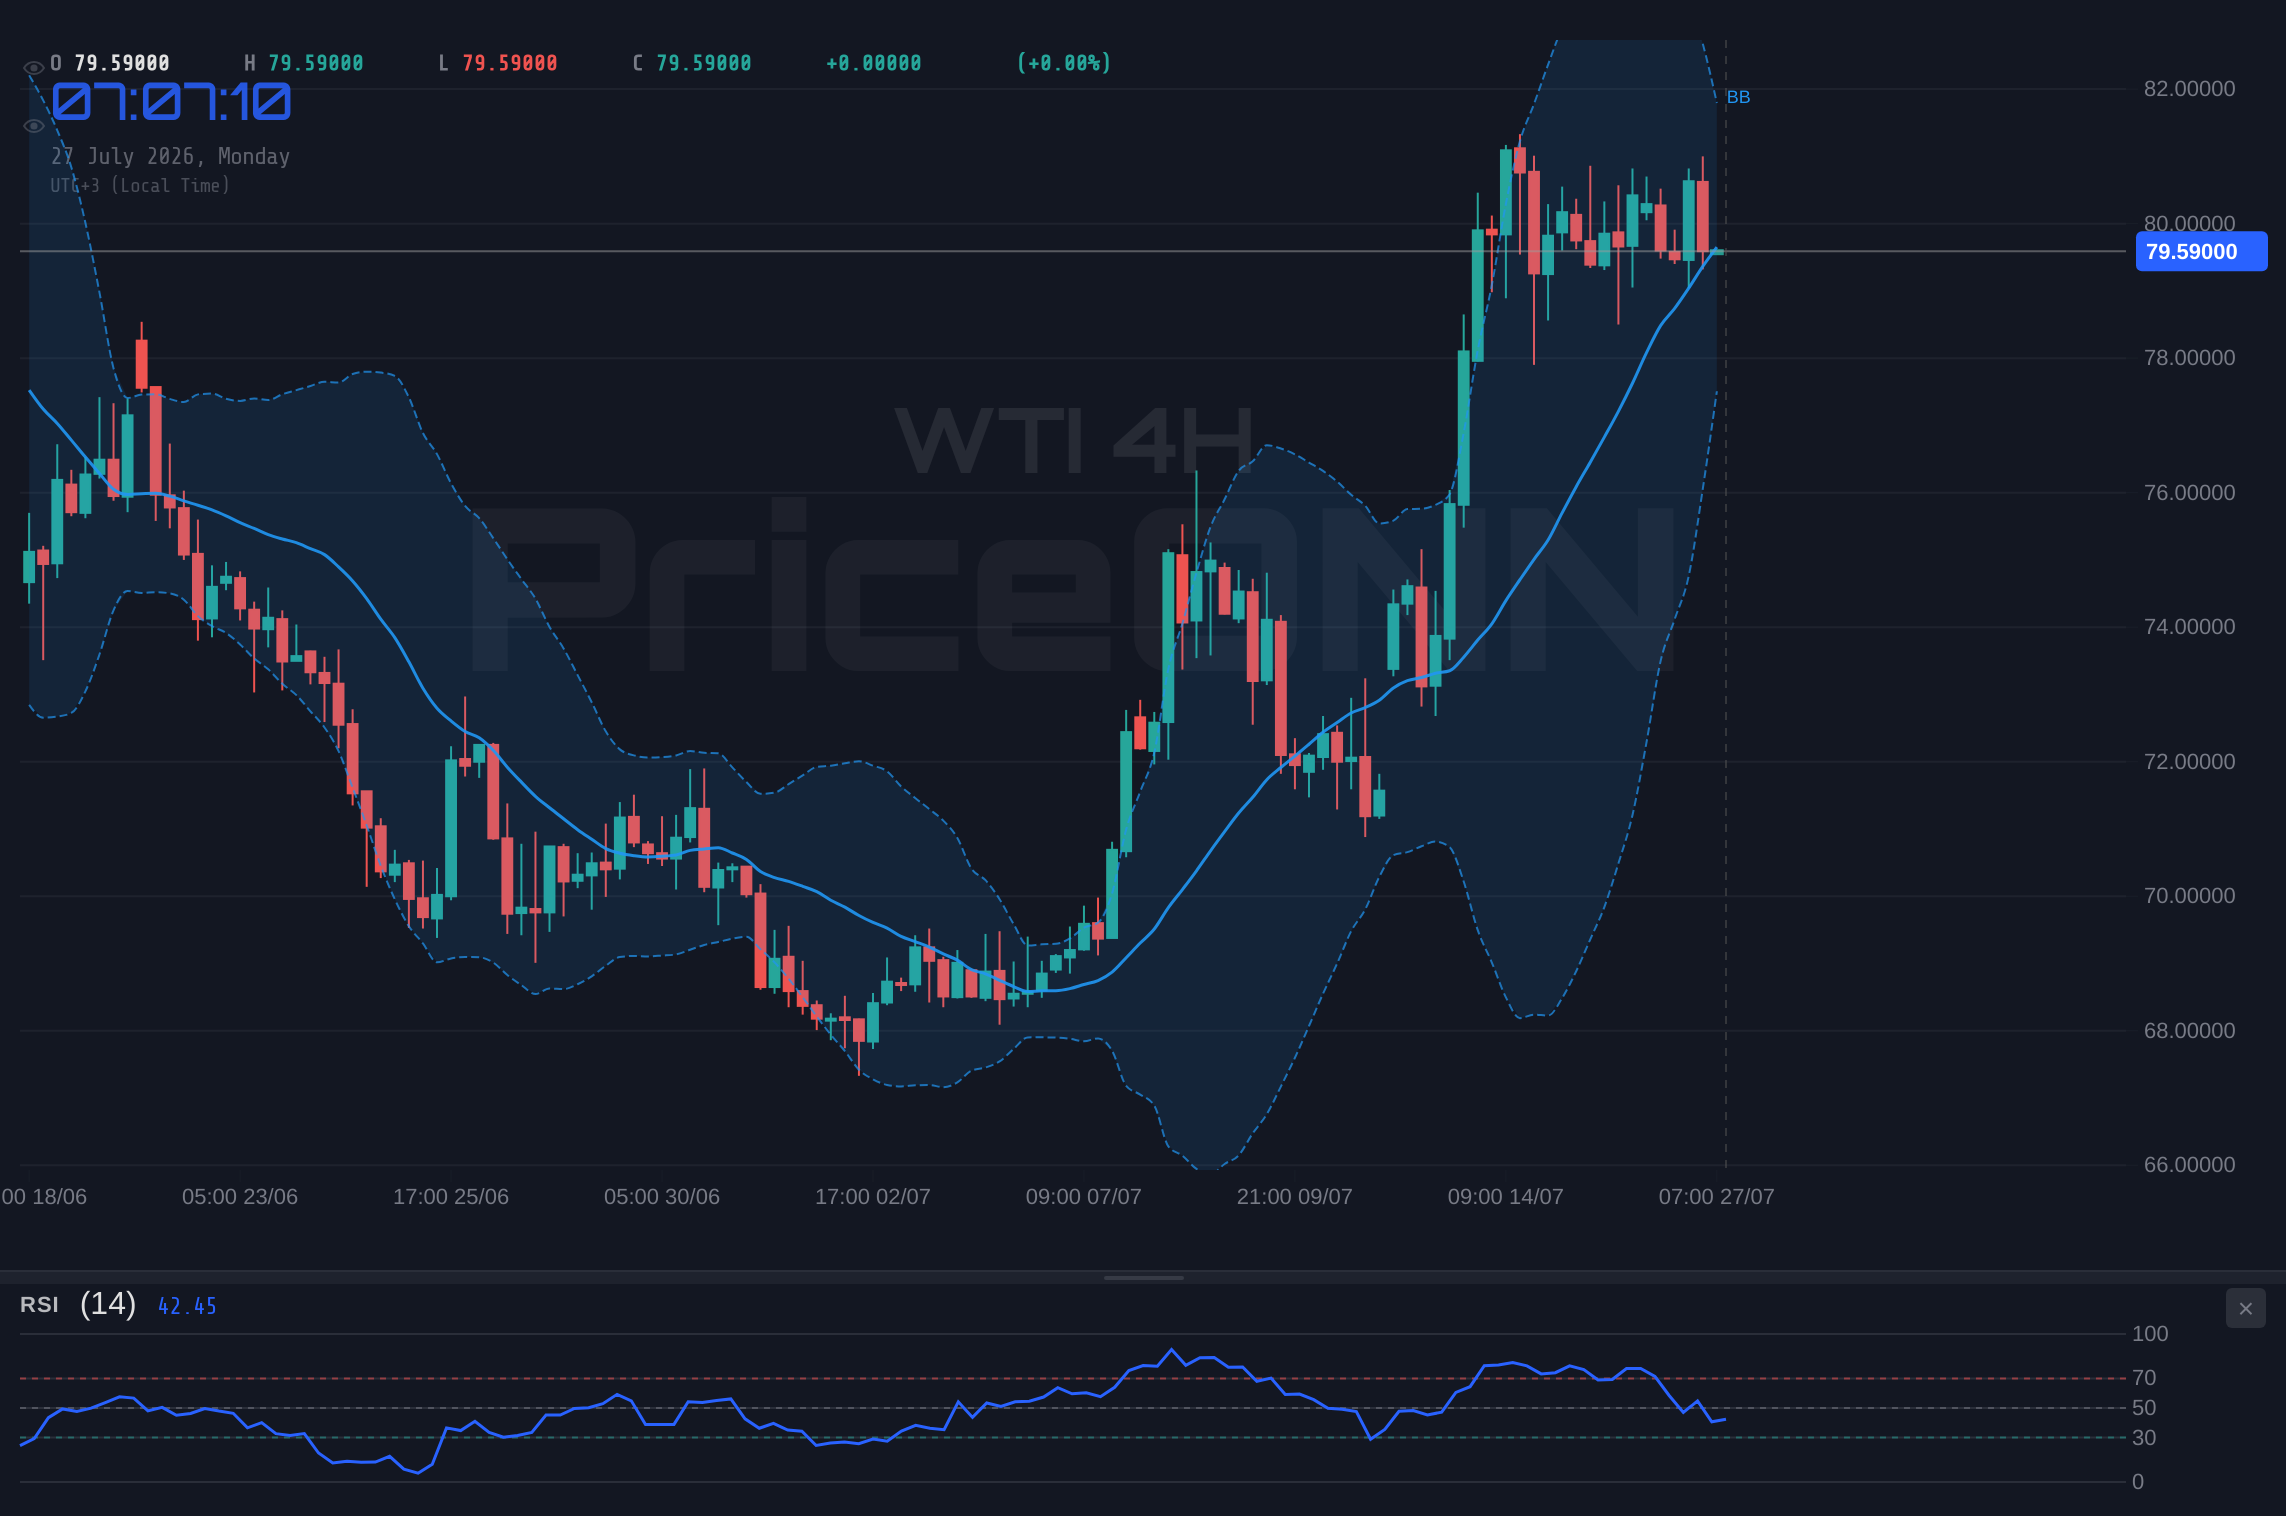
The daily chart provides a broader perspective, and for WTI crude, it currently leans towards a neutral stance with a hint of bullishness. The RSI(14) is positioned at 53.65, a classic neutral reading that suggests the market is balanced between buyers and sellers. The MACD (Moving Average Convergence Divergence) is showing positive momentum, with the MACD line above the signal line, suggesting that upward price action is supported by underlying momentum. The Bollinger Bands are positioned above the middle band, indicating an upward bias in price movement. The Stochastic Oscillator is particularly noteworthy here, with K at 89.73 and D at 76.80. This indicates an extremely overbought condition, suggesting that a pullback or consolidation is likely in the short term, despite the overall bullish momentum indicated by the MACD and RSI.
The ADX on the daily chart stands at 29.46, reinforcing the idea of a strong trend, although the direction is not definitively bearish or bullish without further context. Given the conflicting signals across different timeframes – a weak trend on the 1-hour, a strong uptrend on the 4-hour, and a strong trend with overbought conditions on the daily – traders are presented with a challenging environment. The immediate price action around $79.59 is crucial. A sustained break below the 1-hour support at $79.23 could signal a short-term pullback, potentially testing the $78.97 level. Conversely, holding the current price action and breaking through the 1-hour resistance at $79.83 could initiate a move towards higher levels, aligning with the bullish signals from the 4-hour timeframe.
The overarching narrative driving WTI's price action cannot be separated from the broader geopolitical landscape, particularly the ongoing tensions in the Middle East. Recent reports indicate that oil prices experienced a significant plunge of over 5% in early Asian trade on Monday, following news that the U.S. and Iran had halted attacks after two weeks of escalating hostilities. This dramatic price swing highlights the market's extreme sensitivity to such developments. Furthermore, U.S. airlines are grappling with soaring jet fuel costs again, a direct consequence of the renewed hostilities in the Middle East shattering the fragile calm. This situation underscores how supply chain disruptions, even perceived ones, can rapidly impact energy prices and related industries.
Standard Chartered has weighed in, suggesting that oil markets must now price in two Middle East chokepoints. This perspective implies that the market is no longer focused solely on the Strait of Hormuz but is also factoring in other potential points of disruption. Less than a month ago, analysts were warning of a looming glut of crude oil, a narrative that has now been significantly challenged by these geopolitical events. The rapid shift from a 'glut narrative' to 'supply disruption risk' underscores the volatility inherent in the oil market, driven by factors far beyond simple supply and demand fundamentals. This volatility creates both risk and opportunity for market participants, demanding constant vigilance and adaptive strategies.
In this context, the $78.99 support level for WTI becomes particularly significant. This level, along with the subsequent support at $78.63, represents a crucial floor that, if breached decisively, could signal a deeper correction. The 1-hour chart's immediate support is at $79.23, and a break below this could be the first indication of downside pressure. On the resistance side, the $79.83 level on the 1-hour chart is the immediate hurdle. A confirmed break above this, especially if sustained, could open the door for a move towards the $80.17 and $80.43 resistance levels. The 4-hour chart's resistance levels at $81.29 and $81.94 become the next significant targets if the bullish momentum indicated by that timeframe gains traction.
The interplay between the US Dollar Index (DXY) and WTI prices remains a key correlation to monitor. With the DXY currently at 100.7, showing a modest upward trend on the 1-hour and daily charts but mixed signals on the 4-hour, its influence on oil prices is complex. Generally, a strengthening dollar tends to put downward pressure on dollar-denominated commodities like WTI, as they become more expensive for holders of other currencies. However, the current geopolitical risk premium in oil prices can sometimes override this inverse correlation. If the DXY were to break higher, particularly above its 1-hour resistance at 100.73, it could add to the bearish pressure on WTI. Conversely, any significant weakening in the dollar could provide additional support for oil prices.
Looking at broader market sentiment, the S&P 500 (SP500) is trading at 6572.87, showing a strong upward move on the 1-hour and 4-hour charts, but a bearish trend on the daily timeframe. This mixed picture in equities suggests a cautious risk appetite. A decline in major stock indices often correlates with a decrease in risk appetite, which can lead investors to seek safer assets. While oil is not typically considered a safe haven, its price is heavily influenced by global economic health. If equity markets were to experience a significant downturn, it could signal weakening global demand, putting further downward pressure on WTI prices.
The Nasdaq 100 (Nasdaq) is showing a similar pattern, trading at 29164.86 with a strong bearish trend on the 1-hour and 4-hour charts, and a weaker bearish trend on the daily. This tech-heavy index's decline suggests concerns about growth and future earnings, which can translate into reduced demand for energy. The Dow Jones Industrial Average (DowJones30) at 52748.53, however, shows a more consistent bullish trend across timeframes, indicating some resilience in the broader market. This divergence between the Nasdaq and Dow Jones adds another layer of complexity to assessing overall market risk sentiment and its potential impact on WTI.
The 1-day technical signals for WTI indicate a mixed bag. The overall signal is SAT (Sell), with one BUY and seven SELL signals across the aggregated 1-hour, 4-hour, and 1-day timeframes. This predominantly bearish aggregate signal, despite the bullish indicators on the 4-hour chart, suggests that the prevailing sentiment leans towards caution or a potential downside move. The strong ADX on the 4-hour chart (30.49) and daily chart (29.46) does indicate that a trend is present, but the conflicting signals from other indicators and timeframes imply a lack of clear direction or a potential for a trend reversal. Traders must remain acutely aware of the $78.99 support level, as a break below it could invalidate any bullish thesis derived from the 4-hour timeframe.
Considering the trade recommendation decision, which leans towards a 'FULL_TRADE_PLAN' with a '4/8' score, the emphasis is on a strong trend detected by the ADX (30.49 on 4H) and partial indicator alignment. However, the Stochastic Oscillator is not in extreme territory, and the mixed signals across timeframes necessitate a cautious approach. This aligns with the need for clear scenario planning. The current environment, marked by geopolitical uncertainties and conflicting technical signals, demands a robust risk management strategy. The potential for price swings, driven by news headlines from the Middle East or shifts in economic outlook, means that strict adherence to stop-loss levels and target projections is paramount.
The recent news flow, particularly the reports of a 5% plunge in oil prices following the U.S. and Iran halting attacks, serves as a stark reminder of the market's volatility. While the immediate de-escalation might suggest a temporary relief, the underlying geopolitical tensions remain. Argentina's soaring oil production, breaking new records in Vaca Muerta, offers a counterpoint of fundamental supply growth, but its impact is likely localized compared to global geopolitical events. The tightening monetary policy in Singapore due to rising oil prices also signals the broader inflationary concerns that elevated energy costs can exacerbate, potentially leading to further central bank actions that could impact global demand.
The economic calendar, while not explicitly detailed here with upcoming events, always plays a crucial role. Upcoming central bank meetings, particularly from the Fed, are closely watched for any hints on future monetary policy, which directly influences economic growth and, consequently, energy demand. With the Fed potentially remaining on hold but maintaining a 'modest tightening' stance, as suggested by forward-looking economic reports, the market will be dissecting every statement for clues on future rate hikes or cuts. Such macro-economic drivers, coupled with the ever-present geopolitical risks, create a complex environment for WTI trading.
The interplay between technicals and fundamentals is where the real trading edge lies. While the ADX on the 4-hour chart suggests a strong trend, the mixed signals from RSI and Stochastic across timeframes, coupled with the overriding influence of geopolitical news, mean that a breakout above resistance or breakdown below support needs to be confirmed by sustained price action and volume. The $79.59 level is currently a battleground, and the outcome will likely be dictated by a combination of technical conviction and unfolding geopolitical events. Patience, strict risk management, and a keen eye on the news flow will be essential for navigating this volatile market.
The critical support at $78.99 is more than just a number; it represents a level where demand has historically stepped in, potentially halting further declines. A failure to hold this level could trigger significant stop-loss orders, accelerating the move lower towards $78.63 and beyond. Conversely, if WTI can consolidate above $79.59 and then break through the $79.83 resistance, it would signal a shift in short-term momentum, potentially leading to a test of higher price points. The 4-hour chart's bullish bias, supported by the strong ADX, suggests that the upside has more potential if key resistance levels are overcome.
Ultimately, the WTI market is at a crossroads, influenced by both technical signals and a volatile geopolitical backdrop. The current price near $79.59, with support at $78.99, demands careful observation. The conflicting indicators across timeframes suggest that a clear trend is yet to be firmly established, making risk management paramount. The potential for sharp moves, driven by Middle East developments or central bank policies, means that traders should be prepared for volatility. The market is pricing in a complex set of risks and rewards, and the immediate future will likely hinge on whether technical levels hold or geopolitical events dictate a new price trajectory.
The $78.99 support level is critical. If WTI breaks below this level, it could signal a significant bearish move, potentially targeting $78.63. The ADX on the 4-hour chart at 30.49 indicates a strong trend, but the conflicting RSI and Stochastic readings across timeframes suggest caution. The geopolitical situation in the Middle East remains a primary driver, capable of causing rapid price swings. Traders should monitor upcoming economic data and central bank commentary for further clues on global demand and potential policy shifts.
The bullish scenario hinges on WTI holding above $78.99 and breaking through immediate resistance. The 4-hour chart's upward bias, supported by a strong ADX, suggests this is a viable, though not guaranteed, path. The neutral scenario anticipates continued consolidation as conflicting signals resolve. The bearish scenario becomes more probable if $78.99 support fails, potentially exacerbated by negative geopolitical news or a strengthening dollar.
Here are the key scenarios to watch:
Bearish Scenario: Breakdown Below Support
60% ProbabilityNeutral Scenario: Consolidation Around $79.59
25% ProbabilityBullish Scenario: Breakout Above Resistance
15% ProbabilityFrequently Asked Questions: WTI Analysis
What happens if WTI breaks below the $78.99 support level?
A decisive break below $78.99 would invalidate any immediate bullish outlook and likely trigger further selling pressure. This could lead to a test of the next support at $78.63, and potentially extend towards the $78.38 level on the 4-hour chart, especially if geopolitical tensions escalate or risk-off sentiment prevails.
Is the RSI at 46.91 on the 1H chart a sell signal for WTI at $79.59?
An RSI of 46.91 on the 1-hour chart is considered neutral territory, leaning slightly bearish as it is below 50. While not an outright sell signal, it suggests that bullish momentum is currently weak and that a further dip towards immediate support at $79.23 is possible before any significant upward move can be sustained.
How will the strong ADX of 30.49 on the 4H chart influence WTI trading near $79.59?
The ADX at 30.49 on the 4-hour chart indicates a strong trend is in play, likely upwards given other indicators. This suggests that if WTI can overcome immediate resistance, the trend has the strength to continue. However, traders should be cautious as the 1-hour ADX is very weak (10.18), implying potential for choppy price action until a clearer direction emerges.
How might Middle East tensions impact WTI prices around the $79.59 level this week?
Escalating Middle East tensions can inject significant volatility and a risk premium into oil prices, potentially pushing WTI above resistance levels despite weaker technical signals. Conversely, de-escalation can lead to sharp sell-offs, as seen recently, putting pressure on support levels like $78.99. Traders must remain vigilant for geopolitical headlines that could override technical analysis.
Track markets in real-time
AI-powered analysis, technical indicators and real-time price data.
Join Our Telegram Channel
Breaking market news, AI analysis and trading signals instantly.
Join Channel