

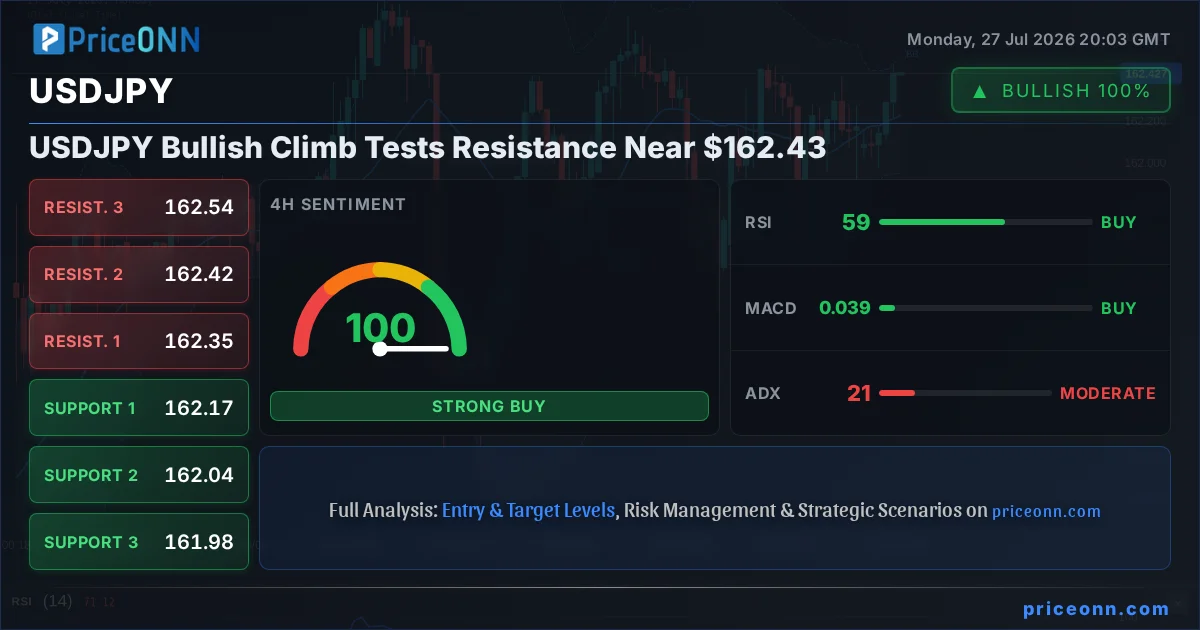
The yen is feeling the heat, and frankly, the $162.43 level for USDJPY is where the real battle lines are being drawn right now. We're seeing a bullish climb, as the data suggests, but the resistance is palpable. This isn't just about a few points; it's about whether the momentum can carry through or if we're headed for a pullback. Having tracked USDJPY through its recent swings, I can tell you this particular juncture demands close attention.
- USDJPY faces resistance near $162.43, with the 1-hour chart showing a neutral trend (ADX 19.33).
- The Daily chart signals a potential bullish continuation with RSI at 60.52 and Stochastic at 78.93, but MACD shows negative momentum.
- Key support levels are identified at $161.90, $161.63, and $161.38, while resistance looms at $162.43, $162.68, and $162.95.
- The DXY is trading at 100.7, potentially adding pressure on USDJPY if it continues to strengthen.
This dance around the $162.43 mark for USDJPY is more than just a technical blip; it’s a critical test of recent bullish sentiment. The 1-hour chart paints a picture of a neutral trend, with an ADX reading of 19.33 suggesting that any upward move might lack sustained conviction. However, the daily timeframe offers a more optimistic, albeit cautious, outlook. An RSI of 60.52 indicates a leaning towards bullish momentum, and the Stochastic oscillator, with K at 78.93, is signaling further upside potential. Yet, the MACD on the daily chart is still showing negative momentum, hovering below its signal line. This divergence across timeframes is precisely what creates the tension we're seeing: bulls are pushing, but bears are not yet completely out of the fight. This creates a volatile environment where the next move could be significant, and traders need to be acutely aware of the conflicting signals.
Navigating the Technical Landscape: A Tale of Two Timeframes
Looking closer at the intraday action, the 1-hour chart for USDJPY reveals a market that's cautiously optimistic but lacking strong directional conviction. The ADX at 19.33 is firmly in the 'weak trend' territory, meaning the recent upward push might be more of a ripple than a wave. This often leads to choppy price action, where quick reversals can catch traders off guard. The Stochastic oscillator, however, is showing a potential for a bounce, with %K crossing above %D, but this is happening in a neutral zone, not an oversold one, which tempers the enthusiasm. The Bollinger Bands are also hugging the middle band, indicating a lack of strong directional pressure. It’s a waiting game on this timeframe, with price action needing to decisively break above resistance or decisively fall back to support to signal a clearer path forward.
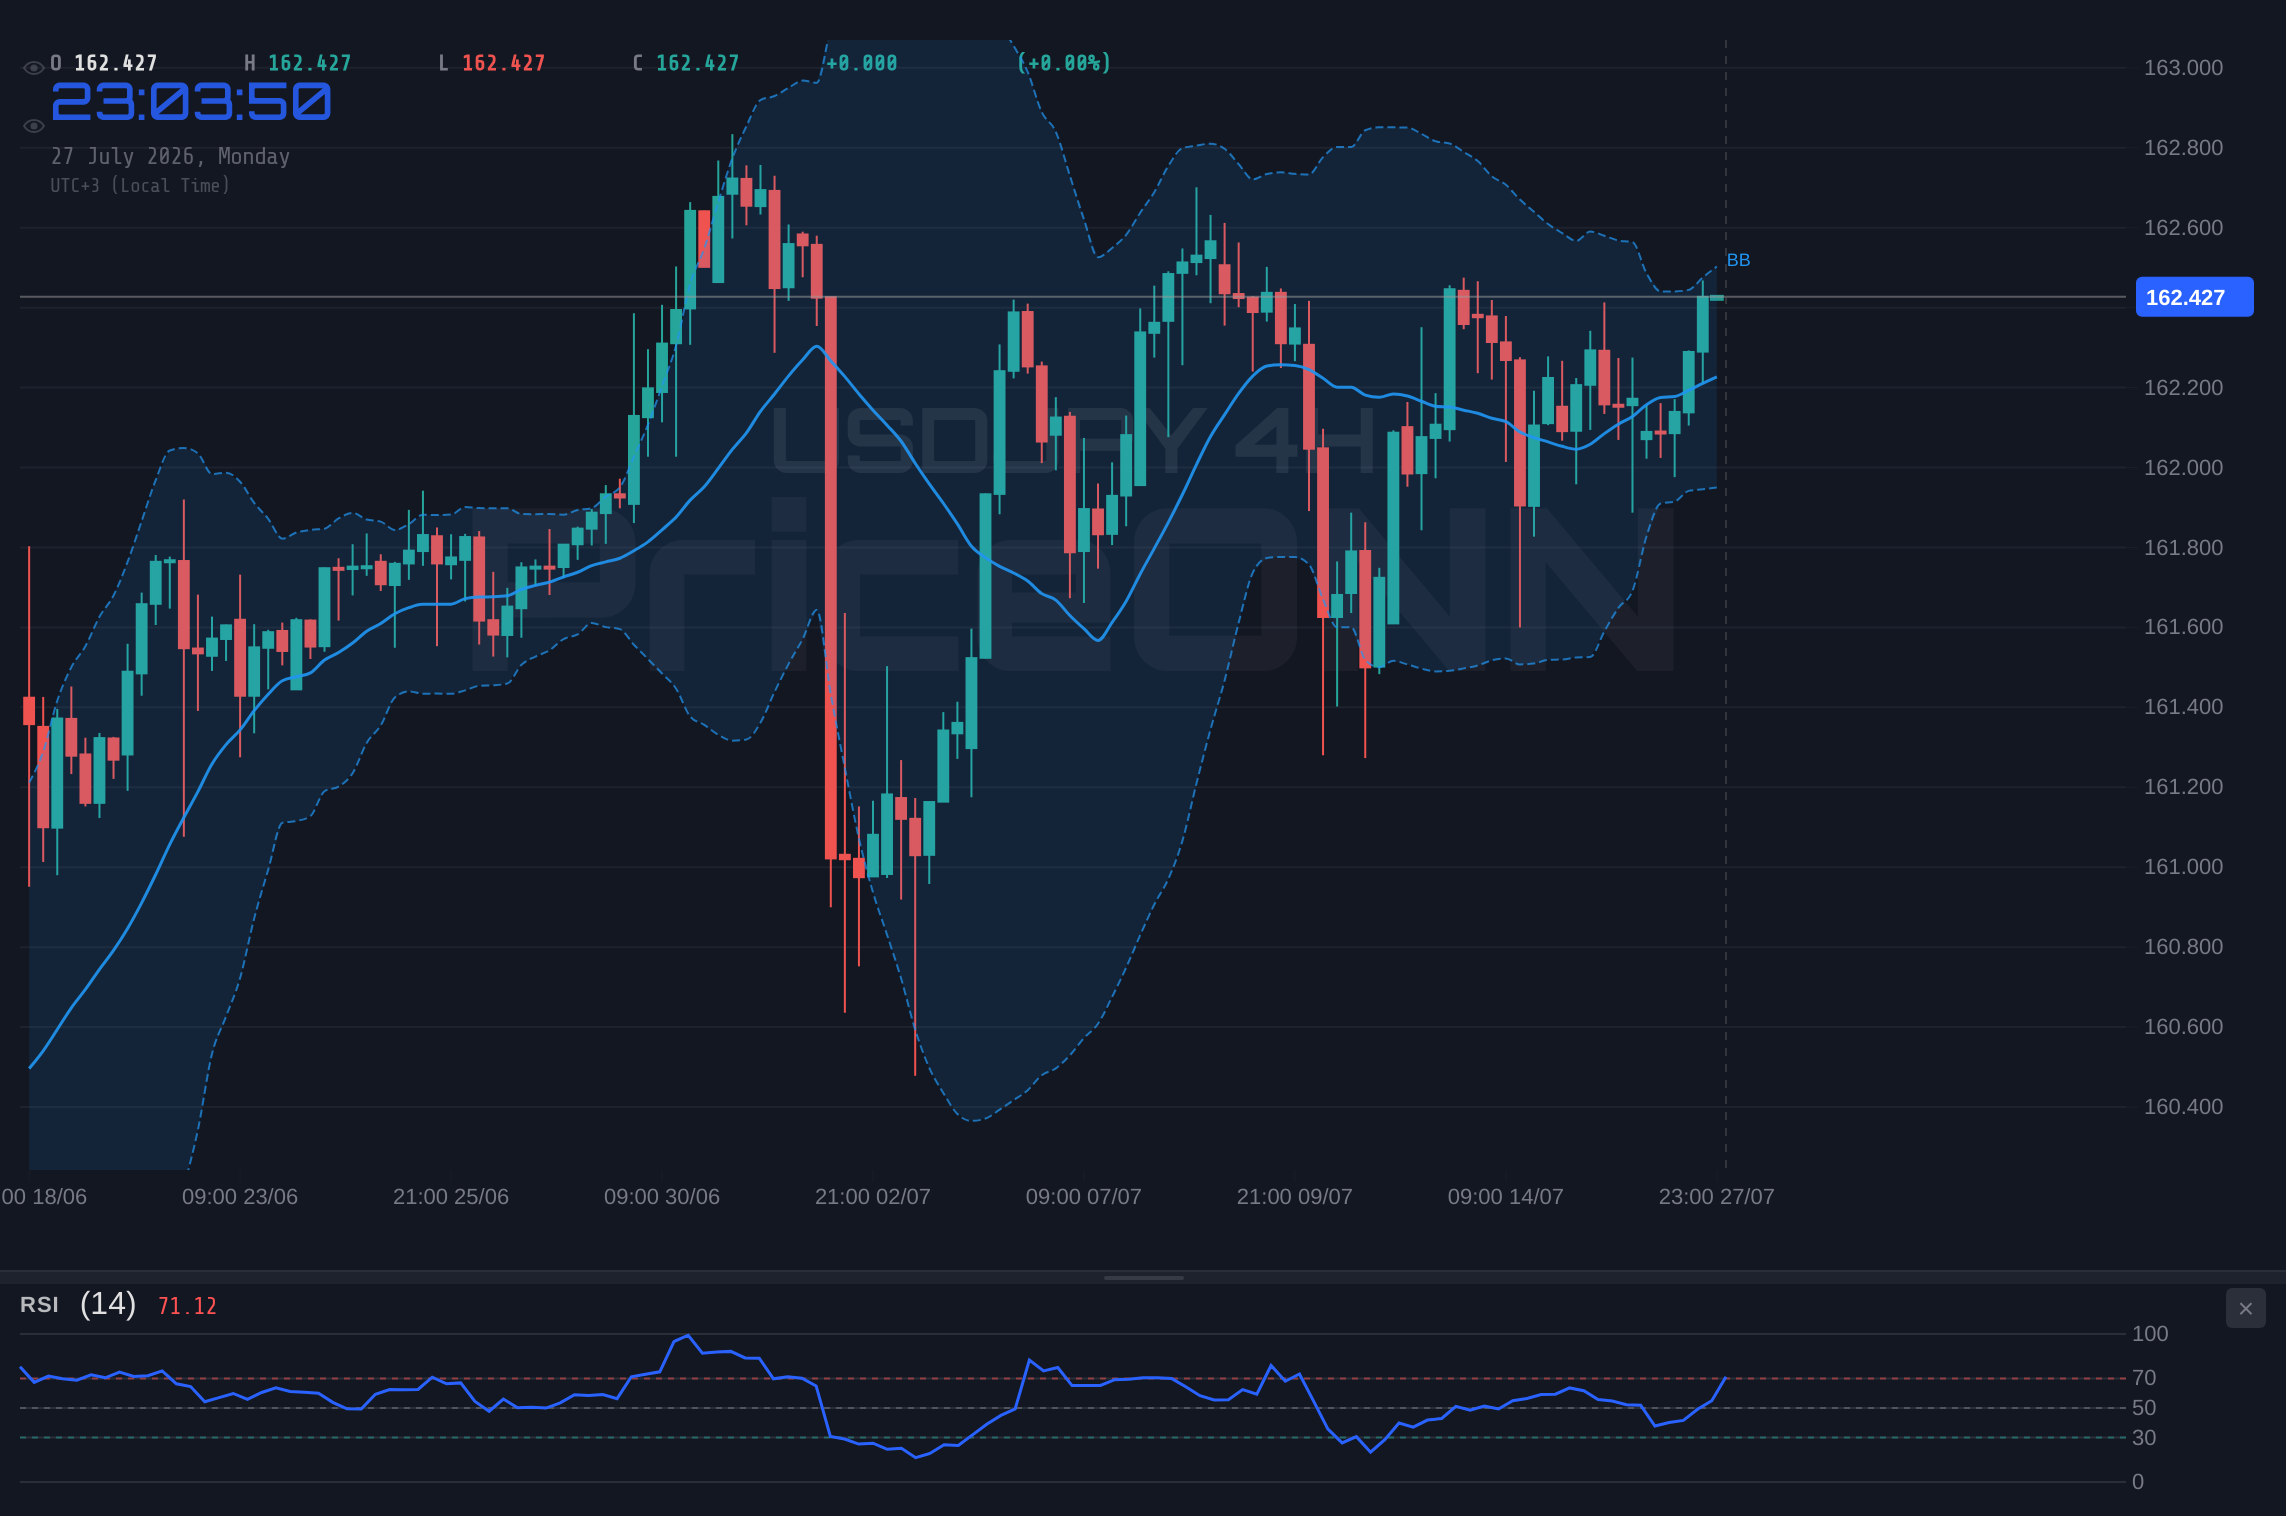
Now, let’s zoom out to the 4-hour chart, and the picture starts to shift. Here, the trend is identified as bullish with a strength of 95%, a significant upgrade from the 1-hour view. The RSI at 58.89 is comfortably in neutral territory, suggesting room for further upside before hitting overbought conditions. The MACD is positive and above its signal line, reinforcing the bullish sentiment. Even the Stochastic, while showing a %K below %D, is deep in oversold territory on some other pairs, here it is in the mid-range, suggesting potential. The ADX at 20.71, while still moderate, indicates a slightly stronger trend than the 1-hour chart. This multi-timeframe analysis is crucial; what looks indecisive on a short timeframe can reveal a more robust trend when viewed on a larger scale. This is where traders start to see the potential for a sustained move, but confirmation is still key.
The daily chart, however, presents the most compelling case for a bullish outlook, though not without its caveats. The trend is classified as bullish with 79% strength. The RSI at 60.52 is in a healthy zone, indicating upward momentum without being excessively overbought. The MACD is positive and above its signal line, a classic bullish signal. The Stochastic oscillator, with %K at 78.93 and %D at 75.09, is showing a strong bullish divergence and is in the upper half of its range, signaling potential for further gains. The ADX at 18.76 still points to a relatively weak trend overall, but combined with the other indicators, it suggests that the underlying sentiment is shifting upwards. The key here is that while individual indicators might present conflicting nuances, the confluence of daily signals leans bullish, suggesting that the current trading range might be a precursor to a more significant upward move. The $162.43 resistance level is a critical hurdle, but the daily setup suggests it could be challenged.
The divergence between the shorter-term (1H) neutral/cautious signals and the longer-term (4H, 1D) bullish signals creates a high degree of uncertainty. A close below the $161.90 support on the daily chart could invalidate the bullish thesis and trigger a sharp move lower.
The Dollar's Shadow: DXY and its Influence
No analysis of USDJPY is complete without casting an eye on its most significant counterpart: the US Dollar Index (DXY). The DXY is currently trading at 100.7, showing a mixed picture across different timeframes. The 1-hour chart indicates a neutral trend with a positive momentum signal, while the 4-hour chart flips to negative momentum and a falling RSI. The daily chart, however, shows the DXY hovering around the middle Bollinger Band, with a Stochastic showing a potential for a dip. This indecisiveness in the dollar itself adds another layer of complexity to USDJPY's trajectory. A strengthening dollar, as indicated by the DXY's overall upward bias on the 1-hour chart, would typically exert upward pressure on USDJPY. Conversely, any significant weakness in the dollar could provide a counter-balance, potentially capping gains or even triggering a pullback in USDJPY, despite the bullish leanings on its daily chart.
The correlation between USDJPY and DXY is usually quite strong, often moving in the same direction. When the dollar index strengthens, the yen typically weakens against it. Given the DXY is currently trading at 100.7, which is above its 4-hour middle band and showing some upward momentum on the 1-hour chart, this provides a fundamental tailwind for USDJPY. However, the mixed signals across DXY's own timeframes mean this support might not be unwavering. If the DXY were to decisively break below its key support levels, say around 100.42, it would likely drag USDJPY lower with it, regardless of the yen's own specific technical setup. Traders are therefore watching both USDJPY and DXY very closely; a confirmation of strength in one often validates the other.
Furthermore, the broader market sentiment, as reflected by indices like the SP500 and Nasdaq, plays a crucial role. The SP500 is showing a bullish trend on the 1-hour and 4-hour charts, albeit with RSI in overbought territory on the 1-hour. The Nasdaq, however, is showing a bearish trend across multiple timeframes, with RSI in the oversold zone on the 1-hour and 4-hour charts. This dichotomy in equity markets - strength in the broader market but weakness in tech-heavy indices - suggests a complex risk appetite scenario. Generally, a risk-off environment favors safe-haven assets, which can sometimes include the yen. However, the current strong bullish trend in USDJPY, driven by interest rate differentials and perhaps yen weakness policies, seems to be overriding typical risk-off dynamics. This is a critical point: the yen’s safe-haven status might be temporarily sidelined by its status as a funding currency in carry trades, especially when USD strength is the dominant theme.
The divergence between Nasdaq's bearish trend and SP500's bullish trend highlights a sector rotation or a 'growth vs. value' dynamic. For USDJPY, the key is whether the US dollar strength driving it higher can persist even if tech stocks continue to falter. This suggests that the interest rate differential narrative is currently more powerful than the general risk sentiment.
Economic Undercurrents and Geopolitical Whispers
While the charts provide a roadmap, the underlying economic currents and geopolitical whispers are the engine driving the price. Recent news indicates that tensions in the Middle East might be easing, with reports of a US-Iran truce potentially cooling oil prices. This is significant because lower oil prices can reduce inflation expectations, potentially influencing central bank policy. For instance, the ECB's Kazimir has noted that more rate hikes might be needed if oil shocks persist. A cooling in energy prices could, in theory, lessen the urgency for aggressive tightening from global central banks, which might impact the dollar's strength. However, the market seems to be pricing in a resilient US dollar regardless, possibly due to the Fed's hawkish bias, which remains a dominant theme.
The recent inflation data from New Zealand showed a significant acceleration, with the CPI rising 1.5% in the second quarter. While this is specific to NZD, it underscores the persistent inflationary pressures globally. This reinforces the narrative that central banks, particularly the Federal Reserve, may need to maintain a higher-for-longer stance on interest rates. Higher US interest rates make dollar-denominated assets more attractive, thereby strengthening the dollar and, consequently, USDJPY. The fact that USDJPY is pushing towards 164, its lowest level in around 40 years against the dollar, speaks volumes about the powerful interest rate differential at play. This differential seems to be the primary driver, overshadowing other factors like risk sentiment or even yen's traditional safe-haven appeal.
The Monetary Authority of Singapore (MAS) has also tightened monetary policy, managing the Singapore dollar exchange rate against a basket of currencies to combat rising inflation. This global trend of tightening, even in economies that might not seem directly linked, shows the pervasive nature of inflationary concerns. For USDJPY, the focus remains squarely on the US Federal Reserve. With the Fed's meeting on July 29th looming, market participants are dissecting every piece of data for clues on future policy. Any indication of continued hawkishness from the Fed would likely solidify the upward trajectory for USDJPY, potentially pushing it towards new highs. Conversely, any hint of a dovish pivot, however unlikely it seems now, could trigger a sharp correction.
The complexity arises from the interplay of these factors. While easing geopolitical tensions might reduce the demand for safe-haven assets, the persistent inflationary pressures and the resulting monetary policy divergence between the US and Japan continue to fuel USDJPY's ascent. The Bank of Japan (BOJ) has maintained its ultra-loose monetary policy, creating a stark contrast with the Fed's tightening stance. This interest rate differential is a powerful catalyst for currency pairs like USDJPY, and as long as it persists, the path of least resistance appears to be upwards. However, the market is forward-looking. If traders anticipate a shift in BOJ policy or a change in Fed rhetoric, the current trend could reverse rapidly.
Trade Scenarios: Charting the Potential Paths Forward
Bearish Scenario: Yen Reclaims Some Ground
25% ProbabilityNeutral Scenario: Range-Bound Consolidation
40% ProbabilityBullish Scenario: Resistance Breakout
35% ProbabilityThe Bottom Line: What Traders Should Watch Next
So, where does this leave us? The USDJPY is at a critical juncture, caught between the short-term indecision on the 1-hour chart and the more compelling bullish signals on the daily timeframe. The $162.43 resistance level is the immediate battleground. A failure to break decisively above this could see a retracement towards the support levels around $161.90. However, if the bullish momentum from the daily chart can overcome the intraday chop, we could see a push towards $162.68 and potentially higher. The overarching influence of the US dollar, bolstered by interest rate differentials and Fed policy expectations, remains the primary bullish driver.
For traders, the immediate focus should be on price action around the $162.43 resistance. A clean break and hold above this level, confirmed by higher volume and sustained intraday momentum, would signal a continuation of the bullish trend. Conversely, a rejection from this level, especially if accompanied by a strengthening DXY or negative news flow, could lead to a swift move lower. The confluence of technical indicators on the daily chart, particularly the RSI and Stochastic, suggests that there is still room for upside, but the conflicting MACD signal and the weak ADX reading warrant caution. Patience is paramount here; waiting for a clear breakout or breakdown scenario to fully materialize will be key to managing risk effectively in this volatile pair.
The current setup demands a disciplined approach. The market is presenting conflicting signals across different timeframes, making it essential to rely on clear entry and exit criteria. The probability leans towards a potential bullish continuation given the daily chart's strength, but the short-term weakness and the critical resistance level mean that a bearish scenario cannot be discounted. Ultimately, the direction will be dictated by how price interacts with these key levels and whether the underlying macroeconomic drivers, particularly Fed policy expectations, continue to support a stronger dollar against the yen. The $162.43 level is not just a price; it's a decision point.
Frequently Asked Questions: USDJPY Analysis
What happens if USDJPY breaks decisively above the $162.52 resistance level?
A clear break above $162.52 on a 4-hour chart, confirmed by bullish momentum, would likely trigger a move towards the next resistance levels. Target 1 would be $162.68, followed by $162.95, aligning with the daily chart's bullish potential.
Should I consider buying USDJPY at current levels near $162.43, given the mixed signals?
Buying at current levels carries risk due to the immediate resistance at $162.43 and conflicting 1-hour signals. A more prudent approach would be to wait for confirmation: either a break above $162.52 with bullish momentum or a confirmed bounce from support around $161.90.
Is the RSI at 60.52 on the daily chart a strong buy signal for USDJPY?
An RSI of 60.52 is considered bullish but not yet in overbought territory. It indicates upward momentum but requires confirmation from other indicators like MACD and Stochastic, which show mixed signals. It suggests room for growth but isn't a standalone buy signal.
How will the upcoming Fed meeting affect USDJPY if it maintains a hawkish stance?
A hawkish Fed stance would likely strengthen the US dollar further, creating upward pressure on USDJPY. This could help it break through the $162.43 resistance and target higher levels like $162.68 and $162.95, reinforcing the interest rate differential narrative.
The market is a constant cycle of opportunity and risk. While the current technical picture for USDJPY presents a complex set of signals, the underlying bullish sentiment on the daily chart, supported by the dollar's fundamental strength, offers a hopeful outlook for those prepared to navigate the volatility. Patience and discipline in waiting for clear setups will be rewarded.
Track markets in real-time
AI-powered analysis, technical indicators and real-time price data.
Join Our Telegram Channel
Breaking market news, AI analysis and trading signals instantly.
Join Channel