

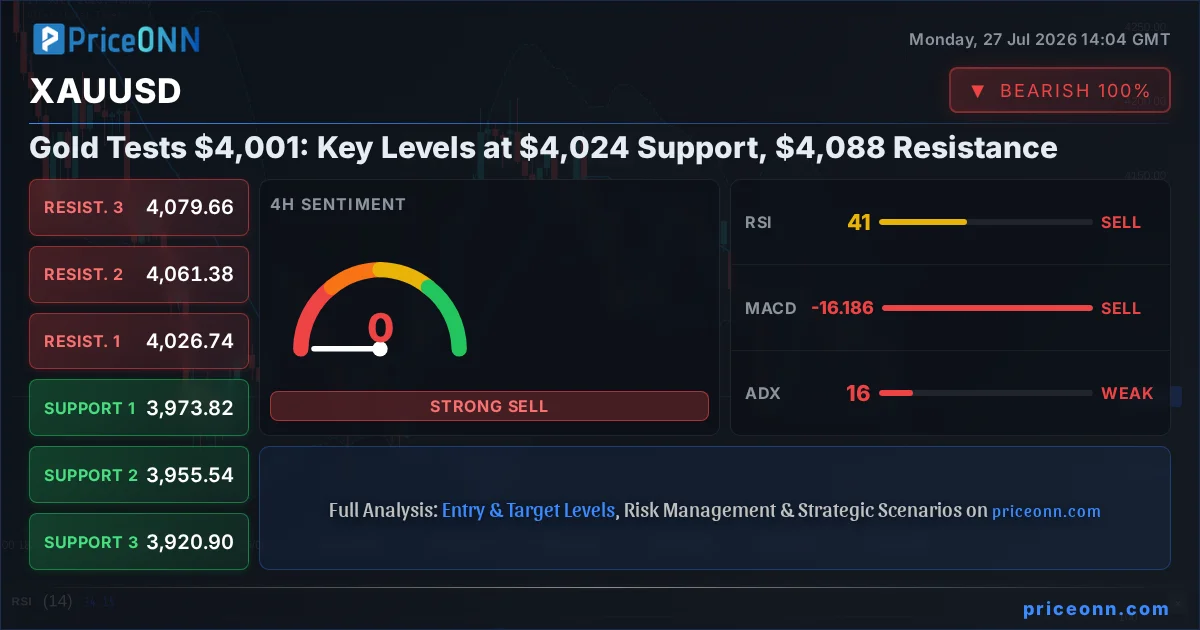
Gold just did something the bulls have been waiting months for, but the market's reaction tells a different story. The precious metal has finally dipped below the critical $4,001.21 mark, a level that has acted as a psychological and technical pivot point for weeks. This move isn't just a minor fluctuation; it’s a signal that the underlying dynamics might be shifting, and traders need to pay close attention to the next few hours and days. The data from the 1-hour chart shows a neutral trend with a potential for downside, while the 4-hour and daily charts are firmly in bearish territory, painting a complex picture that demands a nuanced approach. The current price of $4,001.21 is the focal point, but what happens next hinges on the battle between support at $3,991.8 and resistance at $4,019.21 on the hourly, with broader implications from the daily levels at $4,024.67 and $4,088.69.
- XAUUSD trading at $4,001.21 as bears push below a key psychological level.
- Critical support is eyed at $3,991.8 (1H) and $4,024.67 (1D), while resistance looms at $4,019.21 (1H) and $4,088.69 (1D).
- RSI at 37.81 (1H) and 38.86 (1D) indicates bearish momentum, though Stochastic shows short-term buy signals.
- ADX readings (20.26 on 1H, 39.16 on 1D) suggest a weakening trend on the hourly but a strong downtrend on the daily.
- Correlation with a rising DXY at 100.70 is putting pressure on gold prices.
The narrative around gold has been one of anticipation, with many expecting a significant bullish move driven by inflation concerns and geopolitical uncertainty. However, the price action tells a different story. The daily chart paints a grim picture for the bulls, showing a strong downtrend with an ADX of 39.16. This isn't just a minor pullback; it's a sustained move where sellers are clearly in control. The RSI at 38.86 reinforces this, indicating a lack of buying pressure and potential for further downside. Despite this, the 1-hour chart offers a glimmer of hope for short-term traders, with a Stochastic crossover suggesting a potential bounce. This divergence across timeframes is precisely where the opportunity lies for those who can navigate the chop. The key is to understand which timeframe's signals are currently dominating the price action and what conditions need to be met for a more sustained move.
Let's dive into the technicals. On the 1-hour chart, the trend is technically neutral, but the strength is only 50%. This means we're in a choppy, indecisive phase, which is often more dangerous than a clear trend. Support sits at $3,991.8, $3,976.78, and $3,964.39. Resistance is found at $4,019.21, $4,031.6, and $4,046.62. The RSI at 37.81 is hovering in neutral territory but leaning bearish, showing that sellers have had the upper hand recently. MACD is showing negative momentum, with the MACD line below the signal line, further supporting a bearish outlook on this short timeframe. Bollinger Bands are also below the middle band, indicating downward pressure. However, the Stochastic indicator is flashing a bullish signal with %K (40.52) above %D (37.27). This is the conflict we need to watch. A strong ADX of 20.26 suggests a moderate downtrend, but the conflicting Stochastic signal means we can't rely on this alone for a clear directional trade yet. This is the 'watch zone' where patience is key.
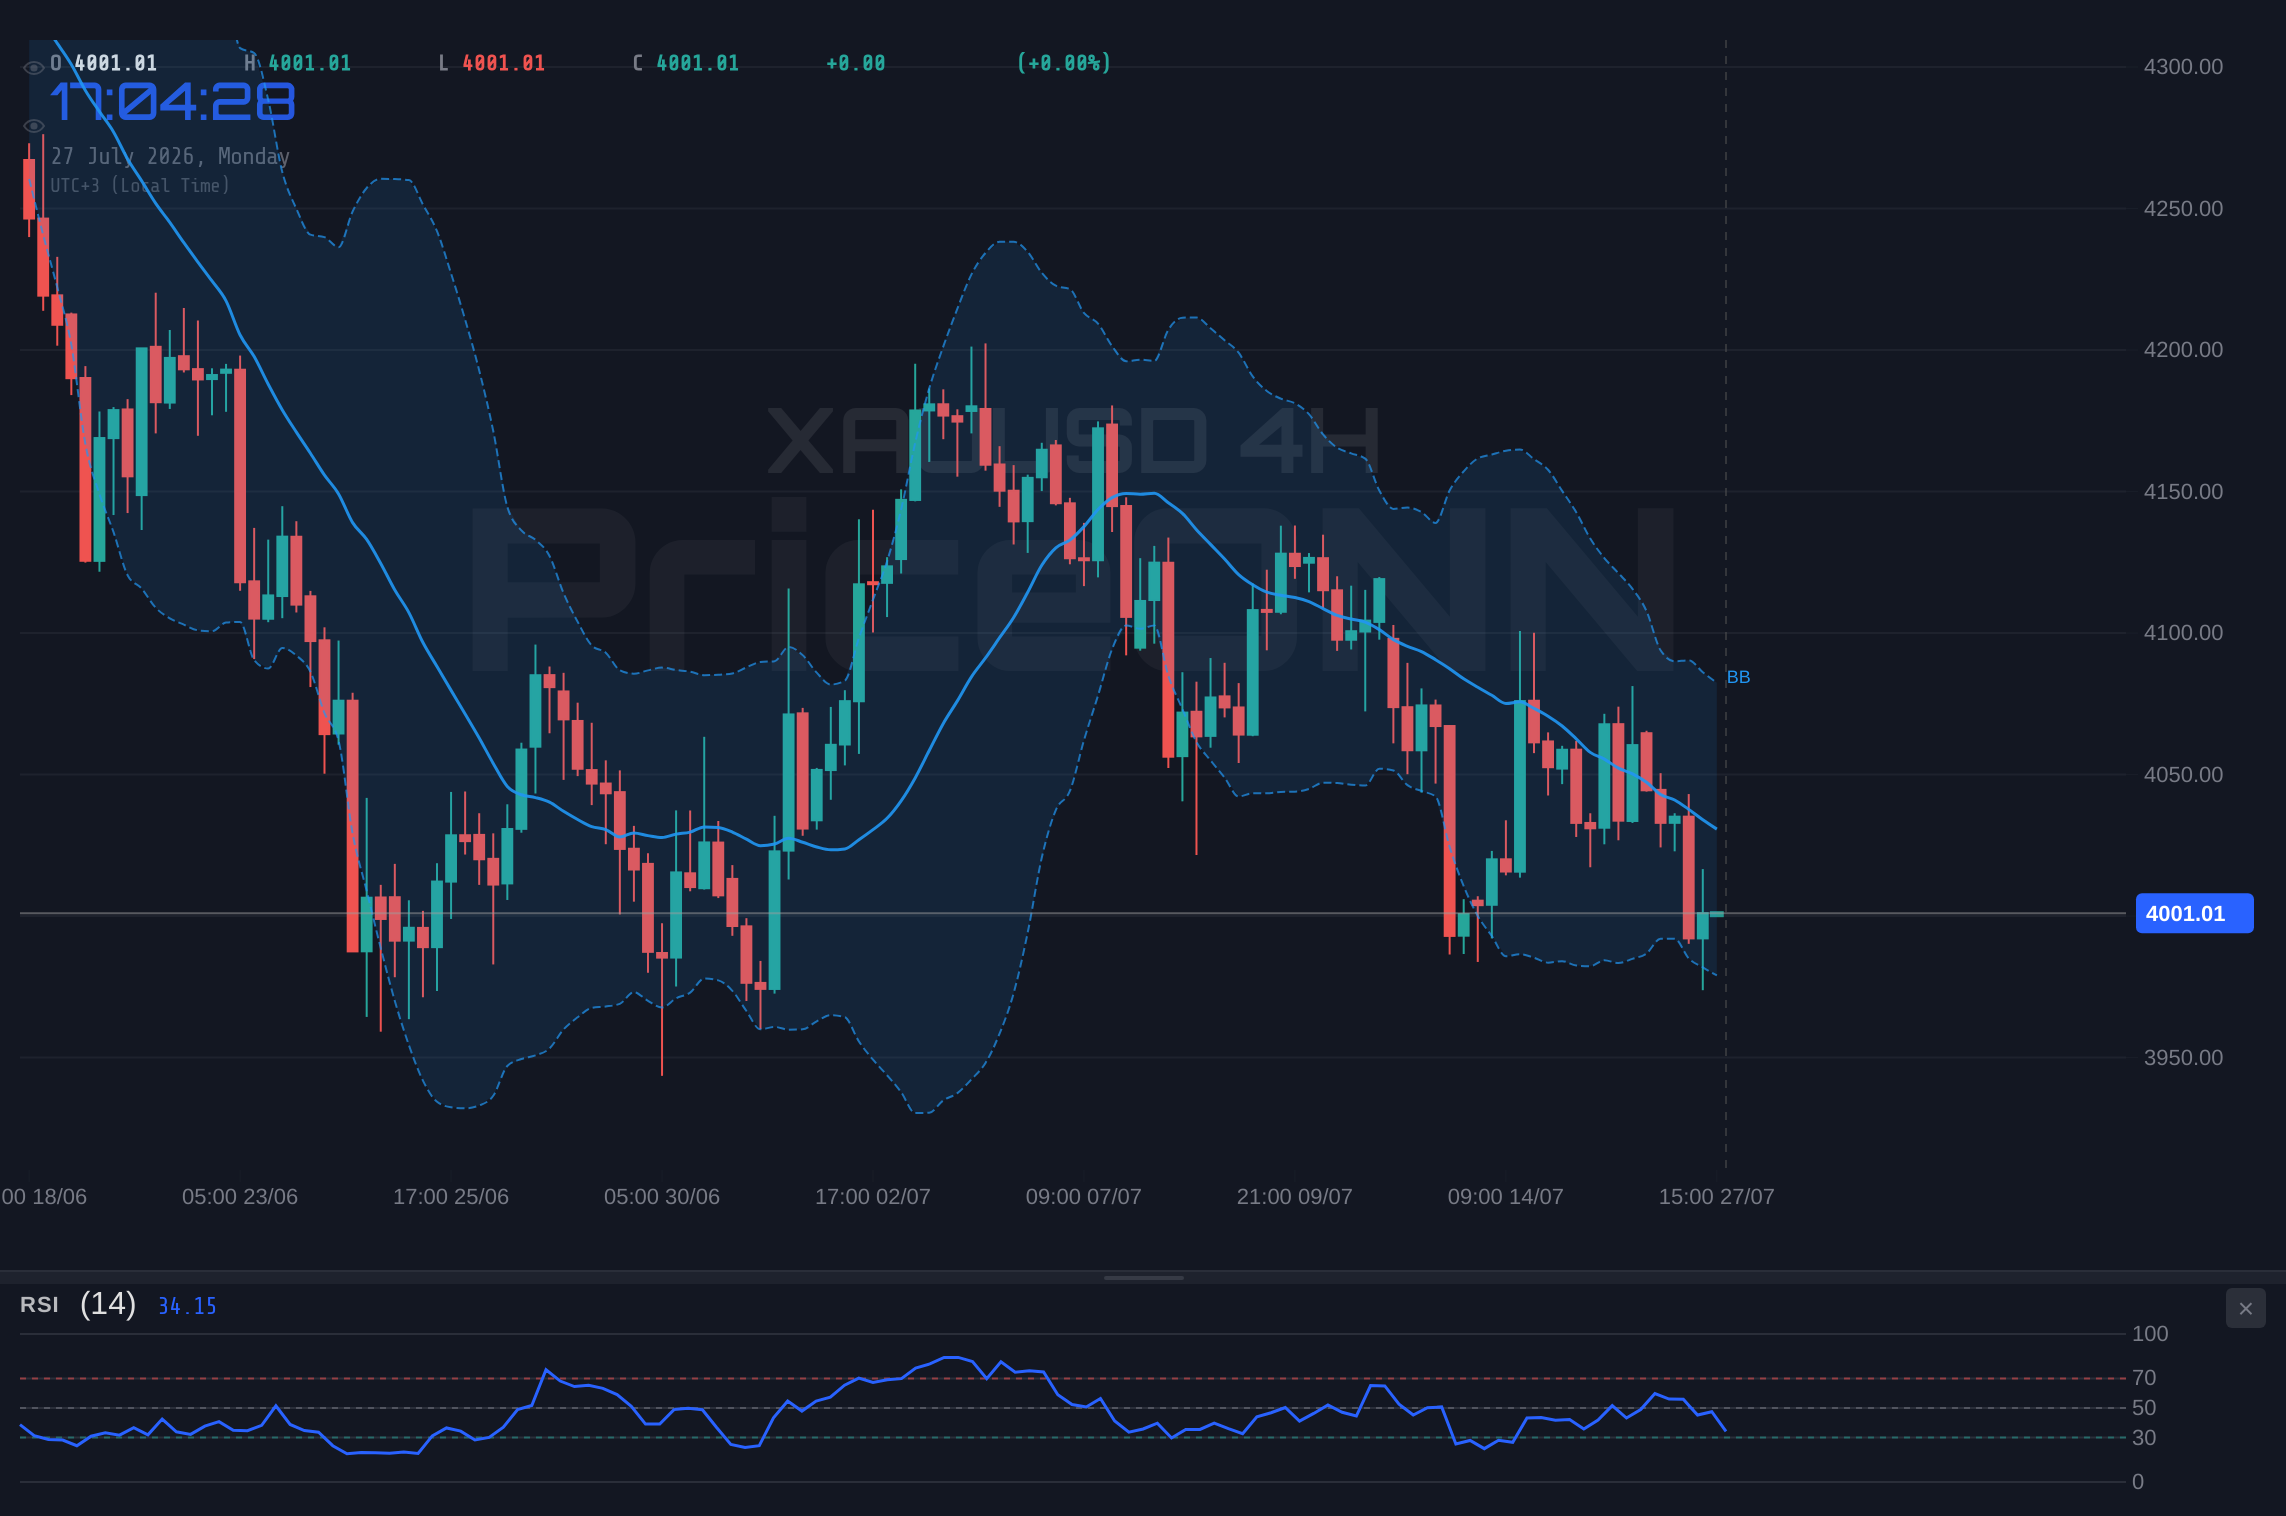
Shifting to the 4-hour timeframe, the picture becomes clearer and more concerning for gold bulls. The trend is definitively down, with a strength of 83%. Support levels are marked at $3,973.82, $3,955.54, and $3,920.9. Resistance is seen at $4,026.74, $4,061.38, and $4,079.66. The RSI here is at 40.59, still in neutral territory but showing a clear bearish lean. MACD confirms negative momentum, lurking below its signal line. Bollinger Bands are hugging the lower half of the channel, indicating strong downward pressure. The Stochastic indicator is deeply oversold, with %K at 18.51 and %D at 31.25, showing a clear bearish signal. The ADX at 15.79 is surprisingly low, suggesting a weak trend on this timeframe, which can sometimes precede a sharp move or indicate a range-bound market. However, the overwhelming sell signal across most indicators here suggests that any rallies are likely to be met with selling pressure. The overall signal leans heavily towards 'SELL'.
The daily timeframe provides the most significant context, and it's not friendly for gold. The trend is a strong downtrend with 95% strength. Support levels are found at $4,024.67, $3,988.95, and $3,960.65. Resistance is formidable, starting at $4,088.69, followed by $4,116.99, and $4,152.71. The RSI is at 38.86, firmly in the bearish camp, showing considerable room before any oversold conditions could be considered. The MACD, interestingly, shows positive momentum and is above its signal line, which contradicts the overall bearish trend. This is a critical divergence to watch. Bollinger Bands are below the middle band, confirming the bearish bias. The Stochastic indicator shows %K at 26.18 and %D at 44.73, a clear bearish signal. The ADX at 39.16 indicates a strong downtrend is in place. This combination of strong daily trend, bearish RSI and Stochastic, but conflicting MACD, creates a complex scenario. The immediate pressure is downwards, but a significant shift in MACD could signal a potential reversal, albeit from current bearish conditions.
Now, let's talk about correlation. The Dollar Index (DXY) is currently at 100.70 and showing upward momentum. Typically, a strengthening dollar puts downward pressure on gold, as they are inversely correlated. With DXY moving higher, this adds another layer of bearish sentiment for XAUUSD. The fact that gold is falling while the dollar is rising is a classic bearish sign for the precious metal. Furthermore, the S&P 500 is showing a strong upward trend at 6572.87, indicating a healthy risk appetite in the broader markets. This usually doesn't bode well for safe-haven assets like gold, which tend to perform better when risk sentiment is negative. However, gold's recent decline suggests it's not currently benefiting from any flight-to-safety narrative, possibly due to the dollar's strength or specific market dynamics affecting commodities.
The recent news flow also provides some context. Reports from July 27th suggest that easing Middle East tensions, partly due to US-Iran truce hopes and a pause in strikes, have led to falling oil prices. This reduction in inflationary pressure, coupled with a stronger dollar and the absence of immediate geopolitical shocks, removes some of the typical catalysts for gold's rally. For instance, the news of European natural gas prices plunging 8.6% also points to a decrease in energy-driven inflation fears. While gold often acts as an inflation hedge, a cooling inflation outlook, even if temporary, can reduce its appeal. The EUR/USD pair is also showing weakness, trading near 1.14436, which aligns with the stronger dollar narrative and further suggests a risk-off sentiment or at least a preference for dollar-denominated assets over other majors.
Considering the technical signals and the macroeconomic backdrop, gold is in a precarious position. The daily trend is strongly bearish, supported by RSI and Stochastic readings. The 4-hour chart reinforces this with a clear sell signal across most indicators. However, the 1-hour chart presents a conflicting picture with a bullish Stochastic divergence, suggesting a potential short-term bounce. This is the classic 'watch zone' scenario. For a clear trade setup, we need confirmation. A sustained break above the 1-hour resistance at $4,019.21 could signal a short-term recovery, but the more significant test will be breaking through the daily resistance levels, particularly the $4,088.69 mark. Conversely, a break below the immediate 1-hour support at $3,991.8 could accelerate the decline towards the daily support at $4,024.67 and beyond.
The trade recommendation decision is 'WATCH_ZONE', and it's crucial to understand why. The ADX at 15.79 on the 4-hour chart indicates a choppy, ranging market, making any directional trade inherently risky. While the RSI and MACD histogram on the daily chart suggest a clear downward signal, the conflicting Stochastic reading on the 1-hour chart means we don't have a clean setup. The market is waiting for something to break the current stalemate. A daily close above the $4,088.69 resistance level would be a significant bullish development, potentially opening the door for a move towards higher targets. However, until such a decisive break occurs, caution is the operative word. We need to see a clear commitment from either the bulls or the bears before entering a position. The current price action around $4,001.21 is indecisive, and forcing a trade here would be speculative rather than strategic.
What does this mean for traders right now? It means patience. Waiting for a clear signal is paramount. For short-term traders looking for a quick scalp, the 1-hour chart might offer opportunities on bounces off $3,991.8, but these are high-risk trades with tight stop-losses likely needed just below that level. The probability of success on such trades is lower given the stronger bearish signals on longer timeframes. For swing traders, the current environment is not conducive to entering new positions. It's better to wait for a decisive break above $4,088.69 or a confirmed break below the daily support at $4,024.67. The divergence between the short-term bullish Stochastic and the longer-term bearish indicators is the key conflict. Until this resolves, it's a 'wait and see' game. We need to see if the bearish momentum on the daily chart will eventually overwhelm the short-term signals, or if a confluence of factors will lead to a sustained rally.
The current price action around $4,001.21 is a battleground. The bears have pushed gold down, but the bulls are showing signs of life on shorter timeframes. The daily trend is still firmly bearish, with strong ADX at 39.16. However, the MACD divergence on the daily chart is a critical signal that cannot be ignored. If this divergence holds and starts to play out, we could see a reversal. But for now, the immediate pressure is downwards. The key levels to watch are the 1-hour support at $3,991.8 and the daily support at $4,024.67. A break below $3,991.8 would likely accelerate the move towards $4,024.67. On the upside, resistance at $4,019.21 needs to be cleared to even consider a bullish short-term outlook, with $4,088.69 being the major hurdle for any significant trend change.
The geopolitical landscape and economic data releases in the coming days will be crucial. While recent news has pointed towards easing tensions and cooling inflation, any resurgence of geopolitical risk or hawkish comments from central banks could quickly shift the narrative back in favor of gold. The DXY's current strength at 100.70 is a headwind, but a significant shift in Fed policy expectations could weaken the dollar and, by extension, boost gold. For now, the technicals suggest caution and a bearish bias on longer timeframes, with short-term fluctuations providing noise rather than a clear direction. The market is waiting for a catalyst, and until then, navigating these choppy waters requires discipline and a keen eye on the key levels provided.
The current technical setup on XAUUSD presents a classic 'watch zone' scenario. While the daily trend remains bearish with strong ADX readings and bearish RSI/Stochastic signals, the 1-hour chart shows conflicting bullish momentum from the Stochastic indicator. This divergence creates uncertainty, making aggressive directional trades risky. A decisive break above the 1-hour resistance at $4,019.21 would be needed to signal a potential short-term bullish reversal, but the true test lies at the daily resistance of $4,088.69. Conversely, a failure to hold the 1-hour support at $3,991.8 could lead to a swift move towards the daily support at $4,024.67. The interplay between these levels, coupled with upcoming economic data and geopolitical developments, will dictate gold's next significant move. Traders should prioritize risk management and wait for clear confirmation before committing capital.
The market sentiment, as indicated by the overall 'SELL' signals across multiple timeframes, suggests that the bears are currently in the driving seat for gold. However, the conflicting signals on the 1-hour chart, specifically the bullish Stochastic crossover, warrant attention for potential short-term counter-trend plays or early signs of a reversal. The ADX at 20.26 on the 1-hour chart indicates a moderate downtrend, but the overall weakness in trend strength across timeframes suggests that the market might be consolidating before its next major move. The critical juncture remains around the $4,001.21 price point. A sustained move above $4,019.21 would be the first sign of a bullish shift, but the real confirmation would come from breaking daily resistance levels. Until then, the path of least resistance appears to be lower, with immediate support at $3,991.8 and $4,024.67 acting as key levels to monitor.
Considering the current data, the most prudent strategy is to remain on the sidelines until a clearer picture emerges. The confluence of bearish daily signals, a strengthening dollar (DXY at 100.70), and easing geopolitical tensions suggest that the downside risks for gold remain elevated. However, the short-term bullish Stochastic divergence on the 1-hour chart cannot be entirely dismissed. It might offer a brief window for a scalp trade, but only with extremely tight risk management. The primary thesis remains bearish until gold can decisively reclaim and hold levels above $4,088.69. Until then, any rallies are likely to be met with selling pressure, making it a seller's market in the medium to long term. The battle for control is fierce around the $4,001.21 level, and the outcome will set the tone for the coming days.
Bearish Scenario: Sellers Retake Control
70% ProbabilityNeutral Scenario: Choppy Consolidation
20% ProbabilityBullish Scenario: Short-Term Bounce
10% ProbabilityFrequently Asked Questions: XAUUSD Analysis
What happens if XAUUSD breaks below the $3,991.8 support level?
A break below $3,991.8 on the 1-hour chart would likely accelerate the downtrend, targeting the daily support at $4,024.67. The ADX at 39.16 on the daily timeframe suggests strong momentum behind such a move.
Should I buy XAUUSD at current levels of $4,001.21 given the conflicting Stochastic signal?
Buying at current levels is speculative due to the strong bearish daily trend. While the 1-hour Stochastic shows a bullish signal, it contradicts longer-term indicators. A confirmed break above $4,019.21 would be a more reliable bullish trigger, but even then, caution is advised due to resistance at $4,088.69.
Is the RSI at 37.81 a sell signal for XAUUSD right now?
An RSI of 37.81 on the 1-hour chart indicates bearish momentum, suggesting that sellers are in control. While not yet oversold, it supports the overall bearish outlook and indicates that rallies may face selling pressure.
How will the DXY's strength at 100.70 affect XAUUSD this week?
The rising DXY at 100.70 typically exerts downward pressure on gold due to their inverse correlation. This strengthens the bearish case for XAUUSD, suggesting that rallies might be capped as long as the dollar remains strong.
| Indicator | Value | Signal | Interpretation |
|---|---|---|---|
| RSI (14) | 37.81 | Bearish | Nearing oversold territory, indicating selling pressure. |
| MACD Histogram | -0.59 | Bearish | Negative momentum suggests sellers are dominant. |
| Stochastic (%K) | 40.52 | Bullish | Potential short-term reversal signal as %K crosses %D. |
| ADX | 20.26 | Neutral | Moderate trend strength, indicating choppiness. |
| Bollinger Bands | Middle Band | Bearish | Price below middle band indicates downward pressure. |
Track markets in real-time
AI-powered analysis, technical indicators and real-time price data.
Join Our Telegram Channel
Breaking market news, AI analysis and trading signals instantly.
Join Channel